Read all sorts of commentaries and tips across a range of racing disciplines on the most popular horse racing blog in Britain, from staff and guest writers.
In the last couple of weeks, the Geegeez Query Tool has been upgraded with many exciting new additions, writes Dave Renham. To read about these changes click here.
One of the new options means we can now analyse how the run style of a horse last time out potentially affects their next race. The Query Tool includes a set of ‘Last Run’ (and 2nd Last Run) variables, including LTO Pace score, which tells us what run style the horse displayed on their most recent start.
Run style is a topic I have written numerous articles about before; this is simply because it is still an area that is under-researched compared with most others. Furthermore, it is partly misunderstood by some, but most importantly it has the potential to give us punters an edge.
To recap, then, run style data on Geegeez is split into four sections - Led, Prominent, Mid Division and Held Up. Here is a quick explanation of which type of horse fits which type of pace profile:
Led – horses that lead early, usually within the first furlong or so; or horses that dispute or vie for the early lead;
Prominent – horses that lay up close to the pace just behind the leader(s);
Mid Division – horses that race in the middle of the pack but in front of the rear ‘quarter’;
Held up – horses that are held up at, or near, the back of the field.
Geegeez assigns points in regard to which position a horse adopted early in its race. Leaders get 4, prominent runners 3, horses that ran mid-division 2, and those held up score 1.
Up until a couple of weeks ago, these pace or run style scores could only be found in the Geegeez Gold Racecard or within the Query Tool under ‘current run’. Now, as I mentioned in the first paragraph, we can get LTO run style data from the last run, and for that matter, the second last run as well. In this article, I am just going to focus on the last run, but I no doubt will be expanding this research to the last two runs in future articles. Let’s crack on.
So where does early pace give us an edge? Essentially, there is an edge in flat racing to horses that lead the race early. Indeed, horses that track the pace also have an edge over those that race midfield or near the back early. This edge is stronger in some races rather than others, but if we look at all UK flat handicaps from 2021 to 2025, we can see how strong this edge actually is. Below is a table detailing the performance of the four main run styles in all these races:
Run style
Runs
Wins
Win %
BSP P/L
BSP ROI
Led (4)
29517
4750
16.09
11718.13
39.7
Prominent (3)
48896
6296
12.88
2751.8
5.63
Mid Div (2)
59892
5939
9.92
-5237.5
-8.74
Held up (1)
68385
5692
8.32
-12133.5
-17.74
Across the four run style groups the win and ROI percentages correlate positively, with leaders outperforming prominent racers which in turn outperform mid div runners which outperform hold up horses.
This front running advantage is stronger over shorter distances. The table below helps to illustrate this as it shows the performance of front runners in handicaps across different race distances:
Distance
Runs
Wins
Win %
BSP P/L
BSP ROI
5f
4309
879
20.4
2994.78
69.5
6f
5702
938
16.45
3165.97
55.52
7
5110
785
15.36
2128.17
41.65
1m to 1m2f
8998
1372
15.25
3187.7
35.43
1m3f+
5334
768
14.4
224.9
4.22
Again, we have positive correlation across the metrics once more.
Of course, it is all very well knowing this, but taking advantage of such front running bias is another matter. It is not as if we have clairvoyance that we can unleash before each race to tell us which run style will be employed by each horse. However, past run style is a solid indicator of future run style as the data I am about to share will show. Let me start with a graph and underneath I’ll explain what it represents:
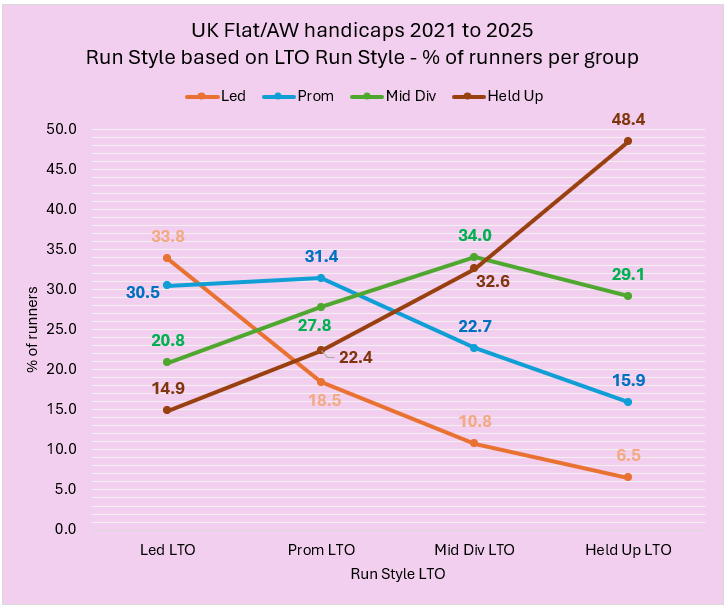
The graph shows the percentage of runners that employed a specific run style based on the run style they showed LTO. Thus, the orange line highlights the percentage of runners that led early in the current race, the blue line is for those who raced prominently, the green one is for those who were mid division, and the hold-up horses are represented by the brown line. We can then match these up with the four LTO run styles shown on the horizontal axis at the bottom. Effectively the graph produces four vertical lines with four coloured dots, where LTO leaders’ line up down the left, moving across until we reach LTO Hold up horses lining up vertically down the right.
Starting with those that led last time out, we can see 33.8% led again next time, 30.5% raced prominently, 20.8% raced in midfield and 14.9% were held up. So LTO leaders are more likely to lead in their next race compared to any showing any of the other three run styles, and there is an almost two in three chance they will lead or race prominently if they led last time.
If we move over to the right of the graph and look at the data for horses that were held up last time, we can see that only 6.5% of these horses led next time, while 15.9% raced prominently, 29.1% raced in mid division and a whopping 48.4% were held up again.
These LTO hold up stats are particularly powerful, showing that nearly half of all horses that were held up on their most recent start show that same style next time. Also, with less than 7% of LTO hold-ups leading next time, when we are trying to predict the front runner of a race, we can fairly confidently dismiss horses that were held up LTO. Overall, this graph highlights that LTO run style can have a significant influence on run style next time in terms of what position they will take up in the race early.
Let me now look at horses that led LTO to see whether we can improve the 33.8% figure for those who went onto lead early next time too. One general finding is that horses that drop in distance lead less often next time out. The table below looks at all handicaps between 5f and 1 mile across the period of study showing the percentages for each run style group focusing on LTO leaders and the distance they raced LTO compared with the current race.
Distance Change
Led%
Prom%
Mid Div%
Held Up%
Same distance
36.3
30.9
19.9
12.8
Down in distance
27.2
30.7
23.3
18.8
Up in distance
37.8
28.3
18.8
15.1
As the table shows, horses that led early last time and now move up in distance led again 37.8% of the time. Sticking to the same distance the figure is 36.3%, but LTO leaders dropping down in distance from their last run find it much harder to lead, their percentage sinking to 27.2%.
The highest percentage I found for horses that led LTO which went on to lead again in their subsequent race came when focusing on LTO winners. This group led 42.7% in their next run.
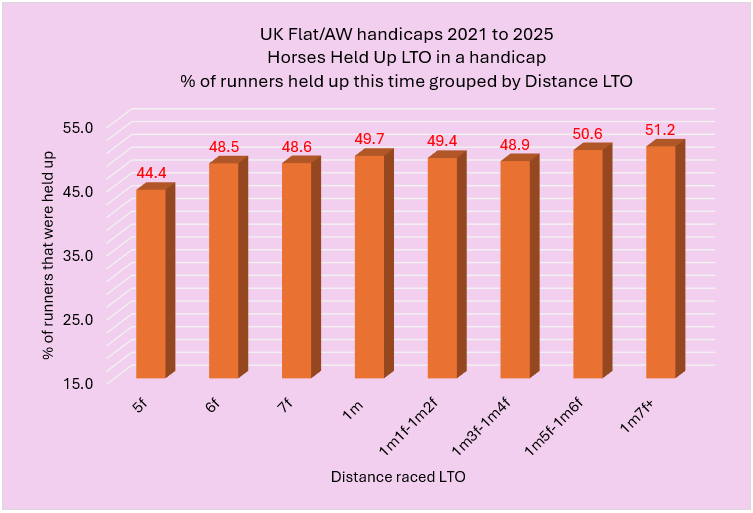
Moving now to horses that were held up LTO, let me look to see whether the distance they raced last time has a bearing in terms of the likelihood they will be held up again next time. For this, I restricted the previous run to being a handicap too as that seemed to make sense. Here are the percentage splits:
This graph shows that most distances run LTO produce very similar figures to what we saw earlier. The LTO 5f stats have the smallest figure at 44.4%, while once we get to 1 mile 5 furlongs or further it sneaks above 50%. It seems therefore, as the saying goes, 'a leopard doesn’t change its spots'.
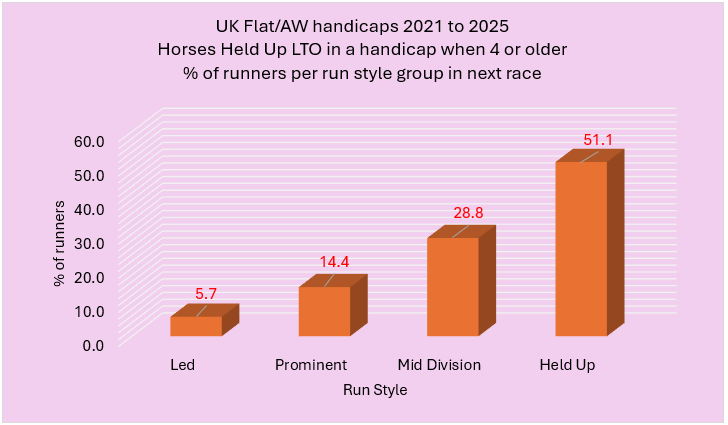
There is one more set of LTO hold up stats I want to share. If we focus on horses that were held up LTO in a handicap, aged four or older, the run style breakdown in their next race looks as follows:
We see that over 51% of older horses that were held up last time, were held up again next time. This slightly higher percentage makes sense as older horses are more likely to have developed a preferred running style. 3yos, and more especially 2yos, have less experience and fewer races under their belt and so are more likely than older horses to switch run styles race to race.
Having dug a little into how the last time out run style potentially affects a horse’s run style in their current race, let me share the bottom lines for each LTO run style. The focus again is on UK flat handicaps spanning the five years from 2021 to 2025, and for this subset I am including LTO runs that were also in UK handicap races (flat/AW).
LTO Run style
Runs
Wins
Win %
BSP P/L
BSP ROI
Led (4)
25447
3130
12.3
229.58
0.9
Prominent (3)
42895
5167
12.05
291.78
0.68
Mid Div (2)
51331
5657
11.02
-2254.62
-4.39
Held up (1)
59098
5851
9.9
-2890.95
-4.89
As we can see, horses that showed a led or prominent run style LTO produced the best strike rates, and both nudged into profit. LTO mid div runners won more often than LTO hold up horses, while both showed losses of between 4p and 5p in the £.
Therefore, based on these numbers, a more prominent sit early in a horse’s previous race does seem to improve its chances next time out.
I want now to restrict the qualifiers to horses aged four or older as I feel this should improve matters based on the fact that cohort are more likely to replicate a run style from last time out. These are the results:
LTO Run style
Runs
Wins
Win %
BSP P/L
BSP ROI
Led (4)
16897
2053
12.15
641.29
3.8
Prominent (3)
28485
3321
11.66
178.43
0.63
Mid Div (2)
35332
3783
10.71
-1568.39
-4.44
Held up (1)
41267
3954
9.58
-2636.54
-6.39
The win rates and ROI%s combine once more to suggest that LTO front runners have been the best value, followed by LTO prominent racers, then LTO mid div, with LTO hold ups bringing up the rear... sorry, I couldn’t resist the pun!
Also, if we now split this ‘older runner last time out Led group’ into those that led in an all-weather handicap LTO compared with those that led in a turf handicap LTO we see an interesting split:
LTO Surface
Runs
Wins
Win %
BSP P/L
BSP ROI
AW
7628
867
11.37
40.12
0.53
Turf
9269
1186
12.8
601.17
6.49
4yos and older that led early in a turf handicap LTO have performed significantly better than those which led in an AW handicap LTO. I am not sure why that is the case but it a worthwhile nugget to be aware of.
Before wrapping this piece up, it is important to note that a few big priced winners have not skewed the results. If we look at 4yos and older priced 8/1 or shorter when racing in a UK handicap after running in a UK handicap LTO we see the following:
LTO Run style
Runs
Wins
Win %
BSP P/L
BSP ROI
Led (4)
8483
1647
19.42
236.48
2.79
Prominent (3)
14177
2648
18.68
130.73
0.92
Mid Div (2)
16613
2973
17.9
-209.92
-1.26
Held up (1)
17567
2985
16.99
-702.84
-4
The same pattern emerges once more, with the strike rates dropping from top to bottom (led to held up) and the profits/returns following the same pattern.
*
So, what has this digging helped uncover?
Well, even something as simple as looking at the run style of a horse last time out when contesting a handicap can give us a bit of a steer in a couple of ways.
Firstly, it can help with establishing a horse's most likely run style next time. We saw that horses that led LTO have led again next time a touch above once in every three races; whereas horses that led LTO adopting an early position near the back of the field next time (held up) occurred only around once every seven runs.
An additional point to note is that LTO early leaders in races of 5f to 1m have been more likely to lead in their next race when either racing at the same distance to last time or if upped in distance.
There were even stronger numbers when looking at horses that were held up LTO. This cohort showed the same held up style again in their following race roughly half of the time, whereas only about one in 15 of them went onto lead early in their next race.
Secondly, I found that horses which led or raced prominently LTO had an edge over LTO hold ups / mid div runners from both a win strike rate and a returns perspective. Additionally, horses aged four and up that led LTO had the best figures, particularly if the LTO race was on turf.
Well, that’s all for this one. The natural progression from here is to look at the combination of run style in the last two runs, and that will be coming soon. Until next time...
- DR
https://www.geegeez.co.uk/wp-content/uploads/2024/03/MrProfessor_LincolnHandicap2024_Doncaster.png319830Dave Renhamhttps://www.geegeez.co.uk/wp-content/uploads/2022/10/geegeez_banner_new_170x78.pngDave Renham2026-07-21 13:32:482026-07-21 14:55:34The Impact of Last Time Out Run Style
What, writes Tony Stafford, does a small money syndicate do when the horse that has won it nine races (seven flat and two hurdles) in 18 months is incapacitated after sustaining an injury during a race at Royal Ascot? Well, the Think Big Syndicate did just that – they thought big and simply got another!
I’ve mentioned the exploits of Carlton in these musings a time or two, having marvelled at the way he moved from a rating of 48 to 82, initially exploiting the frequent handicaps for lower-grade animals that the 1m6f trip at Chelmsford used to afford it.
As his mark rose, the opportunities were less plentiful, but still the magician that is James Owen – himself a shareholder in Carlton – contrived to winkle out three more on the level after an initial four-timer all over that track and trip.
Carlton, a son of Frankel (stud fee £350k), was sourced for the boys in a private deal for £6,000 brokered by bloodstock agent and former jockey Freddy Tylicki, out of the Tracy Waggott yard.
The genes, then, are from possibly the greatest racehorse of all time – I still have Sea Bird II challenging him from my early years writing about racing all those decades ago, as the alternative. None of Sir Henry Cecil’s star performer’s 14 unbeaten runs – all at ten furlongs or shorter – needed a performance to match Sea Bird’s 1965 Arc when he obliterated a line-up of world-class animals and future stallions. But enough of that, Think Big were happy enough to settle for a Frankel! [There aren’t many Sea Bird’s about these days – Ed.]
At one stage over the winter period, Carlton’s hurdles rating – earned at the time of his previous incarnation – wasn’t far short of his flat mark. Two wins, the second a landslide of Andy Burnham’s leadership non-election proportions, brought it to a still manageable 105, but alas Ascot stopped all thoughts of that.
He had finished with great and possibly surprising vigour to be fourth in the Chester Plate, consolation race for the Chester Cup in early May. Maybe you would have thought a run in the second phase of the Northumberland Plate would have been a good idea, but Mick Godderidge, Philip Simmonds, Edmund O’Connor and Leroy Oxley much preferred the prospect of togging up for Royal Ascot.
Even at the elevated mark of 82, Carlton would never have got into the Ascot Stakes, so the Queen Alexandra, final race of the meeting and over 2m5f, was the only possibility.
The boys must have arrived at the track with hopes of a bit of a show for their money, and just before the home turn, Cieren Fallon still had him in the first three, admittedly rowing way. Then, Ryan Moore on favourite and eventual winner Illinois, one of several rated around two stone Carlton’s superior, tightened him up and it appeared to cause Carlton to stumble and instantly lose several positions.
To that end, it was a valiant effort to beat three horses home including the well-backed Willie Mullins runner Columbus (rated 109), but on pulling up it was clear that the race had brought its downside.
Meanwhile, Owen had been to Doncaster sales a month earlier and picked up a dual-purpose performer from the Harry Fry yard, the seven-year-old gelding High Fibre, winner at that stage of two hurdle races (from 15 starts and a rating of 122) and one on the flat (rating 79) from ten appearances.
The price was £15k and James, after Carlton’s Ascot mishap, suggested to Carlton’s co-partners that High Fibre might make a suitable replacement.
I was in the owners’ room after the end of proceedings on the second day of the July meeting at Newmarket, even managing to blag a food ticket for Philip, when they said a horse that they would probably be taking over ownership was running over 1m4f in a late race at York.
We watched closely and the way he stayed on into third place without being asked an over-serious question impressed me. I reckoned that they should have been delighted, not realising only a portion of the tale had been available to me.
A few days later High Fibre was on the much underestimated and underused schooling grounds by Newmarket golf club. Owen, who has done miracles equally with jumpers as with flat horses, had four to school and one was High Fibre with Alex Chadwick doing the honours. The school was to determine High Fibre’s readiness for a challenge for last Saturday’s fifty grand Summer Hurdle. He passed that test and when it became known that champion jockey Sean Bowen would be available, the die as they say was cast.
Thirteen horses were declared on Thursday morning, with High Fibre propping them all up on bottom-weight of 10st7lb. When the first prices came out, Mick was amazed to see his “not yet” horse was available at 20/1. Mick’s business acumen had sealed a deal whereby the quartet would agree to buy the horse from the trainer, paying all the training fees before paying for the horse itself in the near future.
Mick followed up his original bet with one more at 16’s and a third at 12/1. When I saw him resplendent in full Hawaii mode, floppy tea shirt and shorts at Newmarket last Friday, his attire contrasted starkly with Philip’s. Old-school to the core, Phil wore smart jacket and tie, befitting the paddock of the 2,000 Guineas over on the other course, rather than for yet another after-racing concert from evergrey Madness on a Friday night.
Philip said he hadn’t supported him yet but intended having “A nice each-way bet in the morning”. I hope he wasn’t too dismayed to see that by 7 a.m. he was around 7/1 and, by 9 a.m., a strong second favourite at 4/1!
Philip and Leroy attended the meeting, but Mick and Ed could not. Mick said, “Sometimes life, and selling used cars, can get in the way!”
In the race, Bowen soon had him nicely placed behind the leaders who were setting a strong pace. He didn’t hold his position down the back straight second time around the sharp Market Rasen circuit, but Sean held on to him, and kept him wide in the home straight, guaranteeing him an uninterrupted run home.
It wasn’t until going to two out that High Fibre could be seen to be moving up fast. By the last flight, he had got into a share of second place, but the leader, Indemnity, despite conceding 21lb, was five lengths clear and apparently impossible to catch. A mistake there though interrupted his momentum, and High Fibre made mincemeat of him, turning that deficit into a near three-length winning margin.
Later Mick said, “No doubt I will have my account closed. Bookmakers don’t like it when you back any winner, but when it’s 20/1 about a 7/2 shot, they appreciate it even less.”
After the race, Sean Bowen reported that while they were going round, he was thinking High Fibre needed another half mile, but the way he finished off, maybe they could keep the horse to two miles for now.
Having watched Owen’s style in the few seasons he has been training, I reckon High Fibre could well be one for longer-distance handicaps on the flat. Seeing how he handles fast ground, it wouldn’t be too much of a stretch to imagine his winning a race or two and earning a place in the Cesarewitch field.
One thing I can be sure of, though. Nobody will be getting 20/1 about him next time, be it on the flat or over the jumps.
*
Irish Oaks Day on The Curragh on Saturday started with the unwelcome news that Joseph O’Brien’s Epsom Oaks winner Thundering On would not be risked on the fast ground. Joseph and Irish champion jockey Dylan Browne McMonagle had a more than adequate deputy as Johanna Walsh romped to a four-length success. This Sea The Stars filly is improving fast, overturning a narrow defeat by Earth Shot in the Ribblesdale Stakes at Royal Ascot to the tune of almost 12 lengths.
*
There’s one event from Friday night that I cannot get out of my head. Long-term friend Steve Howard had a table of pals in the Newmarket owners’ room and Michelle, one of his group and only recently a convert to racing, had a speculative £5 single line on the Tote Placepot.
When the ticket came back, her selection in the fourth leg was a non-runner and the Tote substituted it as is normal, with the favourite. Unfortunately, the non-runner made it a seven-runner and therefore two places only race.
Subsequently, she did find the winner of that race, Tom Clover’s Rocking Ends, and backed it singly, but it was second favourite rather than the expected favourite at the off. The favourite finished third! Sod’s Law.
Imagine the frustration, all the other five selections won, respectively at 10/11, 15/8, Evens, 3/1 and can you believe it, 25/1! The Placepot that night paid £50.90 to a £1 stake, so she should if life was fair, have collected £254.00 for her fiver. Imagine though had she linked the six in a £5 win accumulator, she would have been more than £16,000 better off! I’ve never seen the like of that before in all my years of racing and punting!
A four-week trial of combining Pace with SR Ratings, Part 2
This the second in a double header where I am sharing a very simple ‘system’ which I tested over a four-week period from May 1st 2026 to May 28th 2026, writes Dave Renham. Before reading on, it would make sense to read the first piece if not done already and that can be found here.
Not everyone is a fan of systems, but my racing journey was enriched by reading books and articles by the racing systems ‘king’, Nick Mordin. Hence, although I don’t tend to use rigid systems per se when selecting my bets, there are systematic elements that I do lean on within the whole process.
It should be noted that in order to find these system selections, a Geegeez Gold membership is required as that includes access to some of the key data needed.
To recap here are the ‘system’ rules:
UK Handicap races only
Race Distance 5f to 1m1f
The Percentage of Rivals figure (PRB) for the ‘led’ group on the pace tab for the specific race conditions must be 0.60 or higher
Horse must have one of the top three pace scores for the race
Horse must have one of the top three SR ratings for the race
Note that if there were two joint third rated pace horses then both would potentially become a qualifier if either or both of their SR rating positions were also in the top three. If there were three or more joint thirds, then I would count the two with the highest most recent race pace scores. In terms of SR rating joint thirds, I need to include them all as I have no way of splitting them. Also, if a horse had only three previous pace race scores, I would use their pace average figure to compare with the four race averages that most horses have. In this case, the horses with the three highest averages across either three or four past races would count. I did not consider horses with one or two past scores.
I mentioned in the first article that I am only using handicap races, as they give us the most reliable results for this type of idea.
In that first part I shared the results for weeks one and two. Again, just to recap, these are below with profit/losses based on BSP (Betfair SP) less 2% commission.
Week 1
Week 2
First two weeks combined
So, all in all, the first fortnight delivered some positive early findings. Of course, the sample size at this juncture was still relatively small. However, a further positive after these 49 races was that there had been 11 second places as well.
Time to move into week 3.
Week 3
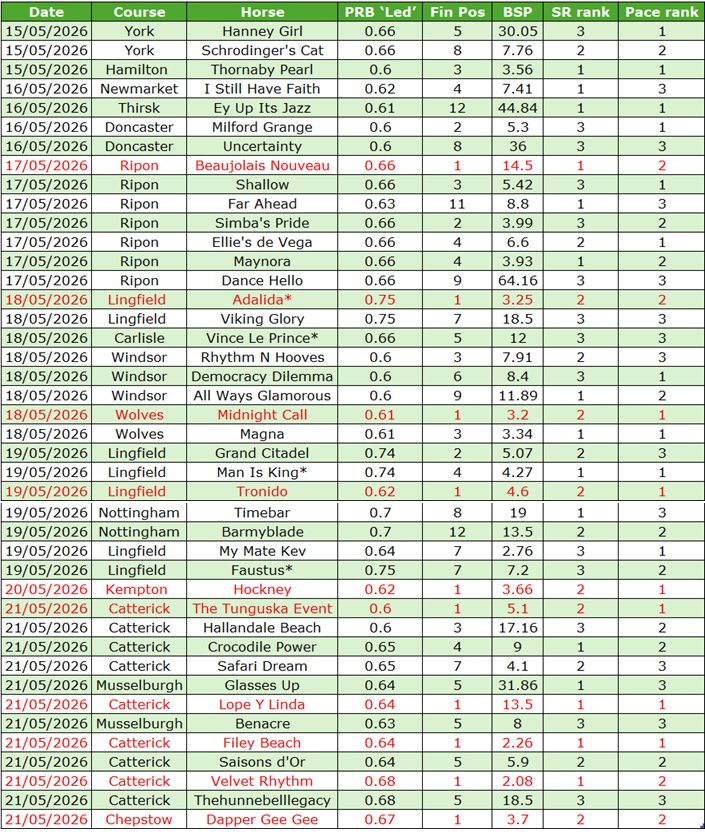
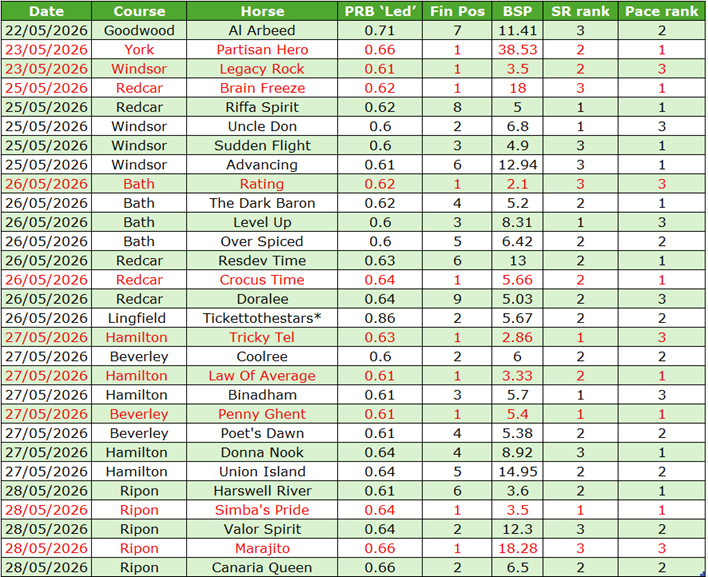
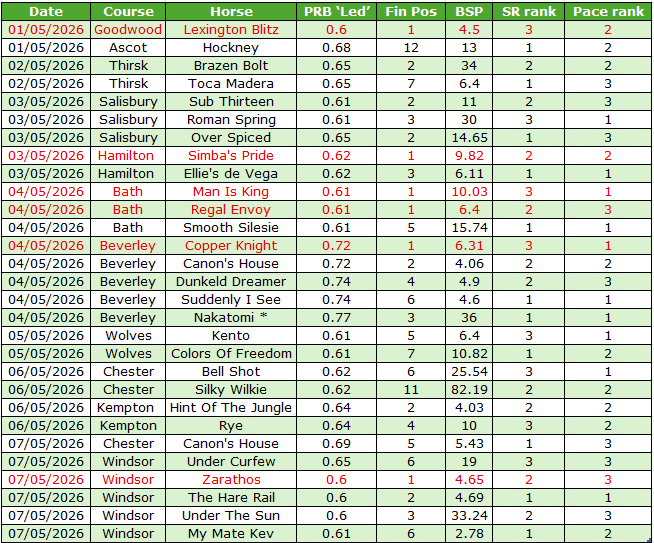
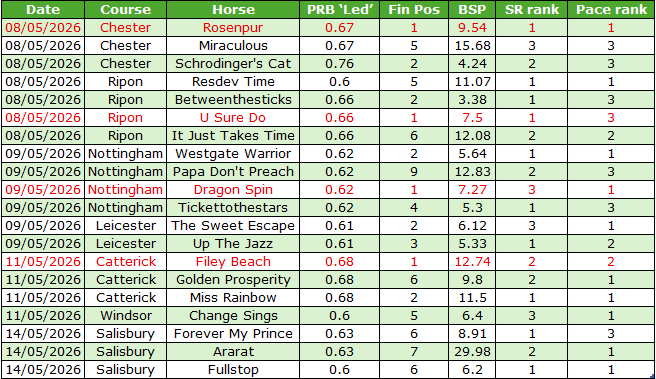
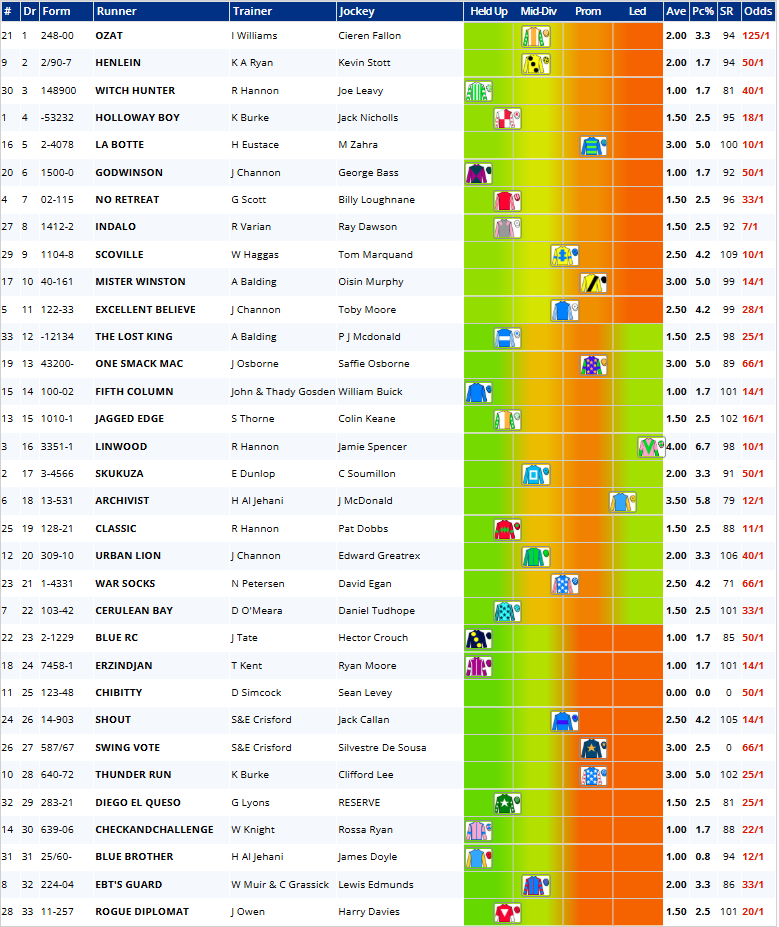
The results for the third week were as follows, with winners highlighted in red. There were four qualifiers where the PRB ‘led’ sample size was small and those horses have an asterisk next to their name:
The last two days of the third week (20th and 21st) saw an excellent run of results with six wins from just 13 qualifiers. Previous to that there had been four winners from 29 showing a small loss of £3.88. The overall figures for the week ended up like this:
We saw the best weekly strike rate to date, but there were less near misses with only three second places (five thirds). Hence, there could be a valid argument that this week was a tad lucky, with so many winners. However, as we know it is better to be lucky than good. Although even better to be lucky and good!
I was three weeks in now and the overall results read as follows:
All three weeks were consistent with win rates around the 20% mark and solid profits each time. Will we see a similar pattern in week four? Well, let’s find out.
Week 4
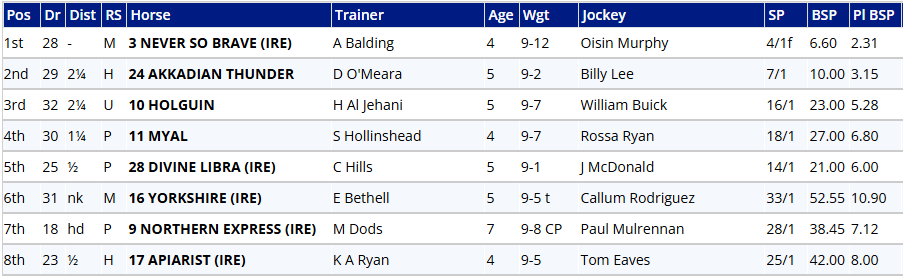
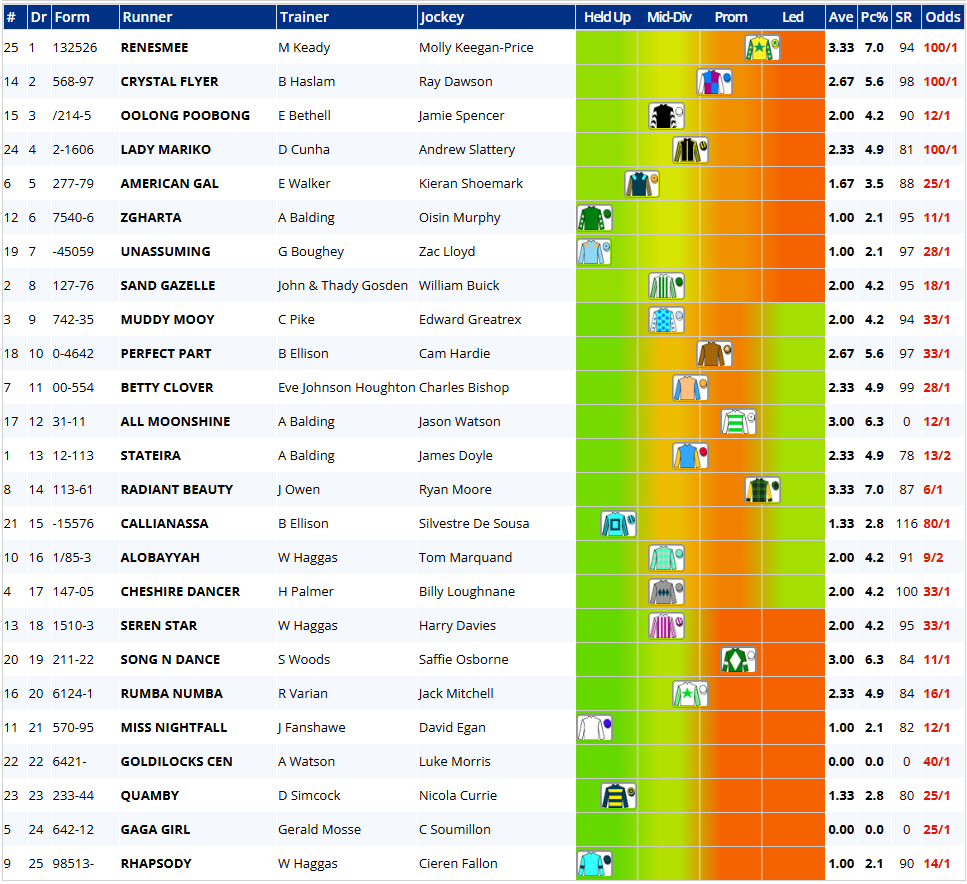
The results for the final week are shown in the table below with winners once more highlighted in red:
The final week of the four-week experiment went with a bang rather than a whimper with ten winners from 29 runners. There were five seconds, too, so over half of the qualifiers finished in the first two. The profit and loss figures are shown below:
A huge profit and returns across the seven days of over 242 pence in the £. Yes, this bottom line was helped by a BSP winner priced 38.53 in Partisan Hero, but even if we take that winner out, after commission, profits still stood at +33.56.
With the four weeks up, I can now share the final totals:
This has been a pretty amazing run of results across the 28 days to create such figures. Of course, we cannot get too carried away, as 120 bets across four weeks is essentially a snapshot. However, it is a snapshot that makes me want to expand my research to other weeks and months and see what they bring.
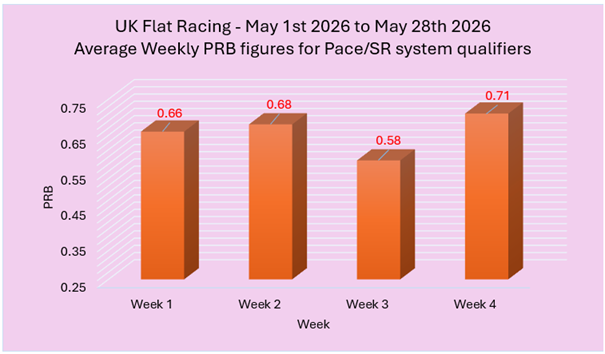
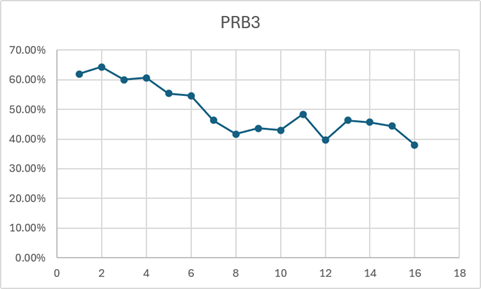
So far, I have shared just the results without doing any additional digging into the underlying numbers; I'm sure there are some extras for us starting with the average PRB figures for the system qualifiers week by week. The graph below shows the splits:
When analysing PRBs we need to appreciate that the average figure for all runners in all races is 0.50. This is the benchmark to judge against. Anything above 0.55 is usually seen to be positive and once we get to 0.60 and above then we have a strong positive. Therefore, for three of the four weeks to have average figures for all qualifying horses of over 0.65 is exceptional. Even week 3’s figure of 0.58 is very decent. These findings give me much more confidence in the small four-week sample I have looked at.
PRBs are a useful metric because in many respects they expand sample size by considering all runners in each race. For the record the overall average PRB for qualifiers across all four weeks was a very strong 0.65.
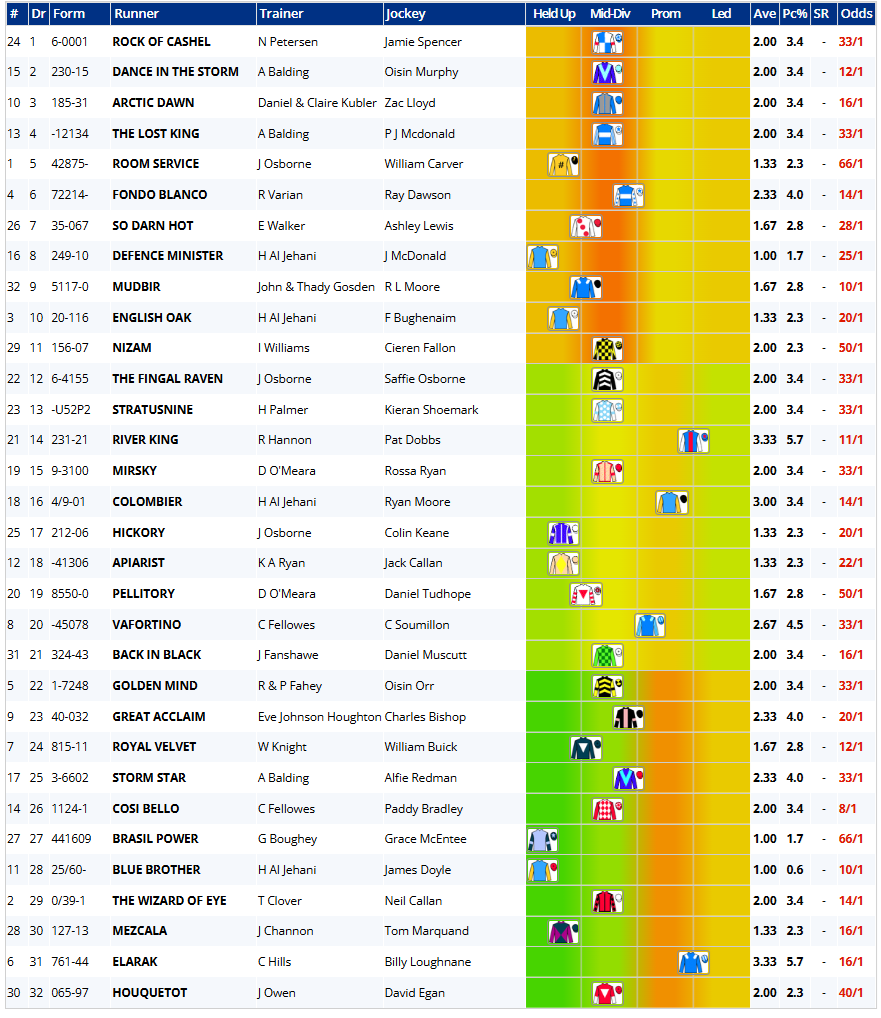
I want to focus now on the 30 winners and see which run style they employed in the individual races where they came home in front. Being in the top three of the racecard pace figures for their specific races means I would have expected a led or prominent style in the race to be more likely than a mid-division or hold up one. The graph below shows the splits in terms of percentage of runners within each run style group:
As predicted (and hoped), we see that most of the winning qualifiers had a led or prominent style; in fact, five from every six winners did. This helps cement further how effective the four racehorse pace figures in the Geegeez Racecard are in terms of helping to predict run style.
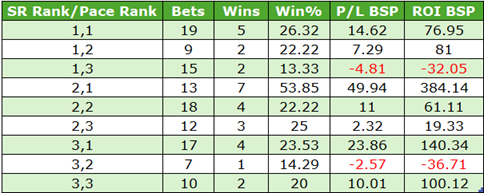
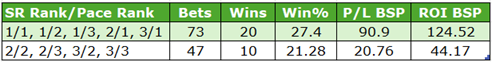
Finally, I wanted to look at the results based on their actual ranking within the SR rank and pace ranks. Hence top rated in both would count as a 1,1 in the table below.
Of course, as we have nine combinations the sample sizes for each are very small. However, what was interesting was when I split the results up comparing those where at least one of the two rankings was top (e.g. 1/1, 1/2, 1/3, 2/1 and 3/1) compared with those that weren’t. Here are the splits:
Those with at least one top ranked position did much better. Again, the important caveat is that the samples are quite modest. However, there is a big difference between the PRBs for each group with the 'top ranked' group averaging 0.67 and the other at 0.59.
*
That's enough for this two-parter but I hope, if nothing else, the performance of this Geegeez Gold system, albeit over just four weeks, has provided food for thought. Personally, I will be doing more digging into this system, that is guaranteed!
Until next time...
- DR
https://www.geegeez.co.uk/wp-content/uploads/2026/07/PSR2_11.png352605Dave Renhamhttps://www.geegeez.co.uk/wp-content/uploads/2022/10/geegeez_banner_new_170x78.pngDave Renham2026-07-14 14:31:532026-07-14 14:31:53Combining Pace and SR Ratings, Part 2
Mention it quietly, the youngsters are coming, writes Tony Stafford. Saturday’s July Cup at Newmarket was a refreshing change as future champion jockey Billy Loughnane teamed up for the first time with Aidan’s youngest, Donnacha O’Brien, and collected the big prize with 11/1 shot Commanche Brave.
Commanche Brave, a four-year-old son of Wootton Bassett – who else? – had been only seventh but less than three lengths behind the winner Almeraq in the Queen Elizabeth II Jubilee Stakes at Royal Ascot, but now, nicely poised all the way, never looked likely to be beaten.
The nature of top-class sprints at a period of no outstanding divisional champion is to have a host of contenders still in the mix going into the closing stages. It was slightly the other way around at Newmarket, five others keeping on, three from unpromising positions, to get within hailing distance of the winner. The first six were again within less than three lengths.
While Almeraq in ninth didn’t live up to his form from the Royal meeting, both Commonwealth Cup heroine Venetian Sun and Japan raider and 2/1 favourite Satono Reve, who was second to Almeraq last time, had been there all the way to take the minor places.
Just over a length back in third, Satono Reve was sending another compliment, as if he needed one, to Hong Kong’s finest, Ka Ying Rising, who had him a grovelling second, more than four lengths back, when they met at Sha Tin in April. It would be great if Ascot could entice his connections to let him come over for next year’s Royal meeting.
Last weekend, Donnacha O’Brien had achieved an excellent performance with sister Ana’s A Boy Named Susie when second to Constitution River in the Coral-Eclipse at Sandown. There was a further family connection this weekend; Aidan and wife Anne-Marie’s Whisperview Trading Ltd are the breeders of Commanche Brave.
For the parents, that took away some of the pain from the less than brilliant effort of another Ascot winner, Mission Central, aiming to stretch out over an extra furlong from his win at the minimum in the King Charles III Stakes. He was one of the first beaten when the field set off up the climb towards the finish.
It was a mixed week for Aidan, with both Precise on Friday – never going fast enough to peg back Andrew Balding’s Blue Bolt in the Group 1 Falmouth Stakes – and on Saturday coming out second in a drawn-out conclusion to the Superlative Stakes. In this, both his odds-on shot Abraham Lincoln and market rival Charlie Appleby’s Al Hubaida showed greenness before the latter got the verdict on the line.
The earlier two-year-old maiden brought a win to Ballydoyle, via Justify colt Haffner over Godolphin’s Al Wathba, the latter a colt by Wootton Bassett. This was the race where last year Appleby’s Distant Storm came out on top with none other than Constitution River as the runner-up.
As usual, the multiplicity of top meetings on Saturday will have annoyed the purists. York had the John Smith’s Handicap and a Group 3 heading its card; Ascot had a Group 2 and another Heritage handicap, matching the Bunbury Cup at Newmarket as a major back-up to the top events.
Even Chester, relegated to only fourth-place status, would no doubt have attracted its usual massive crowd. Their feature was a £34k seven-furlong Listed, while all the other seven races on an eight-race card carried identical win money of £7,731. Still, any winner’s a winner!
I would love the July meeting to revert to its traditional Tuesday to Thursday slot, leaving Ascot and York to have a more dominant position in the Calendar. There were 16,000 people on the July Course on Thursday, Ladies Day, but only half that number on Friday.
I had a nice chat with quite a few trainers over the first two days at Newmarket but neglected to quiz Ian Williams whether he fancied anything for the Saturday. Of course, I should have asked him his thoughts about Aalto, going for a second win after his 2024 victory in the Bunbury Cup – one of my favourite handicaps ever since Pinctada, who originally raced in my colours, won the race for Terry Ramsden in 1988.
Last year, Aalto was caught in the final stride in the race by More Thunder, nowadays a Group-race performer for William Haggas. Now, from the foot of the handicap, and running off 5lb lower, no wonder he and William Buick headed the market. He won comfortably and no doubt will continue to be a feature in valuable handicaps.
*
I know I often turn this article around to stuff that’s happened to me as in the Pinctada episode. The summer before his Bunbury Cup success, he won six races in a period of 20 days for Rod Simpson at a time when horses could run for almost three weeks after a win with just a single penalty if the timing was right. Glory days.
More recently, I have owed a debt of gratitude to Raymond Tooth. The world-famous family lawyer signed me up in 2007 and for most of the time since Ray punched above his weight. Now, in his mid-80’s he has finally decided to retire and close his Sears Tooth law firm.
I was grateful to be given the role of racing manager at a time when several part-time jobs that I had after taking early retirement from the Daily Telegraph evaporated away.
We first met on the day Punjabi was a runaway 19-length winner of the Grade 2 Adonis Hurdle at Kempton, introduced through mutual friend Derek Hatter. Coincidentally, he was looking for someone to ease the burden of keeping up with 30 horses in training along with his demanding day job.
In the winner’s room, my credentials were advanced to him by my long-time acquaintance, the late Brod Munro-Wilson, who was also there that day. Years before, I had bought Talon, a staying jumper for Brod. He was one of 12 winners in a single day, one Boxing Day, yet another record set by Michael Dickinson. Can you match that one, Dan Skelton?
Punjabi went on to win a Champion Hurdle for Nicky Henderson, not bad for a one-time seven-furlong handicapper on the flat and a £42k HIT sales buy out of the Geraldine Jones yard. Some trainer, that Henderson!
It wasn’t just on the NH side of things that Ray enjoyed success. He paid £25k for a yearling filly by Indian Ridge with Richard Hannon. The year before we met, she collected almost £140k when winning a sales race for juveniles and went on to win the Cheveley Park Stakes.
After finishing just behind the placed horses at Newmarket, she missed out on a run in the Irish 1,000 Guineas, Richard waiting for the Coronation Stakes at the Royal meeting. It rained heavily on the morning of the race, and Steve and Kevin Howard, my pals, had a right old killing along with a couple of their mates, at well beyond the 8/1 starting price.
Richard Hughes waited before sending her into full stride a furlong from home and, amazingly in view of the opposition, which included the winners (in order of finish) of the German (Mi Emma), French (Darjina), English and Irish (Finsceal Beo) 1,000 Guineas among the 13-runner field, she obliterated them all.
Indian Ink strode majestically clear to win by six lengths, a performance that brought a 2million gns bid from Hamdan Al Maktoum’s Shadwell Stud at the end of the year. The one sadness for Ray, and me to a lesser extent, was the fact she never raced again after that Coronation Stakes, while many of her “victims” continued to thrive.
Ray’s last big winner came after he was recommended to French trainer Nicolas Clement by agent Charlie Gordon-Watson. After an unremarkable start, Nicolas suggested he find one for Raymond himself and he came up with the already-named French Fifteen, a colt by Turtle Bowl, bought at the sales in France as a yearling for €30k.
He won five in a sequence of six races as a two-year-old, culminating in the comfortable success in the Group 1 Criterium International at Saint-Cloud. Within a few days, French Fifteen had been sold to Qatari connections and he came across to Newmarket the following May to run Camelot close in the 2,000 Guineas – some performance against the O’Brien colt before his Derby success.
As I said, Raymond always punched above his weight, like his long-time right-hand man Steve Gilbey. Both men have been true friends and have been valued life advisors to me for the best part of 20 years. I hope Ray continues to enjoy good health and retains the knack of picking out winning patents from his modest wagers in the Star Sports betting shop in Mayfair.
A four-week trial of combining Pace with SR Ratings, Part 1
Back in May of 2025 I wrote a couple of articles looking at 5-furlong handicaps with the focus being the scores for each horse found in Geegeez Racecard pace tab, writes Dave Renham. In the second of those pieces, which can be read here, I looked at a set of results based on the top three horses ranked in terms of pace scores in their specific race, when they also appeared in the top three of Peter May’s SR ratings for said race.
The findings were extremely promising over the whole year for horses in the top three of both as the table below shows:
Considering these results came from combining all UK courses, some of which do not strongly favour horses that race close to, or on the pace, I think the results were even more impressive.
In this article I will revisit that idea but before getting to the meat and bones, let me briefly discuss the pace tab and SR ratings, especially for new readers.
The pace tab shows the running styles of the horses for a maximum of their last four races. Each past running style is given a score of between four and one. The breakdown is as follows:
4 – Front runner / early leader
3 – Prominent racer
2 – Raced in midfield / mid division
1 – held up near or at the back early
Past number crunching has noted that early leaders / front runners have a strong advantage over other running styles at some of the shorter distances. This front running bias does not occur at every ‘shorter’ course and distance, but at a significant number.
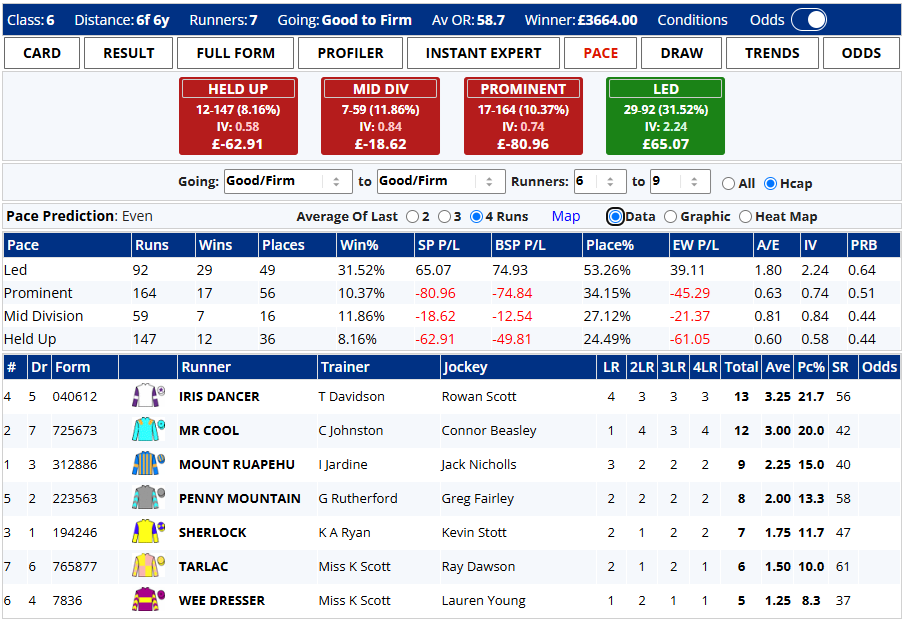
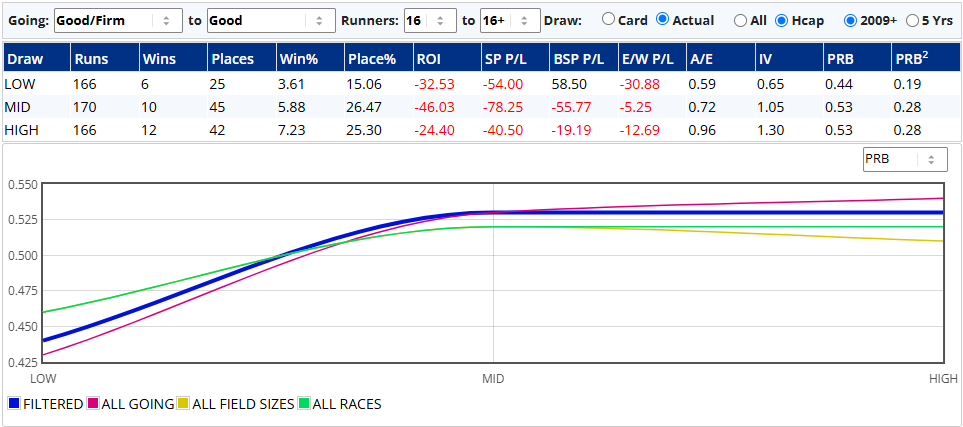
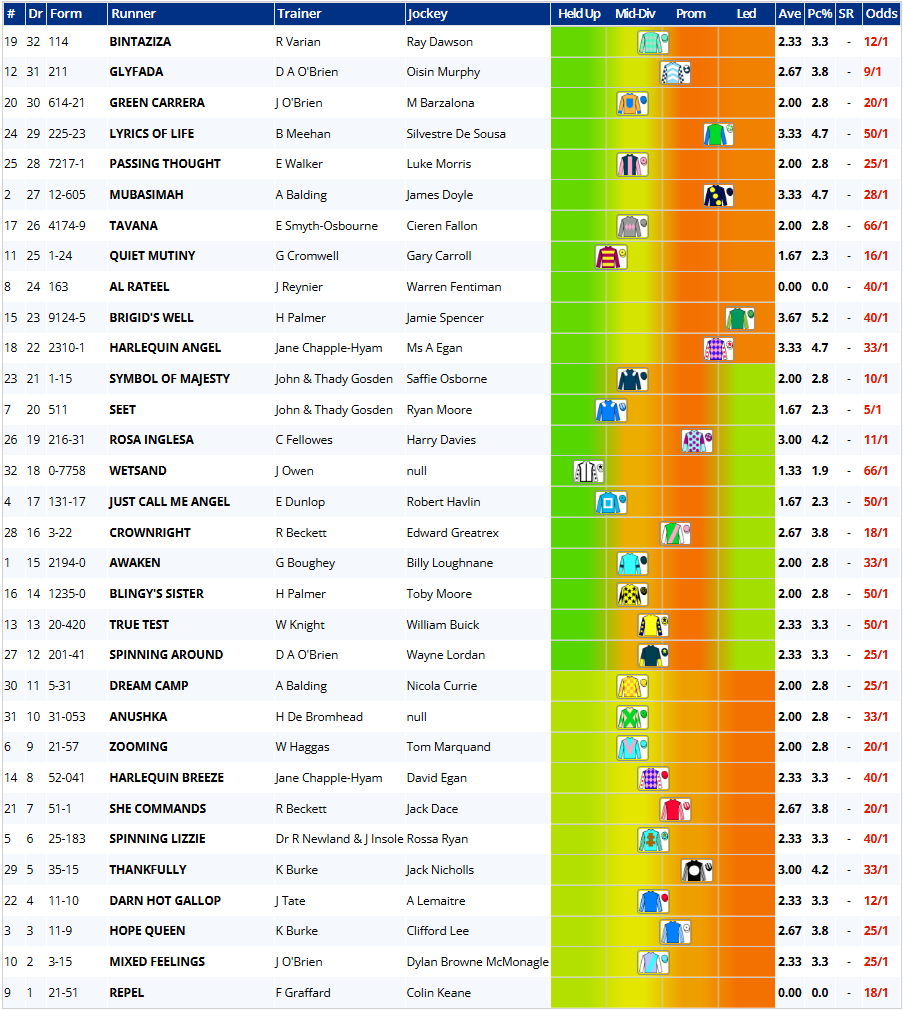
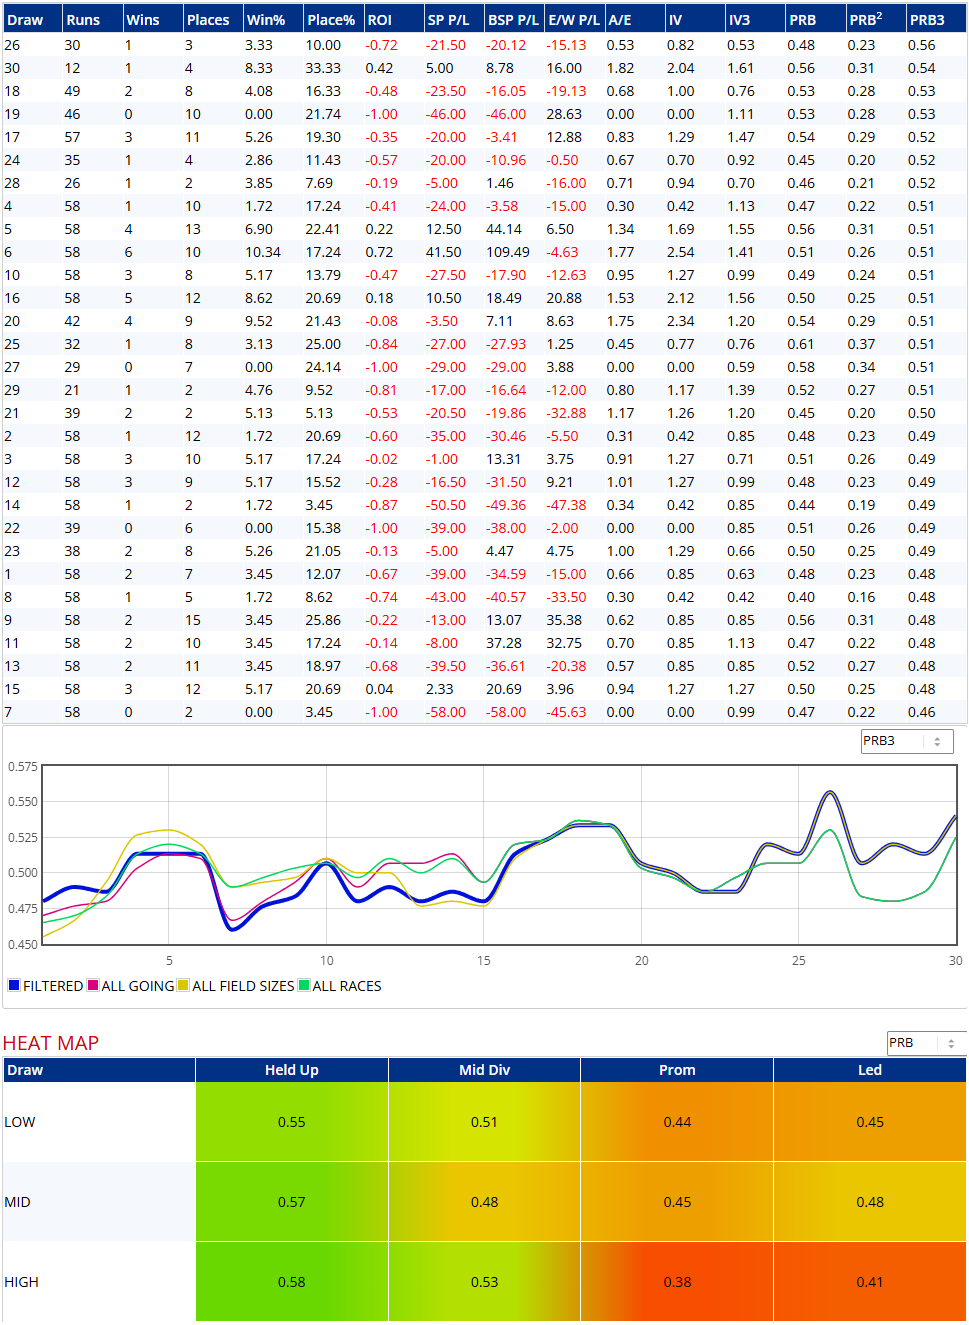
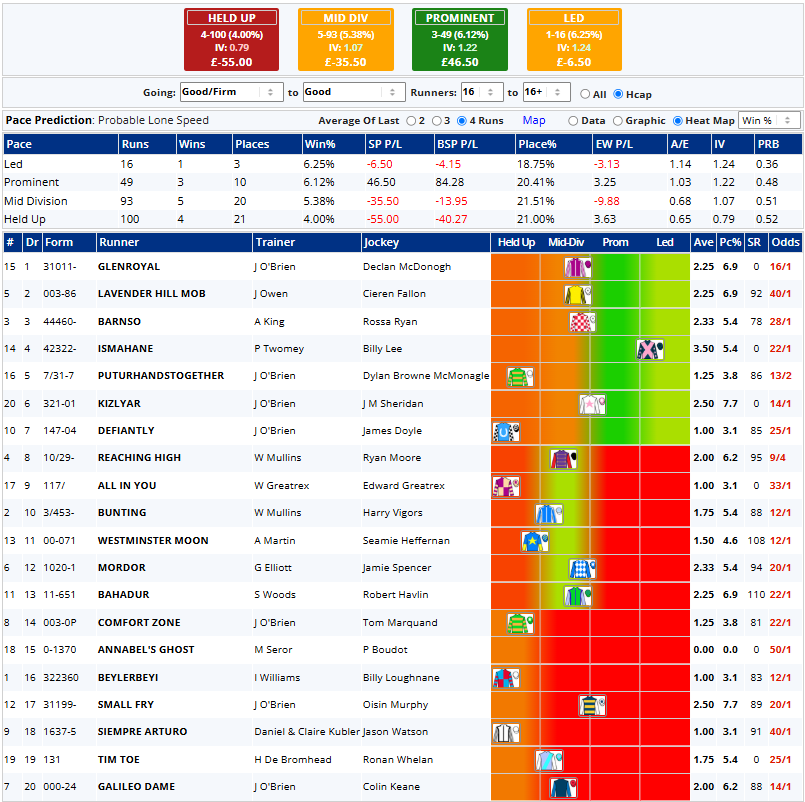
The one tool that should be able to help us is the Geegeez Gold pace tab. Logic dictates that the higher a horses’ pace score total, the more likely it is to lead and, if it leads, then over time such runners are at an advantage offering us punters good value. Let me share an example of a 5f handicap race run on 25th June of this year focusing first on the pre-race pace ratings:
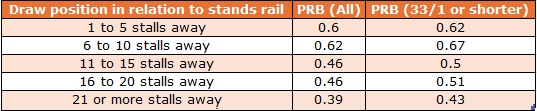
The first point to note, before we look at the pace totals for each runner, is the performance of early leaders over this course and distance (C&D).
The most important number for me is the PRB figure of 0.64 for early leaders/front runners (the ‘Led’ group). That suggests front runners have had a significant edge over this C&D in the past. Hence, this is the type of race where, if we can predict the front runner and back it, we should make good money over time. I will come back and discuss the C&D PRBs later in the piece.
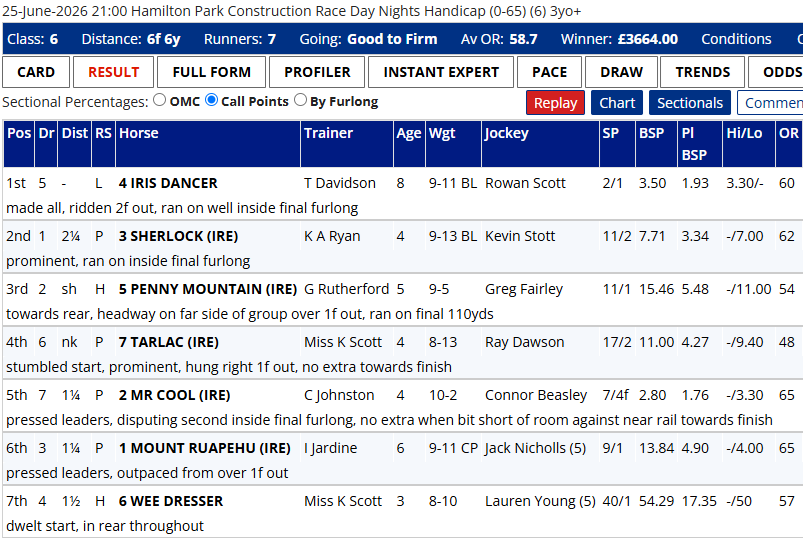
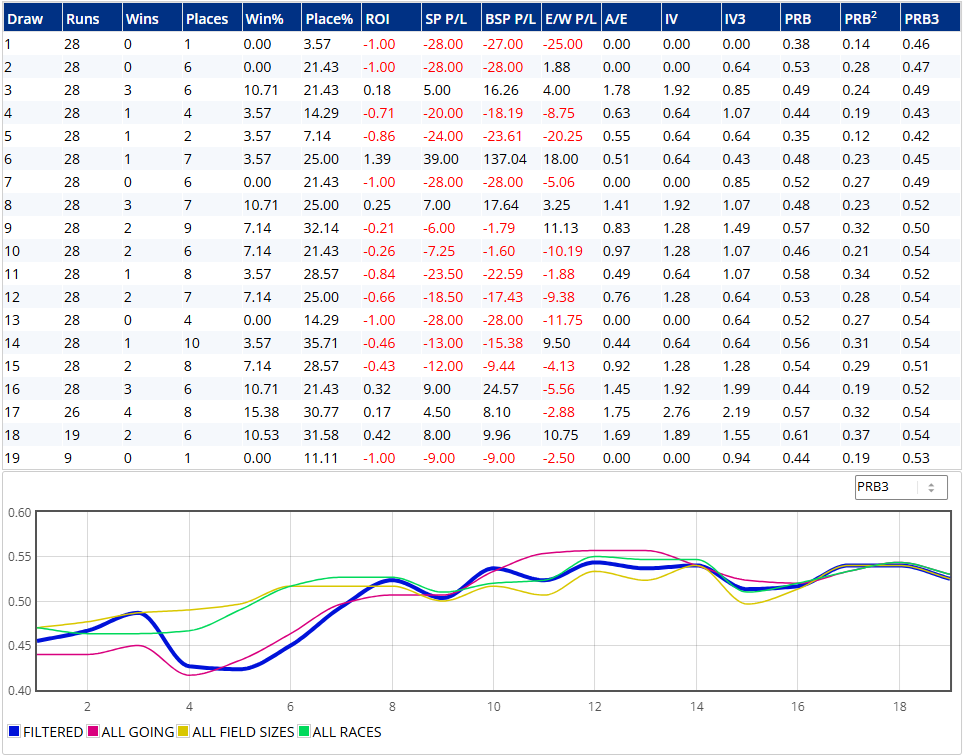
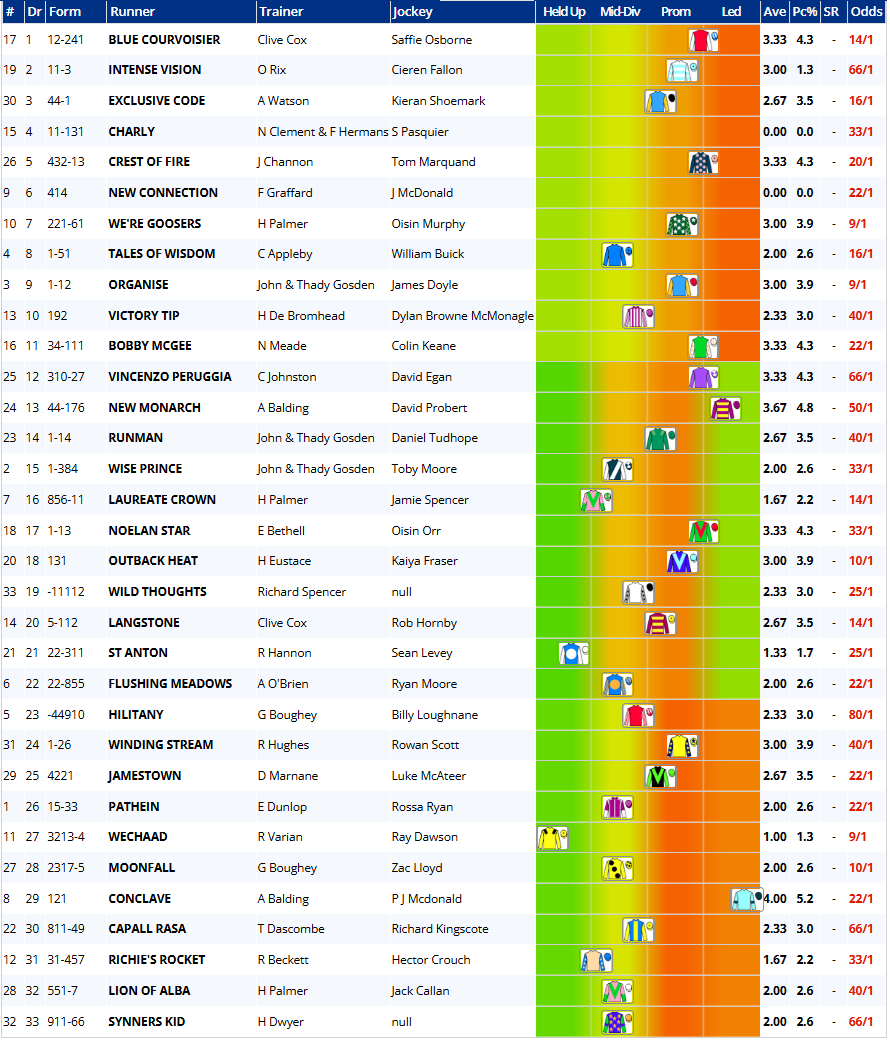
In the image above I have ordered the runners by their pace scores and we have two in double figures, namely Iris Dancer and Mr Cool. Pre-race it seemed likely that one of these two would lead. Here is how the race panned out:
Iris Dancer did indeed take an early lead and made all the running. Mr Cool was pressing the lead early but eventually finished fifth. The race followed the most likely pattern and the most likely result. Now, of course, there will be plenty of times when a race does not pan out like this, but the odds should generally be in our favour.
Just before I share my new research, I want to briefly talk SR ratings. These are derived from a neural network developed by Peter May. They are much more than a measure of speed; they include a number of form considerations making them a sort of composite of, in Racing Post terms, RPR (Racing Post Rating) and TS (Topspeed) - both of which we also publish in the daily racecards. Crucially, though, the SR figures are not published on every racecard in Christendom, and so fly under the radar considerably more.
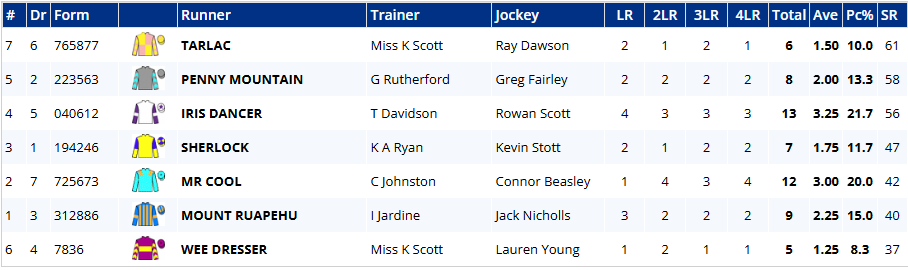
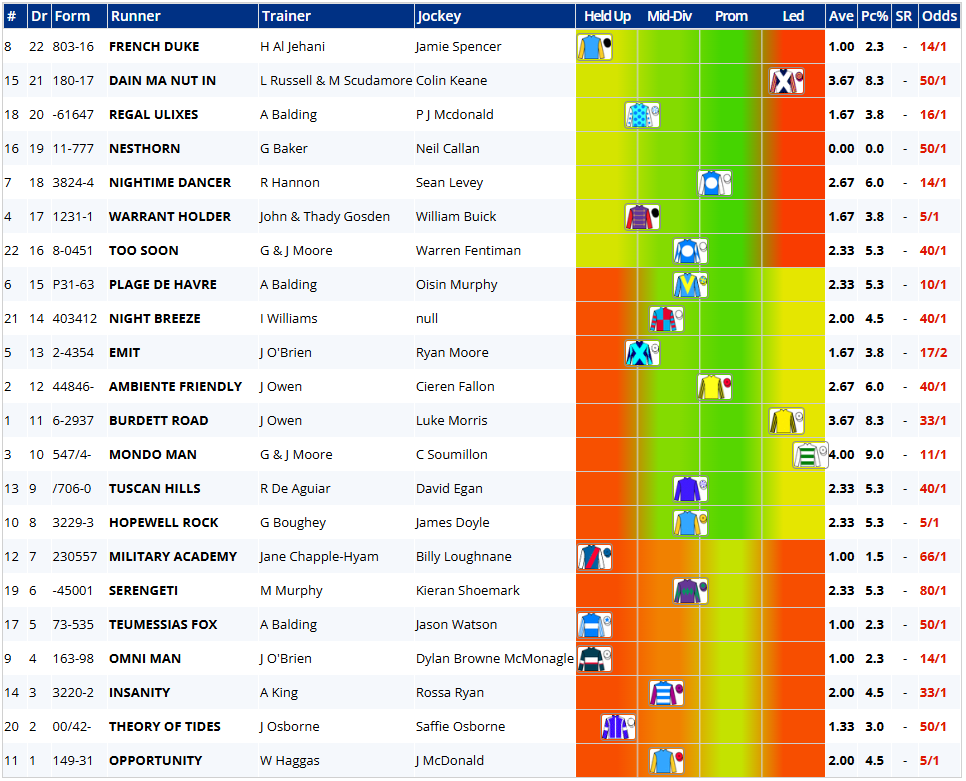
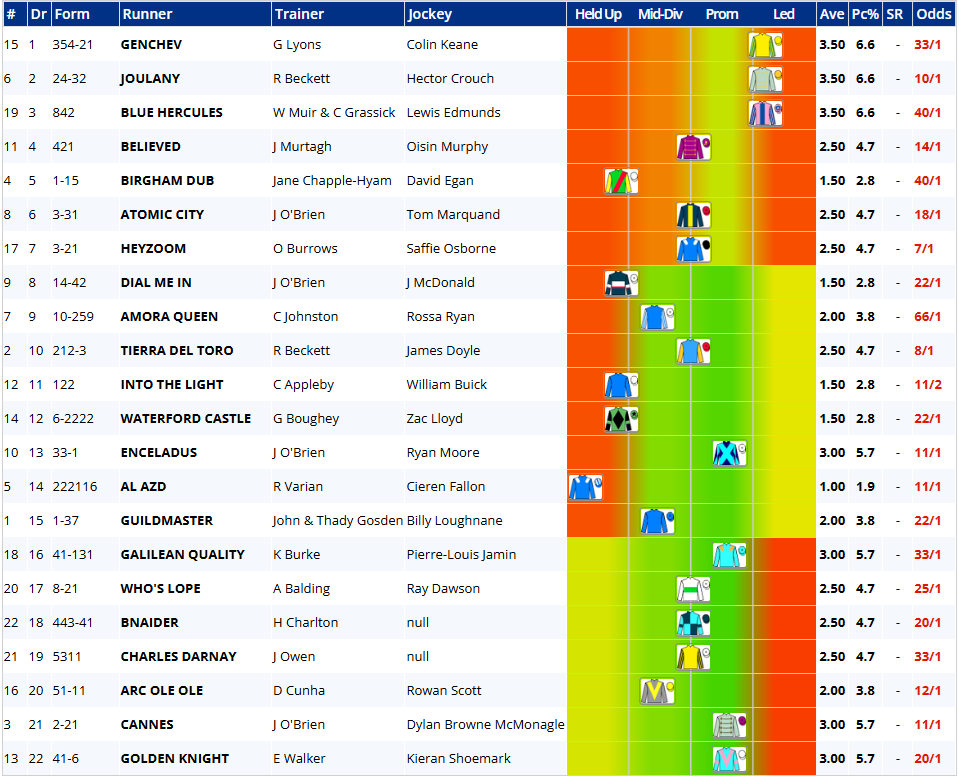
Now, going back to that previous race, let me change from ordering the horses by pace rank to SR Ratings:
Here we see Tarlac top rated on 61, Penny Mountain second on 58 and Iris Dancer third on 56. Hence, based on my previous research article looking at horses being in the top three of both the pace rankings and the SR rankings, the winner Iris Dancer, was the only horse to appear in both top threes.
So, onto today's new research. I thought it would be interesting to come up with a very simple ‘system’ similar to what I did in that original article and test it over a recent four-week period. I chose the first four weeks of May of this year, 2026, to do the testing.
Here are the ‘system’ rules:
UK Handicap races only
Race Distance 5f to 1m1f
The PRB figure for the ‘led’ group on the pace tab for the specific race conditions must be 0.60 or higher
Horse must have one of the top three pace scores for the race
Horse must have one of the top three SR ratings for the race
It should be noted that if there were two joint third-rated pace horses then both would potentially become a qualifier if either or both of their SR rating positions were also in the top three. If there were three or more joint-thirds, then I would count the two with the highest most recent race pace scores. In terms of SR rating joint-thirds, I need to include them all as I have no way of splitting them. Also, if a horse had only three previous pace race scores, I would use their pace average figure to compare with the four race averages that most horses have. In this case, the horses with the three highest averages across either three or four past races would count. I did not consider horses with one or two past scores.
As before I have stuck with handicap races as they give us the most reliable results for this type of idea, but I have expanded the distance consideration from 5f only to races of 5f up to and including 1m 1f. The other main difference is that I am only considering C&Ds where the past data indicates a significant front running bias (PRB of 0.60 or more). For the record, I have excluded any rare three-runner races as all three horses would always qualify in those races under these rules.
OK, let me share my findings. For the rest of this article, I will look at results across the first two weeks, and next week I will share weeks three and four, as well as some thoughts on the four-week trial as a whole.
Week 1
There were 29 qualifying horses in week one and the table below gives each individual result. In the table I have added eight columns – date, course and horse being the first three, then the fourth column gives the PRB figure for ‘Led’ runners under the race conditions for that C&D race (i.e. based on the going and number of runners grouping). Column five gives the finishing position of the horse, then their Betfair SP, SR rank of the horse, and its pace rank.
The results for this first week were as follows with winners highlighted in red:
For the record, I have asterisked (*) Nakatomi simply because the sample size for the pace ‘led’ PRB figure came from a very small sample. Most of the PRB ‘Led’ samples came from a very decent number of horses which adds confidence to the overall findings.
Here is the summary for week 1:
A very positive start, although with the caveat that there were only 29 qualifiers. Having said that, there were six horses that finished second and a further four that finished third. Therefore, over half of the qualifiers finished in the first three.
Week 2
After a great start could the momentum be maintained in week two? The first race in week two where we had qualifiers was the 3.40 at Chester on 8th May. Note that the ‘Led’ PRB for these races conditions (6f, Good going; runners 11 to 14) stood at 0.67 so it comfortably matched system rule three.
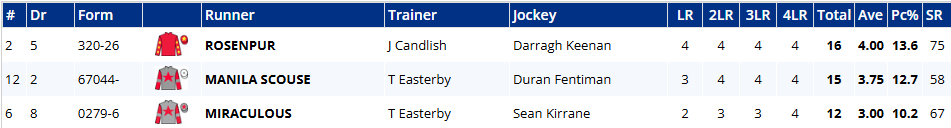
I will share both top-rated runners using the SR ratings and then show top rated pace runners to help clarify the selection process. Ordered by SR ratings first:
We had three joint third SR ratings, which actually is extremely rare, but it did mean I had five potential horses that could become a qualifier. Onto the pace rankings now:
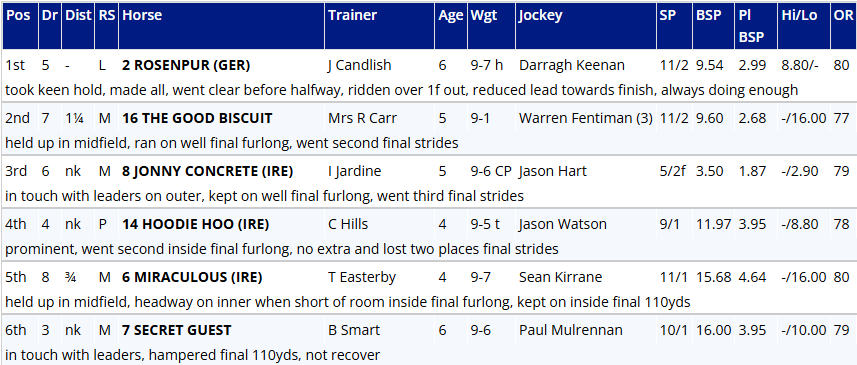
A clean top three here, with Rosenpur and Miraculous appearing in both lists, hence they were both qualifiers. The race result was thus:
I haven’t given all the finishing positions as we were only concerned with Rosenpur (who won) and Miraculous who finished fifth. An excellent winning BSP for Rosenpur of 9.54 compared with the ISP of 6.5 (11/2). Also, we should note that Rosenpur led early and made all the running.
Week two had started on the best possible note and below is a table with all the results from that week including those two.
A quieter week with 20 qualifiers and the weekly summary was as follows:
Four winners from 20 this time and, as with Rosenpur, the other three were good prices (BSP 7.5, 7.27, 12.74), hence the excellent profit figure and ROI%. There were also five more horses that finished second.
After two weeks therefore the overall figures read:
We see a very impressive set of numbers here, but I do appreciate it's from only 49 qualifiers. Having said that, the winners do not seem to have come out of the blue because along with the ten winners, there were 11 second places, too.
This incredibly simple system, for which Geegeez Gold members are able to work out qualifiers on a daily basis, has started very positively. Will weeks three and four continue this trend? All will be revealed next time... until then...
- DR
https://www.geegeez.co.uk/wp-content/uploads/2026/07/PSR_07.png6021001Dave Renhamhttps://www.geegeez.co.uk/wp-content/uploads/2022/10/geegeez_banner_new_170x78.pngDave Renham2026-07-07 16:45:062026-07-07 16:45:28More on Combining Pace and SR Ratings
It's been a loooong time coming, but the upgraded Query Tool is very, very nearly ready. In fact, it is ready and we'll be deploying it to the site this week, probably tomorrow (Wednesday). In this post - video and, underneath, text/images - I'll show you what's new and, I hope, improved.
One very important point to note, which I'll return to in what follows, is that QTv2 is being released in 'beta'. This means we've tested as far as we can, but the multitude of different browsers and devices, as well as the almost infinite combinations of variables, means there may well be some residual unsquashed bugs. So, if you spot anything, please do let us know. Thanks.
OK, video explainer below. Text and image explainer underneath that. Updated user guide here (see page 138 onwards).
So, at long last, welcome to Query Tool v2. What's new and what's the same? At this point, the interface is largely the same and all of the features you're accustomed to are as they were, including the charts and QT Angles functionality. We do plan to update the interface - the way you interact with the data - later in the year because it's a) a little dated, and b) a little limited, particularly in terms of visualisation.
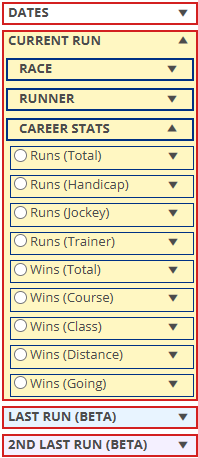
As for what's new, as you can see in the image below, there's a splash of colour and a couple (three actually, one hidden in that snap) of new blocks.
The colour has been used to differentiate between three sets of variables which enable you to quiz our database on each of the current run and now also the previous run and penultimate run of a horse. Note the (BETA) labels for the last run/2nd last run blocks.
We've used a nice pastel yellow for CURRENT RUN. This houses the parameters you know and love from the original QT. To these we've added a light blue block for parameters relating a horse's last time out run, and violet shading for its second last run.
We've also removed the BOLD CAPS from from the variables to further differentiate and to be slightly less offensive on the ol' peepers.
Clicking on CURRENT RUN reveals the third new block, CAREER STATS. This is also in beta, so do notify of any quirks.
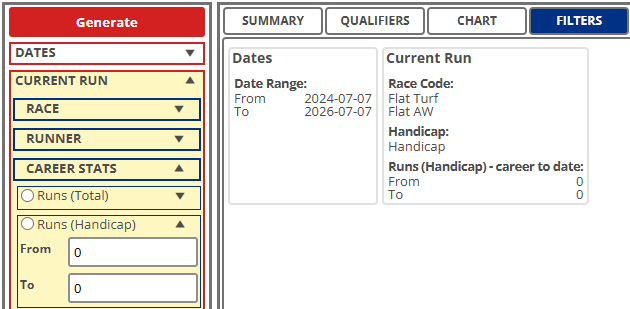
In this block, you can filter the database by runs and/or wins, and by a number of subsets thereof.
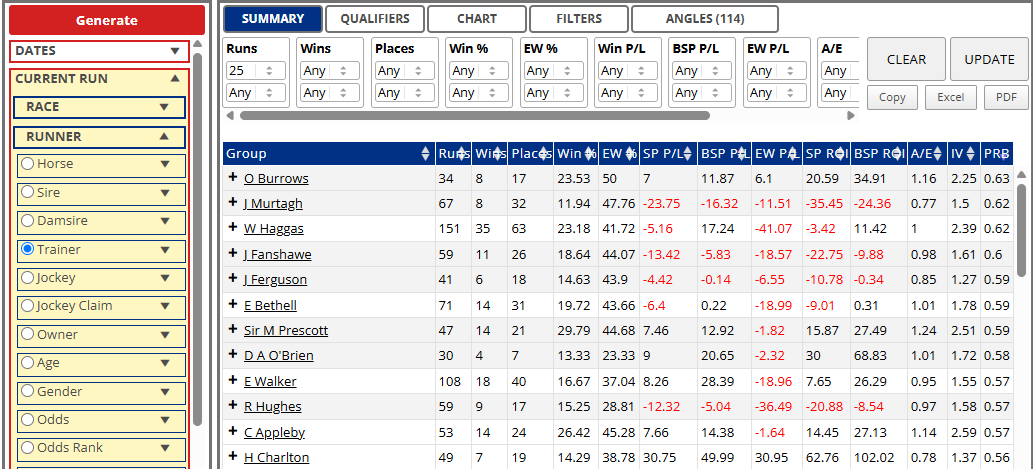
For example, if you wanted to know which trainers have performed well with horses making their first start in a flat handicap over the past two years, choose 'Runs (Handicap)' 0 to 0 and group by trainer. N.B. don't forget to select 'Handicap' under the RACE parameters, otherwise you'll get all of the classy non-handicappers that have never (and may never!) run in a handicap.
In the breakdown data here, I've sorted by PRB and displayed only those trainers with 25+ qualifying runners in the time frame. There are plenty of familiar names in there.
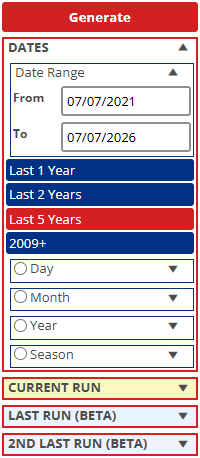
Let's move on. I'll click the RESET button and also remember to clear my '25 runs' stipulation (if you don't see the expected data in the main part of the window, always check you haven't got a filter of some sort in the top area).
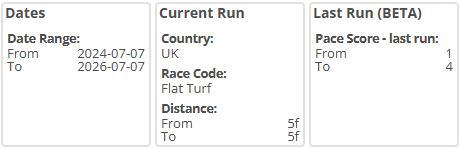
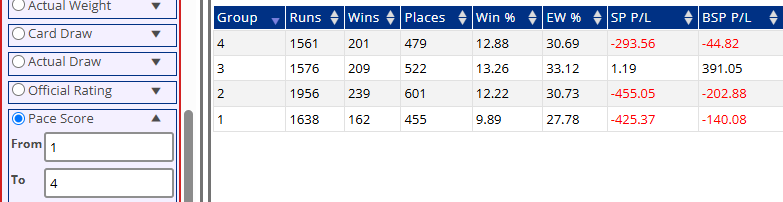
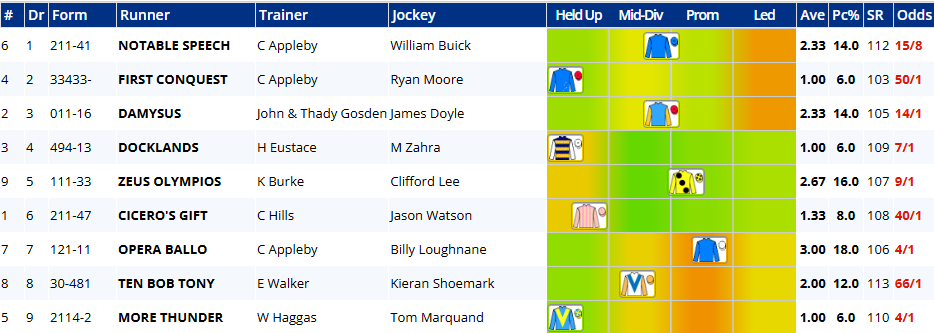
This time, I want to see if a runner's pace score in its last (couple of) race(s) is predictive in five furlong UK turf races.
It looks like it is. As per the below, those with a score of 3 (prominent) or 4 (led) last time out won at better than 13%, while those racing in the middle or back of the field early last time won at less than 11%. This was replicated in the each way percentages as well.
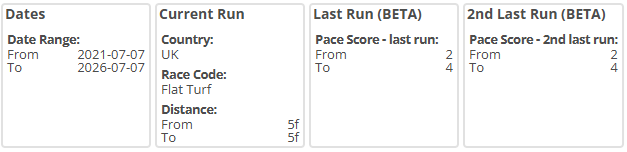
What about second last run pace score?
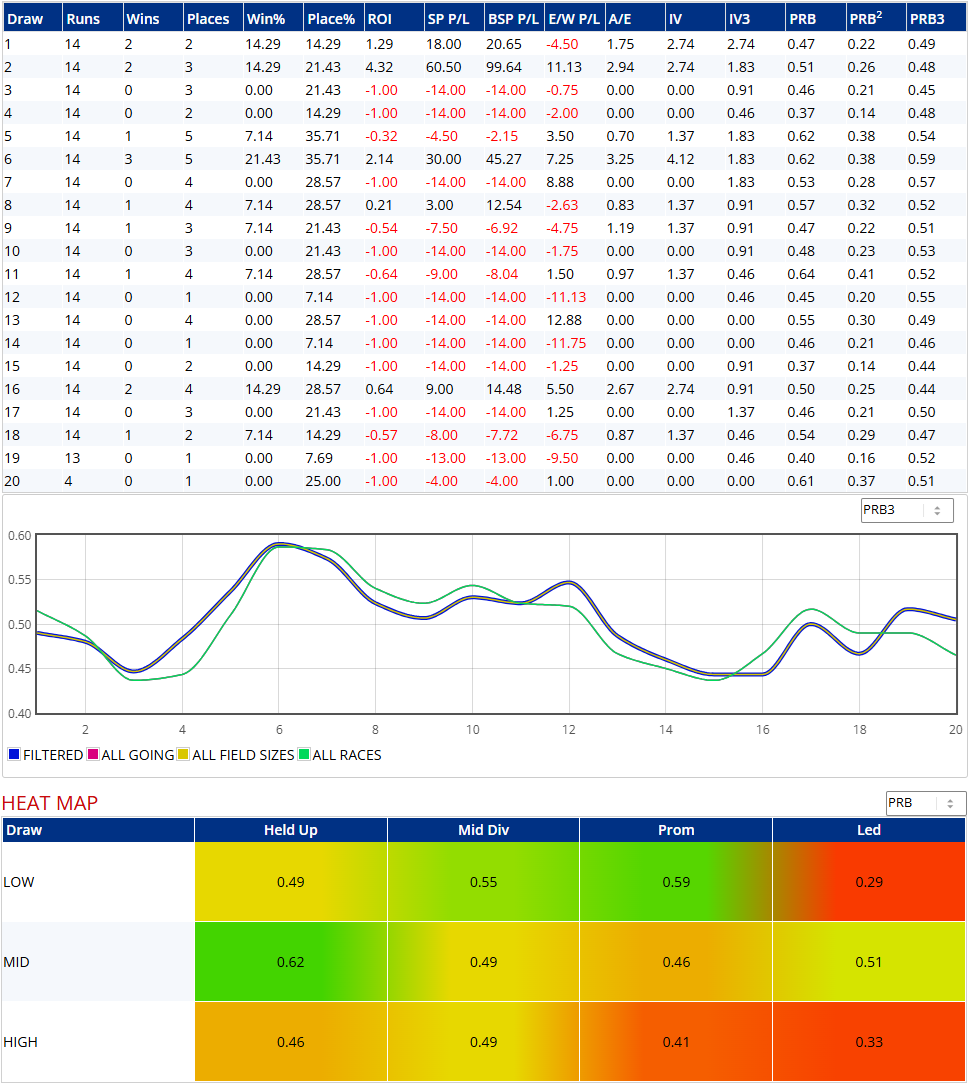
A similar pattern emerges, though the dichotomy is not quite as stark. In fact, it's fair to say that the strongest stat might be avoiding those horses that scored 1 (held up) in both runs. Let's query that to see if it's correct. Here, I've expanded the time window to five years:
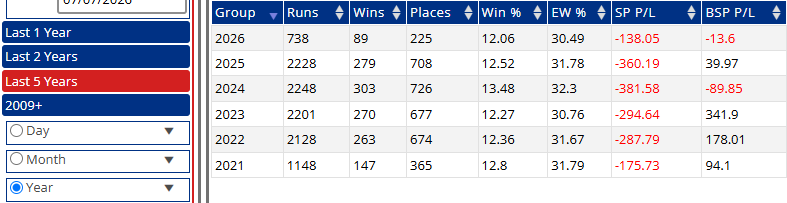
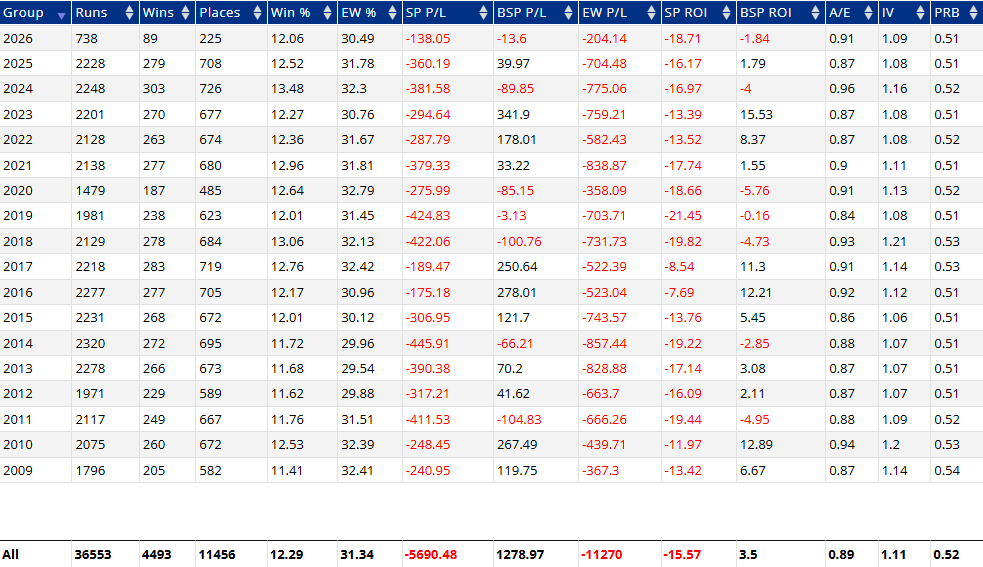
Breaking the output down by year shows that it's been a bumpy ride, no doubt predicated on some big-priced winners:
Taking it all the way back to 2009 shows the same difficult route to Betfair SP profit:
But figures have been largely consistent across all of win%, place% and PRB.
The inference is that, generally speaking, in five furlong turf races horses that were waited with in their most recent two starts are best avoided. Meanwhile, those that raced at least midfield in their most recent two starts would likely form the basis of solid wagering going forwards, regardless of whether the race is a handicap or not:
These are just a couple of examples of the sort of research that can be undertaken with the extended Query Tool.
[Note that the pace data in our development database is not updated as much as the live one that you use, and so if trying to replicate the above you should expect slightly different results, and apologies for any confusion that might cause!]
Please also note - and I make no apology for labouring this - that, in case you didn't know ;-), we're in beta mode here so stuff might by wonky. Please shout if you see anything more weird than wonderful and we'll investigate, and fix as necessary.
Good luck!
Matt
https://www.geegeez.co.uk/wp-content/uploads/2026/07/QTv2_06.png4691033Matt Bisognohttps://www.geegeez.co.uk/wp-content/uploads/2022/10/geegeez_banner_new_170x78.pngMatt Bisogno2026-07-07 10:30:432026-07-07 10:30:43Query Tool v2 is Finally Here (Very nearly!)
The £5 million mark for Aidan O’Brien in the UK this year has easily been passed, Constitution River and to a lesser extent his third-placed stablemate Hawk Mountain seeing to that in Saturday’s Coral-Eclipse Stakes, writes Tony Stafford.
The Sandown victory made it 12 Group 1 wins in a season already for the stable and most commentators seemed to be calling it a formality that he would exceed his own worldwide season’s best of 28. Just 16 to go – still sounds a lot to me.
Amid the euphoria about Constitution River, fully deserved after the style of his triumph in a race which might not have gone entirely to plan, we need to examine the dearth of home talent either capable of or certainly willing to take on the O’Brien stars this year.
In the Irish Derby, the nearest UK runner behind an O’Brien 1-2-3 was Owen Burrows with the much-fancied Raaheeb in fourth, eight lengths behind the winner Benvenuto Cellini. Richard Hannon was the only other raider from these shores and his Bunyola Bay, after briefly helping make the pace, finished a tailed-off last of eight.
On Saturday, three from home challenged four O’Brien runners, three for Aidan and one for his younger son Donnacha. The market suggested either Saddadd (Roger Varian) or Gethin (Burrows again) would get in amongst them, Gethin even having the services of his owner’s King’s Gambit (Harry Charlton) as the pacemaking counter to Coolmore’s Flushing Meadows. Both are four-year-olds, so where was the home Classic generation?
Gethin had been a close second to Ombudsman last time out while Saddadd had limbered up with a third to Almaqam and Bay City Roller in the Tattersalls Gold Cup at the Curragh in May.
Both started 4/1, although Gethin had been much shorter earlier in the week. Market confidence in the favourite grew the closer to race time it got and the performance showed that this time the Ballydoyle bush telegraph was in full working order.
Saddadd did show with some promise going to two out until Ryan Moore employed overdrive on the winner and that was that. As with Raaheeb in the Irish Derby, he was eight lengths back at the line. Gethin had already shot his bolt by that time, a brief flirtation with the lead early in the straight quickly evaporating to the extent that he was another seven lengths back in fifth, with only the gasping pacemakers in his wake.
There will be more than enough comment on the winner who, after all, had under Ryan overcome the difficulty of an apparently impossible outside draw to win the Prix du Jockey Club (French Derby) ahead of Hawk Mountain and another stablemate, Montreal.
The margin between the pair was extended from three-parts of a length to more than three and the argument that he would have won the Derby had he been routed to Epsom rather than Chantilly grows ever more convincing.
Now though it’s the Juddmonte, Irish Champion and our Champion Stakes – stallion-maker events all. As I hinted earlier in the piece, however, there’s another intriguing angle to this story. In a determined second place, just nudging ahead of Hawk Mountain close home, was A Boy Named Susie.
You may wonder why a colt would be given such a name. People of my age group know that the great film actor John Wayne was born Marion. This has a simpler explanation: the colt’s mum was called Soho Susie, a daughter of Montjeu, the great Coolmore stallion and Galileo’s counterpart for so many years at the stud. The Johnny Cash song, A Boy Named Sue must be the reason and a clever one too. Nobody will forget his name!
Soho Susie is also the half-sister to Tony O’Callaghan’s prolific winner-producing stallion Mehmas. Anne O’Callaghan, Tony’s wife, is John Magnier’s sister.
A Boy Named Susie, trained by Donnacha, is owned by his sister Ana. I always loved seeing her full given name Anastasia in racecards when she was a highly promising jockey until injury curtailed her career.
She entrusted her brother with the training of A Boy Named Susie, unlike two other nice horses that elder brother Joseph handled for her to win races before selling profitably later. This colt, a 200k son of Coolmore’s Starspangledbanner, made a winning start with a three-length stroll at Killarney last summer.
You might have expected a graduated campaign, but Donnacha launched his sister’s pride and joy immediately into Group company and, so far, they have yet to be rewarded with another win.
Never mind, the prizemoney tally is now up to £370k from seven subsequent runs. He has been second three times, third once and fourth on another three occasions, but the progression has been steady and consistent.
And the names of the winners of those seven races? His second two-year-old race produced a promising fourth in the Irish EBF Futurity (Group 2) behind Constitution River. Another Group 2 fourth place followed, albeit last of four but only five lengths adrift of Benvenuto Cellini in the Champion Juvenile Group 2 at Leopardstown.
He stepped up next time with a short-head second to Christmas Day in the Group 3 Eyrefield Stakes at Leopardstown and wound up for the year with another second, two lengths behind Pierre Bonnard in the Group 1 Criterium de Saint-Cloud.
Things didn’t get any easier in 2026, starting out with third to Christmas Day in the time-honoured Derby trial, the Group 3 Ballysax Stakes at Leopardstown. Then it was on to Chantilly for fourth in the Jockey Club and thence his finest hour on Saturday in the Eclipse.
The winners thus of his seven races since that debut have been Constitution River three times, Benvenuto Cellini, Christmas Day twice and Pierre Bonnard. “Dad, could you forget to enter anything next time?” could be the obvious refrain from Donnacha. “No chance, son. You find something I haven’t spotted!”
The horses that have won his races have gone on to success in the Derby (Christmas Day), Irish Derby (Benvenuto Cellini), French Derby and Eclipse (Constitution River), The only “flop” if you could call him that is Pierre Bonnard, just the third in the Irish Derby on the credit side since he beat Susie in France last October.
But where oh where are our Group 1 middle-distance horses? A look through Horses In Training shows legions of expensively bought and classically bred middle-distance animals in several powerful yards in Newmarket, Lambourn and elsewhere. Does the trials programme get going too late as against such races as the Ballysax early on in Ireland?
Whatever the reason, the big home teams haven’t been able to stem the tide. You thought King Canute had a tough job! After Sandown, O’Brien senior is already more than five-eighths of the way towards his record tally of £8.3 million set two years ago with the help of City Of Troy – and he still has that brilliant horse’s progeny to come on stream.
The future’s grim, the future’s Coolmore!
*
It was sad to hear of the death of Graham Bradley at 65. He hadn’t been in the best of health for some time. Despite spending many years trying to atone for earlier misdemeanours, this most stylish of jockeys was never allowed a licence to train.
Having been in the Michael Dickinson yard in its heyday and as the winner of the 1983 Cheltenham Gold Cup on Bregawn, heading home the Famous Five, he would have had plenty of expertise to make the transition to trainer.
He wouldn’t have been the first or last brilliant jump jockey to lose his way, but it seemed he was always the one marked out for “special” negative treatment by racing’s authorities.
Equally, it was also sad to hear of the passing of Peter Waney, whose West End restaurants Zuma and Meraki have long been a feature of the London scene.
Karachi-born, Waney and his family moved to Mumbai at the time of the partition of India and Pakistan in 1947. He later became a long-standing owner with the Hannon stable. The only time I went to a Waney restaurant was when Ray Tooth took his staff (and me, thanks Ray!) to Dubai a decade or so ago. Waney arranged to squeeze the dozen or so of us in an otherwise fully booked evening session at Zuma and the food was delightful. Farewell Peter, your many racing friends will miss you.
- TS
https://www.geegeez.co.uk/wp-content/uploads/2026/07/ConstitutionRiver_CoralEclipse_2026.png316830Tony Staffordhttps://www.geegeez.co.uk/wp-content/uploads/2022/10/geegeez_banner_new_170x78.pngTony Stafford2026-07-06 03:50:532026-07-05 14:59:22Monday Musings: Where are the Brits?
In this article, I will be looking at horses running on the all-weather (AW) in the months of July and August, writes Dave Renham. Data have been taken from 2017 to 2025 UK AW races and profits/losses calculated to Betfair Starting Price (BSP), less 2% commission on any winning bets.
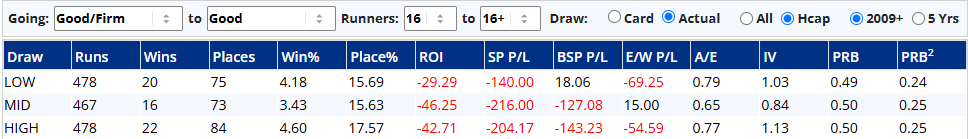
Naturally, the focus for most in July and August is the turf with some big meetings including three of the biggest of the year at Newmarket, Goodwood and York. However, away from the limelight, has all-weather racing during those months offered punters an edge in any way over the past few years? Let’s start digging to find out.
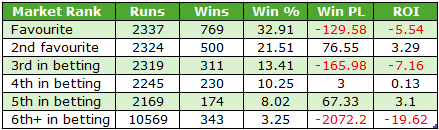
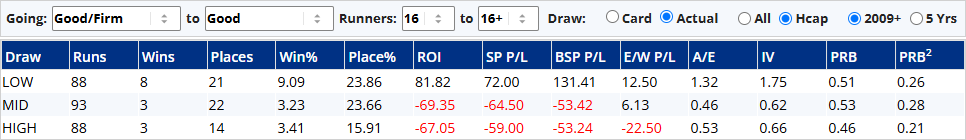
Market Rank
I want to look first at the betting market focusing on market rank or position in the betting. I am using the BSP ranked positions for this:
The value has been with those second in the market, a cohort that secured a blind return of just over 3p in the £. Indeed, when focusing on non-handicaps only, this group enjoyed 175 winners from 694 runners (SR 25.2%) for a profit of £76.38 with returns of 11p in the £.
In terms of favourites, we can see they suffered overall losses of 5.5p in the £, and it was non-handicap market leaders that struggled the most. Such runners won nearly 41% of the time (285 wins from 697), but their losses were steep: £69.45 (ROI -10%).
Digging into this group a little more, if we look at the record of 2-year-old favourites in non-handicaps we can see that they performed very poorly. They managed 122 wins from 377 runs (SR 37.8%) but at a loss of £59.45 (ROI -18.4%). Narrowing the 2yo non-handicap favourite data down further to 2yo maiden races, favourites endured a dreadful time of time of it with just 21 winners from 78 runners (SR 26.9%) for significant losses of £32.81 (ROI -42.1%).
It is also worth noting that horses sent off sixth or bigger in the betting performed quite poorly, losing close to 20 pence for every £1 staked.
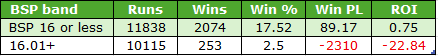
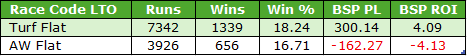
Regular readers know that I like to concentrate on 'non-rags', so let me split the results by those that were BSP 16.0 or less versus those BSP 16.01 or more:
This perhaps should not come as such a big surprise based on the findings shared earlier about horses sixth or bigger in the betting; a good chunk of such runners would have ended up in the BSP 16.01 or more group. In fact, if we focus on an even bigger priced cohort, those BSP 30.0 or longer, that would have lost over 32p in the £.
Clearly July and August has been a time where not many big priced winners have popped up on the sand. Thus, hereafter, I will be focusing on horses that were priced BSP 16.0 or less only.
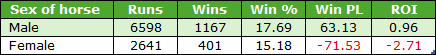
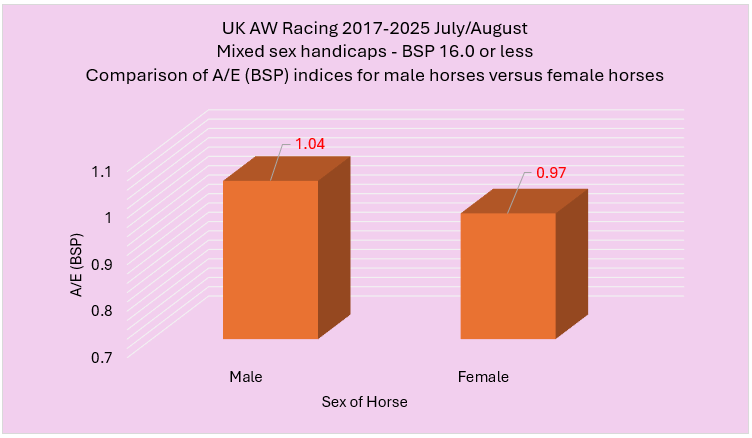
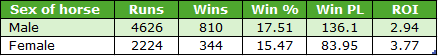
Sex of horse
Let's now look at the record of male horses versus female ones. The splits below are based on the results of races open to both sexes. It makes no sense to include male or female only races in any such comparison:
There was well over twice as many male runners, which is the norm, and they recorded a better win rate, also the norm. In terms of returns males edged that, too.
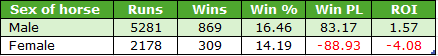
The difference between the sexes widens a little when we look specifically at mixed age handicap races. The breakdown was as follows:
Well, it certainly widens in terms of returns with males having a slightly bigger upside here. From an A/E (BSP) index perspective, a metric that measures value, males in mixed handicaps have offered better value as the graph below shows.
A figure above 1.00 indicates value and male runners have edged above that hitting 1.04.
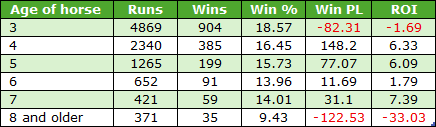
Age of horse
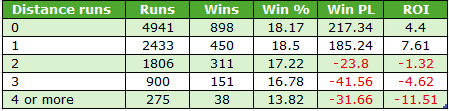
For this section I have ignored two-year-olds as there is little point comparing them to other age groups.
The biggest takeaway from here is the very poor performance of older horses: losses of just over 33p in the £ has been very poor. For the record, 3yos have a similar record in 3yo only races compared to those open to 3yos and older ones.
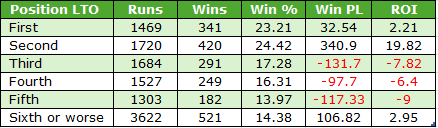
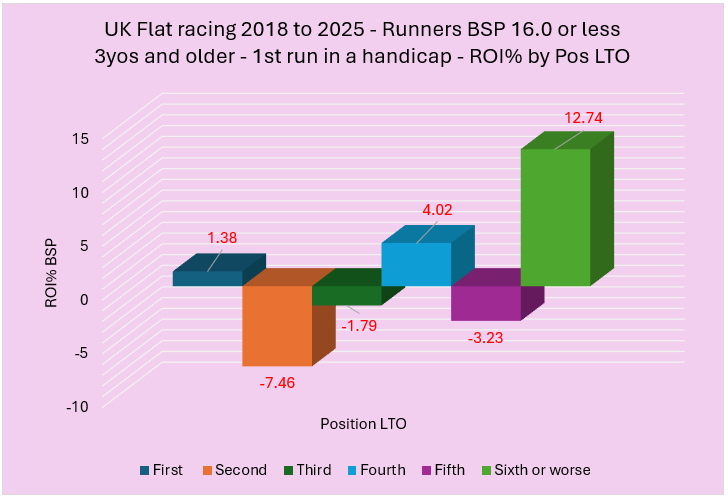
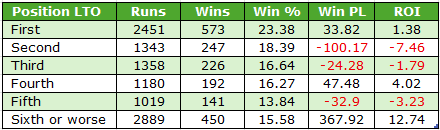
Position Last Time Out (LTO)
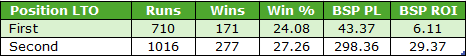
Let us see how the most recent run has affected performance based on last time out finishing position.
LTO winners nudged into a very small profit, while horses that finished second produced huge profits. Their A/E (BSP) figure stands at an impressive 1.12.
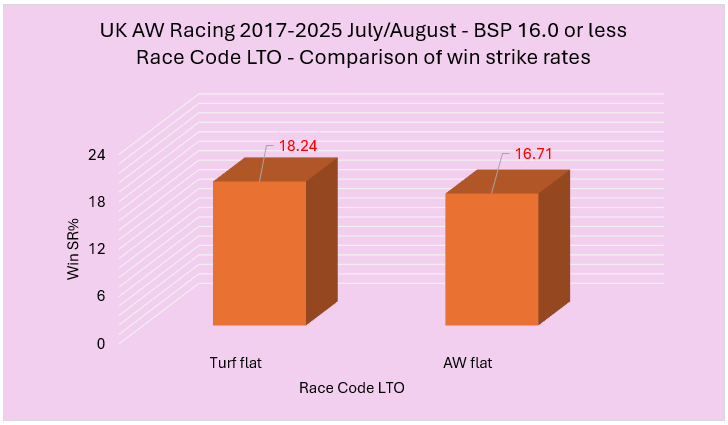
Race type LTO
I wondered if a run on the AW last time or on the turf would make a difference, and when I looked at the strike rates there was a difference of just over 1.5% as the graph below shows:
Does this strike rate difference affect the profit and loss figures? The table below reveals all:
The answer is an emphatic ‘yes’, thanks to a difference of £462.41 between the two to £1 level stakes. The difference in terms of returns was a smidge above 8p in the £. Clearly, based on these numbers, a run last time on the turf is preferable.
We saw earlier that both last time out winners and last out runners up were profitable over the period of study. When those most recent firsts or seconds were on turf, the figures improved further as the table below shows:
Not only have the strike rates improved but the returns have, too. The ROI% increase for LTO winners was around 4% while for last time runners up it increased by nearly 10%. The A/E (BSP) index for this cohort of runners up stands at a very healthy 1.22. Hence, any horse that finished first or second LTO on the turf needs close scrutiny this July and August when running next on the AW.
Trainers
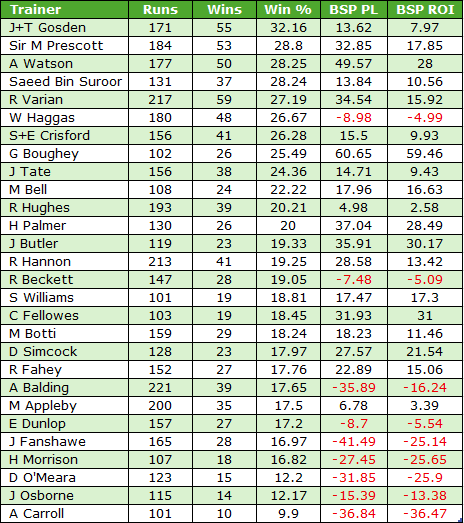
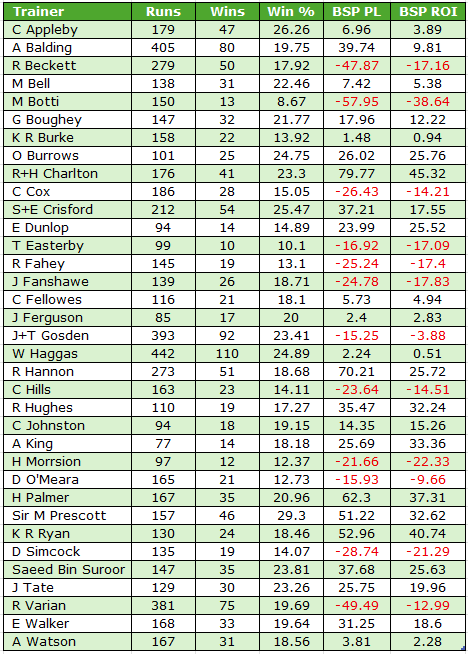
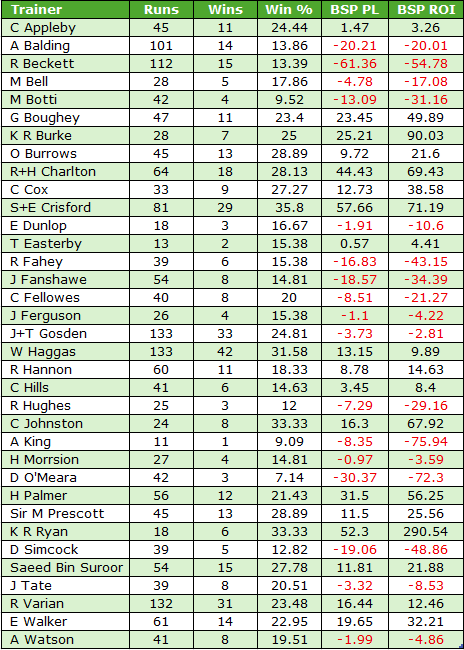
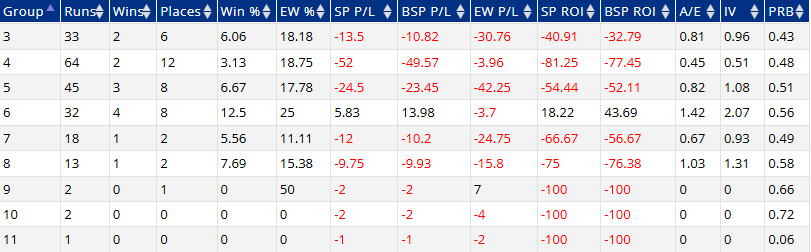
On to trainer performance now. Below is a table containing all trainers who had at least 100 runners on the AW in July and August (2017-2025) priced BSP 16.0 or less. The table is sorted by win strike rate:
There were more trainers in profit than in loss in this table (19 of the 28), with several showing good returns. Let me share a few observations:
George Boughey
Over the last two years Boughey's record reads 10 wins from 36 (SR 27.8%) for a profit of £34.90 (ROI +96.9%). He also did well when his runners started second in the betting market. This cohort won 35.7% of the time (10 from 28) for a profit of £15.64 (ROI +55.9%).
John+Thady Gosden
Look out for Gosden-trained favourites. Their 61 qualifiers fared very well, winning 55.7% of the time and returning just below 20p in the £.
Richard Hughes
Horses second in the betting have been profitable for Hughes thanks to 12 wins from 40 (SR 30%) for a surplus of £13.52 (ROI +33.8%). He also had an exceptional record with LTO winners, scoring with 50% of their follow-up AW starts (10 wins from 20) for a healthy profit of £17.96 (ROI +89.8%).
Sir Mark Prescott
Sir Mark has been consistent across all six AW tracks producing profits at five. The only losing course for him was Wolverhampton where he had minimal losses of 4p in the £. Horses that finished fourth or worse LTO had a good record on the all-weather in July and August for the stable thanks 19 wins from 65 (SR 29.2%) for a profit of £31.55 (ROI +48.5%).
Roger Varian
Varian has performed well with second favourites, claiming 17 wins from 56 runners (SR 30.4%) for a profit of £16.20 (ROI +18.2%). He had a good record specifically when sending runners to Lingfield: 10 wins from 27 (SR 37%) for a profit of £7.62 (ROI +28.2%).
Archie Watson
Take note when Watson runners appear at Lingfield. His record reads an excellent 10 wins from 30 (SR 33.3%) for a profit of £24.79 (ROI +88.6%). He also did well at Wolverhampton with 21 winners from 58 (SR 36.2%) for a profit to BSP of £26.15 (ROI +45.1%). Watson's LTO winners performed with credit winning 12 of 30 starts (SR 40%) for a profit of £5.97 (ROI +19.9%).
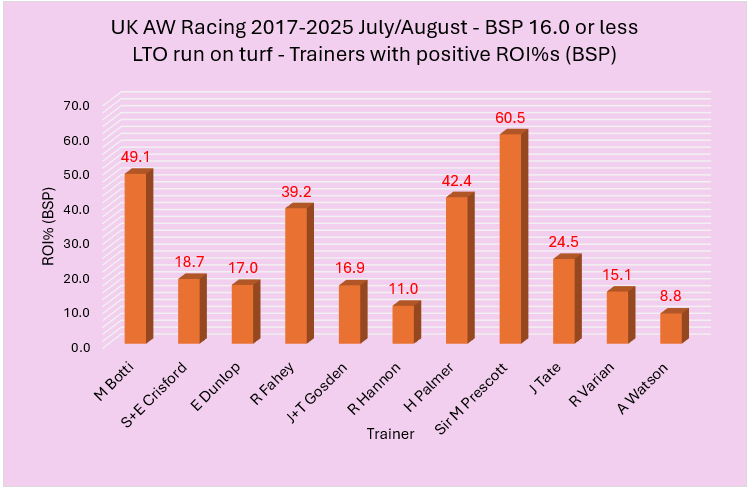
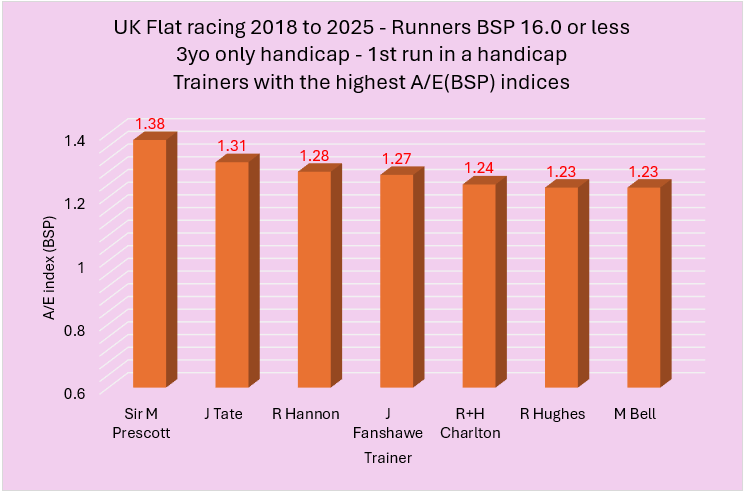
Earlier I shared the fact that a LTO run on the turf had been preferable, and below is a graph showing the trainers with the best records with horses that raced in a turf flat race LTO. To qualify, they must have had at least 75 qualifiers and recorded a profit. The graph shows their relevant returns on investment to BSP.
There were some excellent returns especially for Messrs. Botti, Fahey, Palmer and Prescott.
*
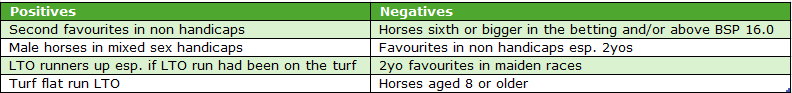
That wraps up this piece and it there have been plenty of positive angles highlighted for racing on the AW over the months of July and August, as well as some clear negatives.
Below is a quick summary of positives and negatives, mainly focusing on horses priced 16.0 or less BSP. The aide memoire excludes trainer findings as there were so many different positive angles, highlighted separately above.
- DR
https://www.geegeez.co.uk/wp-content/uploads/2025/02/Judicial_Callum_geegeez.webp7791100Dave Renhamhttps://www.geegeez.co.uk/wp-content/uploads/2022/10/geegeez_banner_new_170x78.pngDave Renham2026-06-30 15:08:272026-06-30 15:08:27A Look at Summer All-Weather Racing
One, two, three, it’s easy as ABC, or rather it’s easy as shelling peas for AOB, writes Tony Stafford.
It was thought in some circles beforehand that Irish Derby win number 18 might have been threatened by the unbeaten and highly regarded Owen Burrows-trained Shadwell colt Raaheeb.
Backed down to 11/4 second favouritism here, behind Betfred Derby phantom non-runner (that ran!) Benvenuto Cellini, he did win the race for the non-Ballydoyle team.
For the record, this one-two-three was led by Frankel’s son Benvenuto Cellini (Ryan Moore) by almost two lengths, from Christmas Day and his Epsom partner Ronan Whelan, with Pierre Bonard an honourable third just behind. Raaheeb beat the rest by five lengths, but trailed home half a dozen lengths behind Pierre Bonnard and Wayne Lordan.
So Ryan got his second Derby win of the year, following on from the Prix du Jockey Club when he and Constitution River led home Hawk Mountain and Montreal over the ten and a half furlongs at Chantilly for a rather less overwhelming Coolmore trifecta.
That makes it at least half a dozen O’Brien three-year-old colts that will continue to dominate Group 1 middle-distance races for the rest of the year.
While not everyone agreed with the declaring of Benvenuto Cellini a non-runner, one who was vocal in applauding the decision was Peter Brant, in whose green colours the son of Frankel runs, but with all the usual Coolmore team as partners.
Brant is also on the team associated with Christmas Day. Like the regulars, he now has the Irish and English Derby winners in his ownership and the 28 lengths by which Benvenuto Cellini trailed home his teammate at Epsom has been officially expunged from the records. As in, “It wasn’t me, guv!”
The main plank of Peter’s justification was that Ryan was unable to take up the prominent position that had been planned for at Epsom. He couldn’t, he said, owing to that odd “caught up in the framework” incident, but he wasn’t all that close early on yesterday either as the team’s outsider Action set a fast pace from Christmas Day.
While he did show impressive pace to catch Christmas Day once Action had faded away, neither the second nor the third did anything to diminish his reputation. Both placed colts are by Camelot and must be among the prime contenders to maintain Coolmore and O’Brien’s customary strong hand in the St Leger.
Apart from the Irish Oaks, that pretty much does it for the spring/summer 2026 Classics and if hadn’t been for Bow Echo and George Boughey, this year would have been almost a whitewash for the O’Brien team.
I’ve been waiting for a suitable time to contradict everyone else’s pronunciation of the 2,000 Guineas and St James’s Palace Stakes winner’s name.
George Hill, whose granddaughter Grace Learoyd-Hill, 20, won a big showjumping class for senior newcomers at Newport on Saturday – a star for the future he hopes, any sponsor out there? – tells me the Bow should be pronounced as Bough. It relates to the echo from the bow of a boat. You heard it here first.
If the Derby form from Epsom stood up well this weekend, the Oaks suffered a less satisfactory result when easy English winner Thundering On (Joseph O’Brien) could finish only fourth behind the five-year-old mare Estrange in the Pretty Polly Stakes.
David O’Meara has had to be patient with the Cheveley Park Stud-owned mare, who was running for only the ninth time (six wins) in her career. The long-held plan has been the Prix de l’Arc de Triomphe and that looks ever more feasible – even though Coolmore and the French will throw everything at her. She better get it done this October as top geldings like Calandagan and Goliath will be eligible to run in it twelve months hence. “Mon Dieu”, said M. Fabre.
I was interested to catch Dan Skelton yesterday talking about his season’s target which remains aiming to beat Martin Pipe’s record of 243 wins in a single jumps campaign, set in 1999/2000.
We kept watching almost in awe as his prize money tally for the term ending late April approached and then passed £5 million. His 194 winners from 1,094 runners realised £5,045,615. Putting that in perspective, O’Brien has won 40 races in Ireland this flat season, with earnings exceeding €3 million. I doubt it will be long before he passes Skelton’s 2025/26 tally in the UK this year. His 15 2026 wins have contributed to £4,679,151 win and place earnings.
And it won’t be getting easier for anyone to challenge him for the top prizes next season. A series of smart juvenile winners over the three days of the Irish Derby weekend was climaxed by the scintillating six-length romp of Sea The Stars filly Alpha in the opening seven-furlong fillies’ maiden yesterday.
A smart-looking and pedigree-powerful squad opposed this filly who was making her second start. Ryan took her to the front from the outset and she made all to beat stablemate Ibelieveicanfly by an easy six lengths.
When the two fillies made their debuts together a few weeks back, Ryan rode Ibelieveicanfly and Wayne Lordan was on Alpha, the pair going off as 2/1 joint-favourites, finishing in second and fourth respectively.
Ryan was on the right one this time and having been one and a half lengths Ibelieveicanfly’s superior then, she emphatically extended the margin. The winner’s dam, Alpha Centauri, was a top-class filly rated 123. If ever there was a long-range Oaks candidate, surely Alpha must be an early front-runner.
Having endured those unreal temperatures at the backend of last week, I must applaud the decision of the BHA to stage early-morning fixtures rather than afternoon programmes. The French have been doing it for ages – their meetings last week at Deauville (8.30 am) and Chantilly at 8.45, so an hour earlier here, were halfway done before Doncaster began at 10.15am.
My mate Richard Farnese won’t have been happy. There is a tradition with many Yarmouth racecourse regulars to stop off on the way to the track to his Café La Continental for a sumptuous breakfast. I confess to that predilection.
I cannot bear the thought of all those superb all-day breakfasts going uneaten. A race sponsor at Yarmouth for many years, I trust Richard will have been on site last week to remind everyone that he would still be open for breakfasts after the last race at 1 pm.
Horses aged three or older: analysing their first run in a flat handicap
In this article, as the title states, I will be looking horses having their first run in a handicap race on the flat, writes Dave Renham. Specifically, I am ignoring two-year-olds and focusing solely on horses aged three or older. Data have been taken from 2018 to 2025 in UK flat and AW handicaps with profit/loss calculated to Betfair Starting Price (BSP), less 2% commission on any winning bets.
All Qualifiers
Let me start by looking at the results for all qualifiers across the eight years of study.
As we can see these horses have won roughly once in every nine starts and have made an overall profit. Of course, the figures are skewed somewhat with nine winners priced over 100.0 BSP, the highest being BSP 431.91. Hence, as I tend to do with most of my articles, it makes sense to impose a price cap to try and avoid certain stats looking better than they actually are. I think including horses up to BSP 16.0 is a sensible price point to use, and I will implement that for the remainder of the article.
So, let me look therefore at the figures for all qualifiers that were priced BSP 16.0 or less.
We still see a small overall profit which is interesting. It is clearly worth digging a bit deeper given this positive starting point.
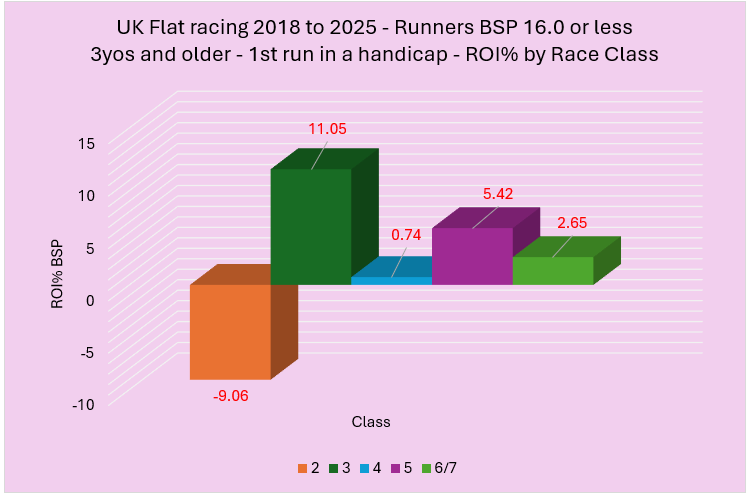
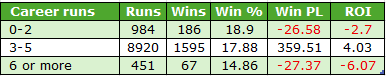
Race Class
I want to look first at the ROI percentages for all these qualifiers (BSP 16.0 or less) in their respective Race Class.
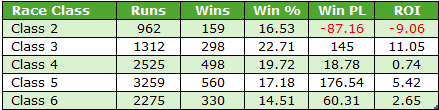
I have grouped Class 7 with the Class 6 results and for the record there were only seven qualifiers from Class 7 races. There were four Class 1 handicaps during the period of study, but they don’t exist anymore, so it seemed pointless to add them in.
The graph shows that Class 2 qualifiers struggled in comparison, and the table below gives us a deeper breakdown:
Class 2 handicaps are contested by the best handicappers so that might be a reason why horses having their first run in a handicap struggled a little at that level. All other Class brackets edged into profit, with Class 3 first-timers doing best.
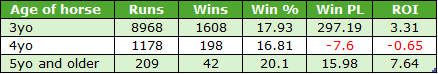
Age of horse
Now, let me split the results by age.
It should come as no surprise that the vast majority of runners have been aged three and, overall, they have had a solid record. Not many older horses (aged five or more) qualified, as would be expected, but actually as a group they have done well.
Sex of horse
Now I would like to look at the record of male horses versus female ones. The breakdown below is based on the results of mixed sex races, those races open to both sexes. It makes no sense to include male or female only races in any such comparison:
There was roughly double the number of male runners, which is the norm, and although they had a better win rate, females have been slightly better value when priced BSP 16.0 or less. However, in truth there has been little in it.
Position LTO
Let me now look at performance based on last time out position. The graph below shows the returns to BSP for each group:
As the graph illustrates, the value has been with horses that were soundly beaten last time (those finishing sixth or worse). Below is a table showing more keys stats including strike rate and the actual profit/loss figures.
My perception looking at all the evidence is that horses that finished second last time have been overbet, which makes sense to me, whereas those finishing sixth or worse have been under bet, hence they have offered a bit of value.
Previous Career runs
How about previous number of career runs? Has that made any difference? Let's take a look:
The vast majority of qualifiers had raced three to five times previously which makes sense because most horses qualify for their first handicap run after three previous career runs. This group produced the best returns as we can see. The performance of those with six or more runs was the poorest, but even losses of just over 6p in the £ is not the worst we have ever seen by some way.
Previous runs over the distance
I wondered if the number of previous runs over the race distance made any difference. Here are the splits:
Based on these stats, previous distance runs of zero or one have both given positive outcomes. Performance has started to tail off a little for runners with two previous runs over the distance, getting slightly worse for three, and then being relatively poor once we get to four or more. Albeit the four or more group is very small in comparison with the others.
Trainer Angles
Onto the area that many readers enjoy most: trainers and their performance. Below is a table containing all trainers who had at least 75 runners making their first run in a handicap when priced BSP 16.0 or less:
There are more trainers in profit than showing a loss in this table, (23 vs 12), with a few standouts. The Charlton stable, Kevin Ryan, Hugo Palmer, Alan King, Sir Mark Prescott and Richard Hughes have all managed to achieve returns in excess of 30 pence in the £. Let me share some ‘extras’ in regard to these six stables:
The Charlton stable had six winning years in a row from 2019 to 2024, but 2025 did saw just one winner from 17. Variance, or something else?
Kevin Ryan had an outstanding record with his sprinters when making their handicap debut. Of the 60 runners over five or six furlongs 18 won (SR 30%) for a healthy profit of £74.85 (ROI +124.7%). He also did well at Newcastle scoring six times from 17 runners (SR 35.3%) for a profit of £14.87 (ROI +87.5%).
Hugo Palmer has been consistent with six winning years out of eight.
Over 1m 4f Alan King’s runners have excelled, winning seven races from just 16 runners returning a huge 264p in the £.
Sir Mark Prescott has long been renowned for this handicap debutants. He is 5 from 10 at Yarmouth over the past eight seasons and 8 from 25 at Wolverhampton securing decent profits at both. Ignoring his favourites, which tend to be over bet, his record reads 26 wins from 106 (SR 34.5%) for a profit of £52.64 (ROI +48.7%). Also keep an eye out for his runners that finished well beaten last time out. Those that finished sixth or further down the field LTO have won 30 times on handicap debut from 101 starts (SR 29.7%) for a profit to BSP of £26.95 (ROI +26.7%).
Richard Hughes, like Palmer, has been very consistent with seven winning years out of eight. His female runners have secured returns of over 78p in the £.
With most of the runners being 3yos, I want to examine trainer records with 3yos running in 3yo only races compared with running in 3yo+ ones. Firstly, the overall trainer numbers from 3yo only handicaps:
Again, several trainers stand out, and below is a graph showing the trainers with the highest A/E indices based on BSP prices. This is a metric that helps to determine good value. All these figures are above 1.20 which are very strong indeed.
I will be keeping any eye out for handicap debutants in 3yo only races from these stables this year. For the record Richard Hughes turned a profit with these runners in seven of the eight years; Richard Hannon and the Charlton stable in six apiece.
Now a look at the 3yo+ handicap race data for these trainers with their 3yos have their first run in a handicap:
We drop down now to roughly half the trainers in profit, which makes sense I guess considering these 3yos will be up against older, more seasoned horses in such races. Also, the sample sizes for most of the trainers are smaller than the 3yo only ones, and in many cases much smaller. Only Saeed bin Suroor has run more 3yo debutants in races for older horses compared to races for 3yos only.
I thought it would be a good idea next to compare both the win strike rates and the A/E (BSP) indices for each trainer in 3yo races versus 3yo+ races with their 3yos. Remember the price cap is in place still at BSP 16.0. I have colour coded the A/E indices – anything 1.15 or above suggest good value and is coloured blue; anything 0.80 or lower is coloured red which suggests poor value.
There are some significant differences for certain trainers when comparing their records in the different age group races. Below is a quick ready reckoner table to show the trainers with the biggest contrasts:
*
That's all for this one. Lots to go at in terms of profitable angles for three-year-olds running first time in a handicap. Here's hoping we catch a nice one or two in the coming days, weeks and months. Until next time...
- DR
https://www.geegeez.co.uk/wp-content/uploads/2024/03/MrProfessor_LincolnHandicap2024_Doncaster.png319830Dave Renhamhttps://www.geegeez.co.uk/wp-content/uploads/2022/10/geegeez_banner_new_170x78.pngDave Renham2026-06-23 14:42:352026-07-03 08:45:033yo+ First Time in a Handicap: An Analysis
Considering how fit he looked the last time I saw him on one of his visits with the Aidan O’Brien team last year, it’s almost unfathomable that it’s 36 years (27 January 1990 to be exact) that Dean Gallagher outrode the top-class Graham McCourt to guide Willsford home first in a staying chase at Cheltenham for the Jenny Pitman stable, writes Tony Stafford.
Two runs and two races later, McCourt and Norton’s Coin gained their revenge over Jenny, this time as a 100/1 shot in the Cheltenham Gold Cup. Sirrell Griffiths saddled the winner, with Toby Tobias and Mark Pitman a close runner-up ahead of the odds-on Desert Orchid in third.
Mark Pitman stepped into the Gold Cup top spot a year later with Garrison Savannah, beating off the top French horse The Fellow in a tight finish. After his riding career, Mark Pitman had some productive years as a trainer but it’s been a while since he held a licence.
Dean had a tricky time of it with Jenny. I’ve often wondered whether the presence of her son in the yard put a subconscious antipathy towards a man whose riding talent was clear to most as being superior to that of his colleague and rival.
At this point I should declare an interest. I knew Dean’s father Tom from the days he worked as a travelling head lad for Jim Bolger. I think he may already have left for a similar role with Dermot Weld when he called and said that Dean needed a change of scene and could I get him a job in England?
At that time, I was involved with several horses in the Rod Simpson yard and, as with Simon Whitworth whose solicitor father Eric contacted me with a similar request at around the same time, I suggested Rod. They both moved there but Dean was too heavy to ride exclusively on the flat and the switch to a jumps yard was sensible. I’ve since mulled whether an offer from Martin Pipe for Dean to join as his conditional rider would have been a better move, but Rod and a couple of his major owners persuaded him to stay. Also, one of the many changes in the Rules might have proved a problem too had he joined.
At Jenny’s, Dean shared the winners and to some extent the rides with Mark, but the relationship with the trainer was apparently never easy and one morning on the gallops, Dean snapped, untacked his horse and walked back to the yard with his saddle - but without the horse. If it’s not true, Dean, I have heard the story enough times to believe it is!
From there it wasn’t a career path strewn with roses but eventually he teamed up with owner Paul Green and for him rode the ex-French Hors La Loi III to victory in the 2002 Champion Hurdle, trained by James Fanshawe.
Later, he was mainly associated with the top French yard of Frederic Cottin riding four Grade 1s and many other Graded race winners across the Channel.
Since remarrying and settling down close to Ballydoyle, he is one of many other top former race riders – Adrian Maguire another – whose skills have been appreciated by Aidan. Here he was – I wasn’t as you know – in the entourage with his regular morning ride, Scandinavia, who won that epic Gold Cup duel on Thursday against the brave Trawlerman.
Mark Pitman was also there, as his former riding colleague Luke Harvey pointed out before a race later in the week, helping the stalls team load up the massive fields that were a frequent feature of many races. One horse was particularly explosive before its race and Mark was deposited on his backside right in front of the ITV cameras. Happily, he got up grinning. There’s something about racing. If it’s in your blood, it takes a lot to get rid of it!
If there was some excitement to be had at the despatch area, never can an Ascot crowd have been as thrilled by so many tight finishes. If you take the purely arbitrary notion of half a length – a margin that rightly could convince supporters of more than one horse in any race that they would be in with a chance right up to the line – an amazing 23 of the 35 races were settled by that amount or less.
Both on the Tuesday and Thursday, all seven races were so concluded and on Saturday only the opening Norfolk Stakes, won thrillingly by three-and-a-half lengths by the Clive Cox-trained and Rossa Ryan-ridden Orthodox, escaped the narrow margin parameters.
His win was my highlight of the week in talent terms. Five furlongs anywhere requires terrific speed, but on quick ground at Ascot with three Wesley Ward “rockets” setting the pace, each on its designated portion of Berkshire, it didn’t need much imagination to believe a come-from-behind horse would prevail.
I’ll never grow tired of watching Rossa bringing the son of Havana Grey through at the furlong pole to challenge two of the Wesley runners. He sluiced past them, quickly opening up a winning distance that was only exceeded by Ombudsman as he obliterated a rallying Minnie Hauk and Daryz by four lengths in the Prince Of Wales’s Stakes.
The Norfolk is usually the best guide to the future sprinting hierarchy. Orthodox might have won by seven or eight lengths had he been able to tackle the extra furlong of a Coventry or, from this year, the Listed Windsor Castle, but Clive loves his sprinters and no doubt will have his plans.
The obvious route would be the Gimcrack and Middle Park over six. How about, though, taking on the much less defined older generations in the Nunthorpe and the Prix de l’Abbaye staying at the minimum?
Watching from home had its downside. Marmite Chapman, shoes (or were they spats?) providing an instant antipathy, is getting above even himself. The post-race demarcation was illustrated with Orthodox’s win, Rishi Persad telling Clive Cox he would require speaking to Chapman as if trainers’ opinions were above his pay grade. It fell to him only to speak to jockeys.
As well as the post-race duties, Matt now has free rein to roam the paddock and tell trainers before their races how the jockey should ride their horses. The irritating way he dogged William Haggas through the week made one wonder what reaction he would have got from William’s late father-in-law. “Something off!” would be my best bet.
I’m surprised that the highly talented Fozzy Stack, having endured a second sycophantic few seconds – it seemed longer – from Matt, to have as a parting shot when he was already walking away as, “You’re a good trainer!” must have been fuel enough for him to come back and deck the self-styled arbiter of all racing knowledge.
I didn’t hear it at the time, but after hearing advice from Chapman as how best to ride his horse, world-leading jockey James McDonald was heard – I’m told – to reply: “How many winners have you ridden, mate?”
But it’s an entertainment business, moved jollily and knowledgeably along by Ed Chamberlin, with loyal lieutenants Jason Weaver, Francesca Cumani and Adele Mulrennan, showing their respective abilities. There’s also, of course, the true expert, Ruby Walsh, what an asset! Some of it gets repetitive, not least the genuflecting to Kevin Blake. Then again, as Matt would presumably say, “How many Derby third placed finishers have you bought for 50 grand?”
Joseph O’Brien readily acknowledges Blake’s contribution to the planning that brought five Ascot wins and three second places, bettered only by two more wins for Aidan, seven representing a joint best for him over 30 years as he went past the career century during the meeting.
You only need to look on the list which reveals trainers that have had at least one third place to see some unexpected names among the non-winners. I wonder if Chapman, if he even finds time to trouble speaking to them, would he say, “Hi there, …, you’re a bad trainer!”?
- TS
https://www.geegeez.co.uk/wp-content/uploads/2026/06/Scandinavia_GoldCup_Ascot_2026.png263830Tony Staffordhttps://www.geegeez.co.uk/wp-content/uploads/2022/10/geegeez_banner_new_170x78.pngTony Stafford2026-06-22 06:11:382026-06-22 09:04:01Monday Musings: A Thrilling Ascot
On we go, to the fourth day of five at Royal Ascot but the final day of our full preview coverage. I hope we've managed to add some fun - and maybe a winner or two - to your week. There have been some fireworks already and perhaps, if it's not being greedy, we can add to the pyrotechnics one more time...
Bet £5 or more into the placepot/jackpot pools via Tix and, if you played the highest ROI ticket on the day, you'll get an extra £50 - on top of the 5% bonus paid to ALL winning bets placed through Tix.
Our friends at the tote are refunding stakes (up to a tenner) if your pick runs second in any Royal Ascot race
(*opt in required and, as ever, check the terms, etc).
The going for day four of Royal Ascot, Friday 19th June, is: Good to Firm.
GoingStick readings at 8.30am: Stands’ side: 8.9
Centre: 8.9
Far side: 8.3
Round: 7.6
Stalls: Straight Course: centre
Round Course: inside
Weather: Dry overnight to Friday morning. It is forecast to be generally dry through the remainder of the week. Max temps expected to be between 26 and 28c through to Saturday.
Watering: Watered 5mm on whole track overnight.
2.30 THE ALBANY STAKES (CLASS 1) (Group 3)
Presented by Gavin Priestley
6 of the last 7 winners had raced in the previous 30-34 day period and we have four fillies this year that fit the bill.
Two of the four finished 1st and 2nd in a Newmarket novice in the middle of May and it's the runner up that appeals the most due to her stable's previous notable record in the race.
There were four maiden winners of this race between 2005 and 2011 with the last two being trained by the Channon yard who also won three of the first ten renewals of the Albany (the third of their three winners had been beaten under a length at the same Newmarket May meeting as the selection).
It was Andrew Balding's Jolivette that won that Newmarket race but fellow newcomer Topaz ran on really well to move into contention from the rear of the field as they entered the final furlong. She reeled in a number of challengers and kept on in eyecatching fashion without quite getting to Jolivette, who had got the first run on the field, and she had to settle for finishing a neck down at the line. Topaz entered a lot of notebooks for that run and she'll be winning races for a stable with previous pedigree with this type of filly.
She certainly doesn't deserve to be twice the price of the Newmarket winner and seems to offer a fair bit of value for a yard looking to reclaim former glories.
Suggestion: Try Topaz EW 25/1 (4 places)
Tix Pointers: All of the last 13 winners also won last time out; but plenty of big priced horses have made the frame. I'll be spreading out with last day winners.
The newest Group 1 at the Royal meeting, the Commonwealth Cup has bridged a glaring gap for top class three-year-olds that either failed to stay the Guineas trip or were never intended to go that far.
Although fields are usually large, winners have tended to be lurking in the shallows: ten of the 11 winners to date were sent off 12/1 or shorter and in the top five (including joints) in the betting. Of course, lobbing a curveball, was last year's scorer, Time For Sandals at 25/1. She was a third filly to win the race from 45 starters; the fairer sex has a similar win rate but a better place rate and a much better PRB.
With 22 scheduled to go to post, it might be worth noting that the two longest priced winners were when the field size was 21+. Only the electric Campanelle was able to go gate to wire, eight of the 11 winners settling in the second half of the field through the early stages.
The best trials have been the Sandy Lane, the Carnarvon and the 2000 Guineas.
Venetian Sun won the Sandy Lane at Haydock last time having looked a non-stayer in the 1000 Guineas previously. As a juvenile she lowered Gstaad's colours in the G1 Prix Morny and is unbeaten at 6f or shorter. She'll be at peak fitness and was ultra-impressive last time out. The problem is that she's very short - 6/4 in a field of 22 for a Group 1.
Aidan O'Brien is naturally represented here, by the runner-up from the Carnarvon Stakes, Albert Einstein. He's not won above Group 3 level and there's no clear reason why he should reverse form on this more testing track with the re-opposing winner that day, Song Of The Clyde. Moreover, Aidan's record in the Commonwealth Cup is uncharacteristically average: just one win (Caravaggio) from 18 starters. He's had favourites sent off 5/6, 10/11, evens, 11/4 and 10/3 with only the aforementioned horse-named-after-a-painter getting it done, at 5/6. You don't need to be Einstein to figure that the Ballydoyle runner is a bit on the skinny side at 6/1.
Carnarvon winners are actually two from two in this, both Eqtidaar and Shaquille doubling up; that means Song Of The Clyde deserves at least a second squint. He was a rock solid juvenile, winning almost half a million quid courtesy of valuable sales races in which he won and ran second in fields of 21. He does tend to race prominently or on the lead and he'll need the far side rail to ride quicker than it has done in the early part of the week from his berth in 2, but he fits on form.
On the high side, Wesley Ward runs Outfielder, fourth (beaten 2.75L) in Venetian Sun's Morny and a winner of both starts Stateside this season. Fast turf is no issue to this dirt bred US speedster - he has two wins on firm over there - but a straight six with an uphill finish might be tough to sustain for a horse that wears his heart on his sleeve out front. Still, he'll likely offer a bold sight for backers and was still hanging tough with a furlong to go in the one mile Breeders' Cup Juvenile Turf last autumn (he really should have run in the Juvenile Turf Sprint, as I wrote at the time!).
Also high is the second Aidan arrow, Charles Darwin: Ballydoyle have really sent their top scientists to this one. Darwin was drawn similarly high when winning the five furlong Norfolk at this meeting last year and added a verdict over the extra furlong on debut in 2026. He clunked in a G3 last time, Ryan reporting he thought the horse had lost its action, and Wayne Lordan takes over now. Lordan has won five Group 1's since the beginning of last season, including both the Newmarket and Irish 1000 Guineas this spring. This son of No Nay Never was unbeaten in four prior to that last day glitch and gets first time blinkers here; he's a certain forward goer which, as mentioned, may not be a positive.
There is actually a ton of pace drawn high. As well as Outfielder and Charles Darwin, Rock On Thunder (drawn 22) and Fitzella (16) are also habitual trailblazers, as to a slightly lesser degree Brussels (18), the third APO'B runner. That might mean they go too hard stands side; but, if they don't, the likeliest to pick up the pieces are Venetian Sun (13) and Wise Approach (15).
The last named is a bit of a forgotten man in this. He was less than a length behind Venetian Sun in the Morny before winning the Group 1 Middle Park over 6f. True, he's underwhelmed twice in the spring, when beaten about three lengths in each of the Pavilion Stakes (a trial for this) and the Carnarvon; but what if those were sighters for his primary target, the Commonwealth Cup? An alternative theory is that he hasn't trained on - and that holds some water at this stage - but his price is playable and he figures to get a pace setup most likely.
Coppull won the Pavilion last time, and as a two-year-old was a close third to Wise Approach in the Middle Park and a slightly more distant third behind Gstaad in the Coventry. He has two solid bits of track and trip form, then, and is genuine Group 1 class. Stall 14 sandwiches him between Venetian Sun and Wise Approach.
If high numbers have had the best of it so far this week (Tue/Wed as I write this Thursday morning), the stall positions of CC winners gives pause for thought. To wit, last year stall 1 of 21, then 1 of 14, 3 of 13, 1 of 20, 11 of 15, 10 of 16, 4 of 9, and 3 of 22. Hmm. But let's take a breath and consider the evidence more broadly.
The chart above is PRB3 (the average percentage of rivals beaten of a stall and its immediate neighbours) by actual draw position (accounting for non-runners). This is a really good way of smoothing the curve and getting under the skin of seemingly counter-intuitive draw bias numbers. What it shows is that low draws have performed pretty well, especially very low; but so, too, have very high numbers: it appears that being close to either rail is an advantage. That makes a lot more sense even if it doesn't especially help us find the winner, not obviously at any rate.
What we can say is that those drawn in the middle have tended to struggle, which brings in Wise Approach and Venetian Sun. Good grief, help!
There's one more I want to highlight. Drawn 3 is Division, a Wathnan Racing-owned son of Kingman who has probably been screaming for a setup like this. He won a 13-runner Listed race at York over six last October and then, in two spins this term, ran an eyecatching closing third in the Pavilion (course and distance) and then got closest to Venetian Sun in the Sandy Lane at Haydock. He is a closer and, while most of the pace is high, the low numbers have Song Of The Clyde (2), Zanthos (1) and Havana Anna (7). They look sure to carry Division into the mix on his side, from where it's a case of whether they're in front or behind the other lot - assuming there's a, erm, division in the field.
Suggestion: It's a really tricky race if you, like me, want to oppose the 'obvious' filly in the field, Venetian Sun. She might very well win but I can't be taking 6/4. Instead I'm going make two small each way plays, on Wise Approach and Division. If low is again the place to be - or at least not the place not to be (eh?) - 12/1 Divisionshould be bang there. Wise Approach, also 12/1, does require a touch more imagination, but if you like VS from 13 you can't mind WA from 15; he obviously needs to step up on his 2026 level thus far.
Tix Pointers: It's not been a crazy race from a placepot perspective. That said, last year was 25/1, 28/1, 20/1, with the first two home drawn 1 and 20 in a field of 21. I'm definitely going deeper than the favourite on my A tickets.
3.40 THE DUKE OF EDINBURGH STAKES (CLASS 2) (Handicap) (GBBPLUS RACE)
Presented by Sam Darby
This will be my strongest fancy of the week in what is traditionally my favourite race of the meeting - hopefully we’re rewarded. I tend to only bet in the handicaps, and the straight course races are obviously highly unpredictable, not just because of the number of runners but also because the draw bias can be difficult to get right. There is a clear draw bias over 12f though, and that doesn’t change from race to race or meeting to meeting fortunately.
Even a quick glance at the above shows a strong draw bias towards the higher numbers and, particularly, away from the low numbers. In terms of PRB3, even the worst of the double figure stalls is pretty much better than any single figure stall and the best single figure stalls come out as 8 and 9. It’s not impossible to defy a lower draw, of course - the last three winners of this race have come from single figures (7, 4 and 9). However, the previous seven winners came from 19, 19, 14,12, 12, 19 and 18. Before I delve into the pace map and form, the other thing worth flagging is the role the draw plays in any pace bias. To defy a lower draw, you generally need to be prominent. That makes perfect sense given the patiently ridden horses from low stalls will often meet significant trouble in running in such large fields. The sweet spot appears to be a middle to high draw, with a prominent or mid division racing style. The pace map below is sorted high draws at the top to low draws at the bottom.
There look to be three potential front runners in this, all drawn middle to high. I’m not convinced they’ll go massively hard, but it does look likely to be run at an even gallop at least, and should be a pretty fair race on that score. I’ll cut straight to the chase. The horse I really like for this is HOPEWELL ROCK. For those of you who have read other previews and articles I’ve written, you’ll probably know that hot form plays a huge part in my selection process. I already liked Hopewell Rock for this at the five day stage, but he was given an almighty form boost in the final race on day one of this meeting. On seasonal debut at Newmarket, in a steadily run contest, Hopewell Rock did well to finish 3rd (beaten just 1.75 lengths) after being held up out the back. The first two home were Daiquiri Bay and Gamrai, who held the first two positions throughout. That pair then finished 1st and 2nd again in the Copper Horse Stakes on Tuesday. Opportunity was the ante post favourite for this but I already thought he might be vulnerable having gone up 8lbs for winning what looked a fairly weak race last time, albeit winning it very well. He’s now been handed stall 1, which has a dreadful record in these races, and I’d be very confident in opposing this horse. Warrant Holder fared much better with the draw (17) and he’s sure to be popular given his profile. It’s worth noting though that he was 5.5 lengths behind Hopewell Rock at Leicester in October and is now 11lbs worse off with that rival. That’s not to say he can’t reverse the form eight months later - a lot of water has passed under the bridge since - but Warrant Holder’s subsequent exploits are another form boost for the selection. That horse is probably the main danger to Hopewell Rock, whilst at bigger prices, I could see Plage De Havre running into the places. He looks held by the handicapper, but his Old Newton Cup demolition job last year worked out extremely well, and being 10lbs higher for winning that race by four lengths makes him vulnerable to less exposed rivals without ruling him out. It will be interesting to see what race position Hopewell Rock can get early. I’d have definitely preferred a higher draw to guarantee a wider trip. From stall 8, I still worry that James McDonald won’t have done his homework and he’ll switch him inside and have him out the back. He will have a massive chance of riding the winner if he can keep wider and slot in around mid division, before challenging down the outside in the straight. If you can get 5/1+, I think he’s still okay as an each way bet.
Suggestion: Back Hopewell Rock e/w at 5/1+
Tix Pointers: High draws are fine here, and horses patiently ridden and lucky in the run are those on which to focus. Obviously we won't know which are which on either count until after the race - annoying!
If the St James's Palace Stakes on Tuesday is a confluence of the European 2000 Guineas form, then the Coronation Stakes is the 1000 Guineas' equivalent. Sadly, with no French entry this year it looks a straight match between the winners at Newmarket and the Curragh, both trained by that man Aidan.
At Newmarket, Precise was favoured and ridden by Ryan Moore but True Love won, ridden by Wayne Lordan. Precise, racing on the other side of the track, was beaten five lengths by a winner that was a neck shy of two lengths better than anything else in the race.
If we thought we had our miling queen crowned, the Curragh was a reset of pre-Newmarket thinking. This time, True Love was favoured and ridden by Moore, but Precise re-asserted her primacy in the hands of Wayne Lordan. Precise 1 True Love 1, but Wayne 2 Ryan 0. How frustrating it must be for a jockey in such a position.
Precise is likely to be waited with, as is her wont, and in a smallish field that ought not to be an issue; she looks good to go 2-1 ahead on her fellow Classic-winning stablemate, and 4/6 might not be an uncharitable offer from the layers either, if odds on is your thing.
If there's one thing that tempers enthusiasm, it's O'Brien's relatively poor record in the Coronation Stakes. Since 2009, he's saddled 24 fillies and won just twice, with Lillie Langtry in 2010 and Winter in 2017. Hermosa was beaten at evens, Found at 13/8, Homecoming Queen at 9/4, Opera Singer at 10/3 and Meditate and Together, both 7/2. Food for thought, at least.
I got the impression that Newmarket may have taken plenty out of True Love, who was clearly riper that day, when she ran fairly flat at the Curragh - albeit still grabbing the silver medal. As such, I'd be more wary of her this time. Depending on whether I'm right or wrong on that, there are one or two each way places to play for so let's go deeper into the field.
Touleen raced on the same (wrong) side as Precise in the 1000 Guineas, and finished half a length in front of that one though no match for Evolutionist (a noted absentee here) who 'won' that far side race. She'd previously run a lovely race in defeat in the Fred Darling, closing for second over the inadequate seven furlongs at Newbury. Owen Burrows is a trainer I respect more than most and he's eminently capable with a decent Shadwell horse (think Hukum, Alflaila, Minzaal, Anmaat). There's a feeling this filly has a bit more to come and, though there needs to be on the balance of respective form, she's a definite place player at least.
We haven't seen Balantina since last season, which didn't stop Inspiral in 2022; but that filly was unbeaten whereas this one brings solid but not outstanding claims to the party. Her trainer, Donnacha O'Brien, won this two years ago with Porta Fortuna but she arrived with a neck second in the 1000 Guineas under her belt. There are enough reasons to discount her this time though I'll be very interested to see how she runs with a view to the second half of the campaign.
Fourth at the Curragh was Black Caviar Gold, and she gets a first time visor here. Trainer Paddy Twomey has reached for the visor five times in the past two years, saddling a winner and two seconds from that quintet. They were all very well fancied, however, so that doesn't really tell us anything! This filly doesn't look good enough, in truth.
Similar comments apply to each of Timeforshowcasing, Moon Target and Rose Ghaiyyath, but Sukanya may not be completely without hope. She won the Fred Darling, beating Touleen, before running no sort of a race in the Irish 1000. She got a bump at the start there and was lit up and keen as a result; as such, she was entitled to guzzle her gas before the race was over. It wouldn't be the biggest shock if she made the frame.
Suggestion: This is not a deep renewal and 4/6 PRECISE probably wins. The obvious alternative, True Love from the same stable, looks opposable I think, making 9/1 Touleenreasonable each way value. Hail Mary players might consider a ha'penny each way on 40/1 Sukanya in case her Curragh spin was a chuck out.
Tix Pointers: The favourite or second favourite has placed in 12 of the last 13 years. Favourite banker?
A 3yo fillies handicap over the straight mile to finish my week’s work. I’ll start by taking a look at the 15-year trends, which see four strong pointers.
Market Rank
Six wins for the SP favourites (seven for the BSP fav) so, despite having big fields generally (11 of the races with 20+ runners), the market has proved a good guide as far as market leaders are concerned.
Price LTO
Related, 14 of the last 15 winners returned an SP of 17/2 or less LTO. A further 31 were placed. Horses priced 9/1 or bigger LTO have won just once from 123 runners (10 placed).
Weight Rank
Seven of the last 15 winners have come from the top four in the weights (inc. joint 4th). This equates to 47% of the winners from just under 20% of the total runners. Also, a further 14 were placed.
Position LTO
Eight of the last 15 winners won LTO. This equates to 53% of the winners from just 28% of the total runners.
We have a few angles for those who follow long term race trends, then.
Looking at the draw now, and last year the first three horses were drawn 2, 6 and 1, whereas in 2023 the first seven home were drawn middle to high. This race has not been that easy to predict draw wise, unlike some of the other straight course races that have tended to show a more reliable and consistent bias. However, I personally will take high to middle over low unless the ground comes up soft, which given the forecast seems very unlikely.
Moving onto run style / pace, 10 of the last 11 winners, and 36 of 44 win & placed runners, were either held up or raced no closer than midfield early. This seems to be a race where waiting tactics are the order of the day. Here is the pace map this time around:
All the early pace looks to be in the high numbers here so a middle to high draw could be the place to be.
Here are some of the leading contenders...
Seet – trained by the Gosdens who won this race in 2023 with Coppice. Is a very good trends fit and seems to have the right pace profile albeit having had just three career runs (six of the last 18 winners had just the three runs). Ryan Moore is an interesting jockey booking and, since 2008, the Moore/Gosden combo has secured 40 wins from 149 rides hitting close to a 27%-win rate, and this year they are currently seven from 12. Drawn 20 looks decent based on the pace map.
Glyfada – not seen on a racecourse as a 2yo but has had two wins and a second from three starts this year. Irish raiders have been successful a couple of times in the last 15 years. Oisin Murphy takes the ride which looks a positive. Drawn 31 which I am thinking might be a good one.
Symbol of Majesty – another from the Gosden yard. Was beaten favourite last time at Wolverhampton when getting poorly positioned from off the pace. Will need to bounce back. Drawn 21.
Darn Hot Gallop – Out of her depth in the 1000 Guineas but previously was three from three at a lower level. If the stable really thought the horse had the potential to be competitive at Group 1 level, then she must have a chance here.
Rosa Inglesa – Charlie Fellows bagged this race in consecutive years in 2019 and 2020 and runs Rosa Inglesa this time. Last time out was a comfortable winner at Nottingham and has been raised 9lb for that success. That doesn’t look too harsh to me. Drawn 19.
Suggestion: Famous last words but I want to be drawn middle to high here and hence my three favoured horses are Seet (drawn 20), Rosa Inglesa (drawn 19) and Glyfada (drawn 31). I’m going to suggest 5/1 Seet to win and 9/1 Glyfadaeach way.
Tix Pointers: A race where staying close to the top of the market has served very well. And a patient ride (midfield or held up) has got 11 of the last 13 winners.
5.35 THE KING EDWARD VII STAKES (CLASS 1) (Group 2)
Presented by Rory Delargy
Traditionally known as the ‘Ascot Derby’ the King Edward VII is rarely a target for those who have gone to Epsom due to its proximity, and it no longer enjoys the status it once enjoyed for all it still retains Group 2 status. Derby flop Ancient Egypt bids to get his career back on track but while I’d excuse his Epsom run on account of the soft ground, it almost always pays to pass over those who come here via Epsom, and he may have to wait for another day.
The race appears to be a clash between Gallinule Stakes winner Causeway and the Kempton novice winner Water Into Wine and the argument is whether the former can utilise his experience against a horse who had little more than an exercise gallop against vastly inferior rivals last time.
Causeway is a typical Coolmore product, being a son of Wootton Bassett out of a beautifully bred daughter of Galileo. His profile suggests that the trip could be an issue as he raced at a mile or shorter on his first four runs, but there is plenty of stamina in his pedigree and Coolmore have been breeding Galileo to speedily bred mares to produce middle-distance stars for long enough to know how the magic happens.
Causeway stepped up to ten furlongs in the Gallinule, a Group 3 that has thrown out champions like Ardross and Assert in bygone days, but only Leading Light has gone on to much greater things of recent winners and Causeway beat only a useful bunch to score at the Curragh. That said, he did score in the style of an improving colt, repelling the challenge of Zia Zabel with more in hand than a head would suggest. On the evidence of the run, he will stay this longer trip and looks a solid contender.
Water Into Wine has won a maiden and a novice in two starts, both over 1m3f, and has yet to be extended. The question with him is working out how much substance there is beneath the obvious style, and whether it’s enough to justify favouritism here. First of all, I’ll admit he didn’t beat anything of merit at Kempton last time when cruising to an 11-length win; but his victory on debut at Newbury is a better effort to judge him on, and he was less experienced than the colt he slammed into second that day. That colt, Richard Hannon’s Alderman, went on to Epsom on the back of that second-place effort and finished a highly creditable fifth to Christmas Day in the Derby, beating the likes of Pierre Bonnard, Ancient Egypt and Item by upwards of 2¾ lengths. That might flatter him a little but Water Into Wine made him look slow at Newbury and the winner is entitled to take another step forward given he’s yet to be fully tested.
Some are wary of the switch from all-weather to turf for big races, but Newbury proves he’s effective on firmish ground and I’m inclined to take a very positive view of his form, with his campaign reminiscent of the way Lucarno was campaigned for the same connections before winning the St Leger. I think John Gosden has been quite clever to come here rather than the Queen’s Vase as he was likely to find a smaller field, which will help to offset his inexperience. Causeway will be by far his toughest opponent and will not lie down, but I expect Water To Wine won’t need a miracle to maintain his unbeaten record.
Suggestion: 1pt Exacta Water To Wine/Causeway
Tix Pointers: Only the Covid edition messed things up for jollies on the placepot ticket. As the last leg, it might be one in which to bank and lay the favourite for a place on the exchange?
6.10 THE PALACE OF HOLYROODHOUSE STAKES (CLASS 2) (Handicap)
Presented by David Massey
There’s a fair spread of pace across the course here, although I’d be surprised if anything led up the speedball that is Revival Power from the low numbers. I’m a massive fan of hers, she did me a few good turns last year but it is worth remembering she did get herself a bit stewed up before the Queen Mary last year and her effort fizzled out as a result. If she can keep a lid on things this time around then obviously her chance would increase, but I suspect there are other targets for her in the second half of the season and it’ll probably be a watching brief.
Only two horses with single-figure draws have hit the frame in this in the last five years; compare that to nine drawn 20 or above that have delivered an each-way return (and that includes three winners) and it probably pays to stick with those drawn high. With that, I think Starmade, from stall 30, makes plenty of interest.
So far Starmade has won twice on the all-weather, successful over 6f at Newcastle last time out (third a winner since) and whilst his three turf efforts don’t match that form, he’s only raced on ground described by Timeform as either soft or good to soft. There must be a chance he is going to improve for quicker conditions here, and the way he travels strongly towards the midfield/rear in his races is probably the right sort of runstyle required to win this. I see some 25s around as I type; 20s and bigger looks perfectly fair.
Dickensian, second in the Windsor Castle last year, is more obvious but is worth pointing out all the same. Last year, he was showing a lot of speed in his races and not always seeing them out, so it was interesting to see new tactics employed on his reappearance at York last month, Shane Gray dropping him out and allowing a fast pace to come back to him at the finish. He showed plenty of tenacity to poke his head in front late on, and that form looks strong; the second home, Simplify, is an improver, and third home Aspect Island lost nothing in defeat when finishing midfield in the King Charles III Stakes here on Tuesday. There should be more to come from him now he’s shown himself tactically versatile.
To complete the shortlist, there's nothing wrong with the claims of James Owen's Cherry Baker. Her profile is probably a bit less sexy than a few, but she's nicely drawn, has the right hold-up run style, and it's a case of whether a drop to five furlongs is going to suit. It might, as for all she's been tried over seven furlongs and a mile, her best form has come over six, her record at that trip reading 112; she comes here in cracking form after two good efforts at Chester. It's not hard to see her finishing off well, and she's one you should at least have in all your exotics here.
Suggestion: Try Starmadee/w at 25/1 or bigger, or Dickensian at 12/1
*
That's it from us for Royal Ascot week. As always, we invite you to go solo on Saturday, and wish you all the best of luck. Thank you very much to my fantastic support (Dave Renham, Sam Darby, Gavin Priestley, David Massey and Rory Delargy) and, mostly, thank you very much to you for following along with us. I hope you've been lucky.
Enjoy the rest of the sport!
Matt
https://www.geegeez.co.uk/wp-content/uploads/2025/06/Cercene_CoronationStakes2025.png318830Matt Bisognohttps://www.geegeez.co.uk/wp-content/uploads/2022/10/geegeez_banner_new_170x78.pngMatt Bisogno2026-06-18 14:08:402026-06-19 15:39:37Royal Ascot 2026: Day Four Preview, Trends, Tips
It's Gold Cup day, or Ladies' Day - or even Thursday, or Day 3. The hump day of Royal Ascot features the showcase event, the Gold Cup, a Group 1 run over two and a half miles. There is, of course, a further trio of top class shermozzles either side of that blockbuster, so let's get to it...
Bet £5 or more into the placepot/jackpot pools via Tix and, if you played the highest ROI ticket on the day, you'll get an extra £50 - on top of the 5% bonus paid to ALL winning bets placed through Tix.
Our friends at the tote are refunding stakes (up to a tenner) if your pick runs second in any Royal Ascot race
(*opt in required and, as ever, check the terms, etc).
Soil Moisture: 41%, readings taken on Thursday at 8.30am.
Rails: The rail on the round course is now at full width everywhere. Providing fresh ground today from 9f out to the Home straight
Stalls: Straight Course: Centre
Round Course: Inside
2.30 THE CHESHAM STAKES (CLASS 1) (Listed)
Presented by Matt Bisogno
In a change to the running order, the Chesham appears as the first race of the Ladies' Day card, a trappy seven-furlong juvenile heat for Listed honours.
The Chesham cheat code appears to be thus: either a once-raced Aidan that got beat, or one of the top three unbeaten-in-one horses in the market. That would have got you nine of the last 11 winners, one of the other pair being the unbackable Holloway Boy on debut and the other the dual winner Pinatubo. Those winners included 12/1 Snellen and 14/1 Suits You.
Taking that approach aligns quite well with the market, the nominated APO'B runner Aix La Chapelle heading the field. He was easy enough to back when sent off 4/1 on his debut (7f, good to yielding) a fortnight ago, and had plenty to do a quarter mile from home. But the further they went the more inevitable was the son of Justify's victory, eventually pulling away by a widening length and a half. He made up a good five lengths in those final two furlongs and looks the obvious one to beat granted normal improvement.
Richard Hannon sends Aperoll with a similar profile to the favourite. She, too, is a once raced winner from about a fortnight ago, though she was more handily placed when taking a Newbury novice over six and a half furlongs. A daughter of Ghaiyyath, she's a January foal and as such is entitled to a precocity edge on most of her rivals. Plenty of fillies have won the Chesham in recent times, including Bedtime Story (2024) and Snellen (2023) as well as September (2017).
Karl Burke won this race in 2022 with the unraced Holloway Boy - some feat - and he's since further advertised himself as one of the top trainers in the country, particularly when it comes to juveniles. He's represented by Revels, easy three length winner of a Redcar maiden a month ago on his sole start. The second has yet to run again but the third won by almost five lengths on his next outing. This son of Lope De Vega is, unsurprisingly perhaps, owned by a member of the Mars family - Ms L Mars, in fact - and she's another that can obviously step forward. [Proud of myself for resisting all kinds of sugar/confectionery puns there].
Time For The Moon shouted his credentials when blitzing a field of Musselburgh novices by 7½ lengths - yikes. However, that was on his second start so he's less scope to improve than the once raced brigade, and - respectfully - it was Musselburgh and the time was good but not great. Moreover, he's gone from the front in his two races so far, with only last year's winner, Humidity, managing to make all in the past decade. It's not easy to do. Still, he has credentials.
Sea Venture has had the sole start, bolting up by three lengths in a Haydock fillies' maiden four weeks, and she is another unexposed runner. The form awaits a boost, though, with none of the five runners since making the frame; that includes the second and fourth, both beaten more than five lengths on their next starts.
Another son of Justify, Nola Soul, travels across for trainer John Stack. He beat a couple of Aidan's as well as a horse called Chesham, presumably fancied at some point to wind up here; closest to him that day, however, was King Of Cloughan which runs in the Windsor Castle on Wednesday: that clearly will be a line of the merit of the form, with the third-placed horse already having won since.
The most expensive horse in the field is an Amo-owned Charlie Johnston-trained Frankel colt called Pikachu. Named after the cute little pokemon, he was second on debut at Thirsk, behind the more experienced Alfred Wallace - another headed for Wednesday's Windsor Castle - and should improve plenty for that. He's a place player at least.
Suggestion: Aidan won this in 2024, 2021, 2020, 2017 and 2016; but he didn't win in three of the past four years. Aix La Chapelle has a very good chance and I think I'll save on him; but I'm going to have a point apiece on a couple at prices, Aperoll and Revels. Not because I'm thirsty and hungry, you understand, but rather because both bring impressive unbeaten-in-one form to the party and look definite value at around 10/1.
Tix Pointers: Keep it Aidan on A, and unbeaten winners of one on B.
3.05 THE KING GEORGE V STAKES (CLASS 2) (Heritage Handicap) (GBBPLUS RACE)
Presented by Rory Delargy
The most interesting angle into this 1½m handicap is the effect of the draw. Logically, on a round course, the uneducated view (including among jockeys and trainers who should know better) is that being drawn close to the inside is a positive, and being drawn very wide is a negative. The truth is very different, as results of races over course and distance, and particularly the King George V, show. Here are the results since 2021 based on stall number:
As you can see, a very wide draw is no disadvantage (such results are borne out on a wider scale) and while those drawn low can and do get involved, they are the ones who tend to require a bit of luck in the run. When the field fans out in the straight, those who come widest tend to end up on the quicker ground and when races are run at a strong gallop as they usually are, those coming late and wide are at an advantage. 2022 was a year where the pace slackened mid-race, favouring those who were well positioned at that point, but it’s a rarity for pace to drop in that way with plenty usually keen to press on.
The pace map suggests that low-drawn horses should dominate the early stages but because those who want to lead are drawn close together, there must also be a decent chance that they get involved in a battle for primacy that produces some overly strong early fractions. Those on the front end can enhance their chances by dapping on the brakes at that point as a relentless gallop will play to the hold-up horses, but predicting mid-race tactics is almost impossible in advance and I’m relying on the pace map which predicts the gallop will be strong.
A strong pace isn’t just an indicator of where in the field the winner might emerge, but confirms that whatever horse wins will have had to show stamina for the trip; on that basis, I’d be keen to exclude those who appear best at up to 1¼m. A key trial for this is the London Gold Cup at Newbury, which this year saw Lost Boys beat Sahara King and Tierra Del Toro. That was over 1¼m and I thought Tierra Del Toro was the one of the principals who would most benefit from the extra quarter mile here, as he took time to hit top gear before staying on best of all in the closing stages. He was without a prep run for that valuable contest, so I expect him to improve a little more for that first outing of the season, and while I’d prefer him to be drawn wider, stall 10 looks a good spot to stalk the leaders while keeping out of trouble. Ralph Beckett’s Lope de Vega gelding is untried at the trip and his half-brother Alcaraz has won only at 1¼m, but their dam is a full-sister to dual Arc winner Treve, which gives plenty of confidence that he will relish 1½m.
Cannes is one who looks sure to benefit from a test of stamina having landed a decent maiden over the trip at Leopardstown last month. That form looked good at the time and has been franked by wins for the third and fourth placed horses since (second yet to race again), while Cannes is likely to do better still as his stamina is drawn out in a well-run race, his dam being a half-sister to Mojo Star, who was runner-up in the Derby, St Leger and the Gold Cup here. I don’t think the Leopardstown contest got to the bottom of Cannes and he remains completely unexposed. Joseph O’Brien had his handicap record at Royal Ascot questioned at the start of the week, but saddling the 1-2 in the Ascot Stakes answered such criticism in resounding fashion. Stall 21 is a cracking position based on recent results of this race and he should have the race run to suit.
Tix Pointers: High draws are where it's been at. One day it won't go that way, but usually that's the counter-intuitive route in Royal Ascot handicaps over 1m4f.
John & Thady Gosden’s Legacy Link seemingly holds all the aces here. Her dam is Frankel’s full sister, and this filly is already building a little legacy (pardon the wordplay) of her own, still looking far from the finished project when winning the Musidora at York, outbattling the smoother-travelling Felicitas; and then her second in the Oaks to Thundering On, where she saw out the mile and a half well enough, another step forward.
She is, on form, the one to beat. But look at the prices of the last five winners; 7-1, 12-1, 13-2, 11-4, 18-1. Not a favourite in sight, and we’ve seen the likes of Kalpana, Al Asifah and Noon Star, good fillies all, turned over after previous good runs in Musidoras, Pretty Pollys and Oaks's. Yes, it’s been a bit of a favourites' graveyard recently, and that gives you hope if you’re taking her on.
Gilded Prize has been made second favourite by the books but it’s hard to see what that's based on. Yes, she was impressive enough when winning a Group 3 at Saint-Cloud back in April; but that form would need improving on, and she looked a bit on the slow side when easily brushed aside at Longchamp last time. This step up in trip might help, but all in all she looks short enough.
Earth Shot is improving for William Haggas and her head second to Inis Mor in the Height Of Fashion at Goodwood looks better after the winner finished third in the Prix de Diane at Chantilly last weekend, a very good run. On the bare form she has a lot to find, but she’s going the right way and her pedigree offers plenty of hope she’ll improve again for moving up in trip, the dam a winner at a mile and three-quarters. I like her profile and she is on my shortlist.
Aidan O’Brien has won this for the last three years with lesser fancied fillies, and Composing fits the bill as far as that profile is concerned. She’s getting a pair of blinkers to try and get her back on track, and that did the trick for Port Fairy a couple of years ago when O’Brien equipped her with a first-time visor. Impressive when rattling off a hat-trick last summer, including in G2 and G3 company, she appears to have lost her way this year; but her last of six at Longchamp last time wasn’t a bad effort strictly on the figures, and given she’s looked a bit short on gears this mile and a half could help. I can’t quite bring myself to put the red pen through her, given her trainer's recent record in the race. I think she might keep drifting and if there’s some 20-1 around on the day, I can see myself having a small win-only bet.
I think, if there’s going to be an upset, then Ralph Beckett’s Lady Roisia might be the one to supply it. If there’s one horse that’s almost cast-iron to be guaranteed to appreciate a step up to twelve furlongs then it’s her: the dam was Oaks winner Talent (also trained by Beckett) and there’s stamina on the sire’s side, too. Badly in need of her first run of the season at Newbury when third to Esna, she’ll strip a lot fitter for that here and I liked her physically when she won at Nottingham at the back end of last year. In a race that keeps throwing up little surprises, let’s hope she’s the latest in that line; at 20-1, I make her the each-way bet here.
Suggestion: Try Lady Roisia each way at 20/1
Tix Pointers: Aidan and Team Gosden have won ten of the last dozen renewals. They were unplaced in the other two though, so maybe leave a trailing leg?
The Gold Cup is historically the centrepiece of the entire Royal Ascot meeting, and chronologically precisely that fulcrum, with 17 races before and the same number after. It might be that races like the St James's Palace Stakes have become a little more fashionable with speed admired over resolve these days, but this is always a compelling watch and frequently the province of the returning champ - who doesn't love that?
This century has given us the brilliant four-time winner Yeats, triple scorer Stradivarius, and dual champs Royal Rebel and Kyprios. Where better to begin, then, than with the defending Gold Cup hero Trawlerman? It's fair to say that I was a little unkind to him in the aftermath of last year's Gold Cup, opining that a seven-year-old couldn't be improving and that he'd been given a very soft time of it on the front end that day.
While there was some truth in my brickbats, Trawlerman went unbeaten in two further races last term, the G2 Lonsdale Cup and the G1 Long Distance Cup on Champions Day. A feature of his wins has been a mid-race injection of pace and then even finishing fractions: in plain English, he gets his rivals out of their comfort zone early and then keeps them uncomfortable.
It's probably fair to say that it was far from a vintage renewal last year, and indeed that the staying crop was below par as a whole. That counts against the dependable but (relatively) limited Sweet William, stablemate of Trawlerman, who possibly doesn't quite stay this far either. He did win the Doncaster Cup over 2m2f and kicked off 2026 with a win in the Sagaro here over two miles. A very likeable chap, he's not on my mind for this.
Of the other golden oldies, Dubai Future stayed on into a never dangerous 3rd a year ago and he's 50/1; he will presumably again be ridden to pick up pieces. And Al Nayyir has been consistent, mainly in defeat and usually at slightly below top class.
Joseph O'Brien showed his talents with stayers on the flat on Tuesday when saddling a 1-2 over the course and distance in the Ascot Stakes, so his Al Riffa is worth a second glance. Now six, he was a Group 1 winner in Germany in 2024, and he doubled his top tier tally when bagging last year's Irish St Leger over 1m6f. Since then, he's been racking up the Avios (and almost £300,000 in prizemoney), with good runs in defeat in Australia, Hong Kong, Dubai and France. This will be a half mile trip increase and he's not certain to stay, but he does bring a level of form few of his rivals can boast.
It's been quite the journey for Caballo De Mar, beaten 15 lengths in a novice stakes this week two years ago - to be fair, the winner was Ombudsman! - and a seven-race maiden before breaking his duck, off 64, in an Ayr handicap in September 2024. What fun connections have had since, as this unfashionably bred and cheaply bought son of Phoenix Of Spain has totted up nine wins via that starter at Ayr, then Southwell four times on the bounce (!), Haydock, Dortmund and Longchamp twice - both Group 1's. Additionally, he ran second in the Chester Cup, the Copper Horse Stakes here last year, the Dubai Gold Cup and in Sweet William's Sagaro. Wow. I do have a niggle that some of those overseas wins were a little below the level needed here, and I suspect Al Riffa will reverse the French form from last time if he sees out the extra yardage.
The other new kids on the block and, aged four with a bit more improvement potentially, are Rahiebb and Scandinavia. Rahiebb is trained by Roger Varian and, after a three-year-old season of knocking on the door - most notably when a neck second to Scandinavia in the St Leger - the more mature four-year-old model was an unequivocal winner of the Group 2 Yorkshire Cup in mid-May. That was 1m6f and he'll go almost a full Wokingham further here, which is the major question mark. His late sectionals certainly lend credence to the idea that he will stay but it's a risk that needs factoring into his price.
Rahiebb's old rival Scandinavia comes here on a five match unbeaten run that started in the G3 Bahrain Trophy last July and has taken in the Goodwood Cup, the St Leger (Doncaster), the Vintage Crop (Navan) and the Saval Beg at Leopardstown. As a result of that nap hand he's a very short price here, but he's not actually stepped forward on his level of form across that quintet of scores. He definitely looks under-priced to me and I'm taking him on, for all that he obviously has a sexy knack of getting the job done.
In the end, it looks a three-horse go between the top trio in the market: Scandinavia, Rahiebb and Trawlerman. Although he still sets the standard, my feeling is that Trawlerman, on seasonal bow and now aged eight, is vulnerable to the more progressive four-year-olds. There was only a neck between Scandinavia and Rahiebb in the St Leger last autumn, the latter finishing well and just failing to get up. With both of them needing to prove they stay this far, the value call is definitely Rahiebb.
I expect that Al Riffa could get into the first four if he stays, and maybe onto the podium. He's clear best of the rest for me.
Suggestion: Back Rahiebb to win at 4/1. Have a look at Al Riffa e/w at 10/1.
Tix Pointers: Another Aidan/Gosden benefit. Probably keeping it simple here as plenty of problems to follow...
4.50 THE BRITANNIA STAKES (CLASS 2) (Heritage Handicap)
Presented by Sam Darby
I shared the historic draw and pace data in yesterday’s Royal Hunt Cup preview, so if you want to reference that before having a bet, you’ll find it in the Day Two preview article here. As I am writing this before Wednesday’s racing begins, I have less information than you’ll have by the time you read this. But on Tuesday it definitely looked as though high draws were advantageous on the straight course; it will be interesting to see if that changes on Wednesday. The spread of the early pace could have an impact on any potential draw bias here, so the pace map should be insightful.
The pace is pretty evenly spread across the course - and there looks to be lots of it! Given the straight course tends to favour patient rides anyway, this really could be a race where you want to be held up out back and played late. It goes without saying that any amount of these horses could be well ahead of their marks, such is the nature of these big field 3yo handicaps where pretty much every runner is lightly raced. This is more of a race to follow going forward, rather than to bet on, but that doesn’t mean we can’t back the winner as well! There are two horses that I like in this one. My more favoured pick would be Outback Heat, who was well backed following the final decs on Tuesday. He won a course and distance handicap on his most recent start, coming from last to first. Winning that race before landing the Britannia Stakes is a path this trainer took with Docklands back in 2023 and Harry Eustace also saddled the runner up in this race last year (La Botte). After just three starts, Outback Heat is entitled to improve as much as anything in this field and he beat the subsequent Silver Bowl winner (who reopposes here on worse terms) in that race, alongside some other runners who have placed since in good races. He’s drawn in 18, which might be a bit closer to the middle than ideal, but it does give him the obvious option of switching to the near side. My main question mark is Kaiya Fraser keeping the ride. He’s been on board for all three runs so far, so at least knows the horse well, but I’d have preferred one of the top jockeys. The other one who catches my eye is Wechaad for Roger Varian. He’s a bit more exposed than some of these, with six runs under his belt, and whilst I’m on the negatives, maybe he wants a bit more cut in the ground. He caught the eye on seasonal reappearance at Goodwood though, in a race that is often a good guide for this (2021 winner Perotto took the same route), where he not only did best of those held up but he did best of the high draws, too. Any draw/pace students out there will know how detrimental stall 15 is over 7f at Goodwood, so that effort can be massively marked up. He’s drawn in stall 28, whereas many of the market fancies appear to be low drawn. If the higher drawn horses are at an advantage, like I think they could be, then there should be some really nice value to be had.
Suggestion: Try each way Outback Heat at 11/1, and Wechaad at 9/1.
Tix Pointers: One of the top four in the market has usually won this, but a couple of wacky placepot results involved the joint fifth and joint seventh in the markets being the highest betting rank placed horse. Spread out!
- yet to win at Group level (15 of the last 15 winners)
- an official rating of 103+ (14/15)
- raced 3-7 times in their career (14/15)
- came from the top 4 in the betting (13/15)
- returned less than 8/1 (14/15)
13 of the last 15 winners had won at least one of their last three starts and had finished top 6 in all of those three starts (14/15).
3 of the last 15 winners last raced at Epsom (from just 9 such runners).
In the last 15 years, all 22 runners that had their last start in a class 3-5 race, all 15 horses that last ran in the 2000 Guineas, all 12 horses that last ran in a Group 2 and all 6 horses that last ran on the all weather have been beaten.
Traditionally this is a race for those who missed the Derby due to stamina doubts or those that did run in the Derby but didn't stay. The trends are pretty strong and leave us looking at easy Listed winner Endorsement or Lingfield Derby Trial flop Maho Bay.
By Dubawi out of a Dandy Man mare, Maho Bay is probably not bred to stay, especially since everything in his pedigree ran (well) at up to a mile. He'd looked good when taking a Newmarket novice over ten furlongs in handsome style but stopped quickly over the Derby trip in the Lingfield trial. This step down will certainly suit but he needs to find more than his demonstrated level of form.
The form of Endorsement is rock solid having run a 1/2 length second to Derby winner Christmas Day and filling the same position by the same margin behind Derby third James J Braddock in two of the top Irish Derby Trials ealier in the Spring. He was last seen trouncing his field in a 12f Listed contest by over 7 lengths and is another favourite who has the level required to win this Group 3 with the only question to answer being whether he can perform just as well back over 10f.
Suggestion: Back Endorsement at 9/4
Tix Pointers: Every one of the last 13 winners started in the first four in the betting. Only one of the last eight winners also won last time out. So a fancied runner that perhaps doesn't look like one?
6.10 THE BUCKINGHAM PALACE STAKES (CLASS 2) (Handicap)
Presented by Dave Renham
This race was taken off the calendar in 2015 but reinstated in 2020. Hence in terms of trends, I am looking at the last ten renewals, which cover 2011 to 2014 and 2020 to 2025.
Two wins for horses from the top four of the betting, with both being favourite (last two years). Five winners priced between 12/1 and 18/1; the other three were 25/1, 33/1 and 50/1.
4yos have won six of the last ten (60%) from 40% of the total runners. 4yos do have the best placed record (roughly double compared with the other age groups combined).
7yos and older have a poor record win 0 wins and just 5 places from 45 runners.
Seven of the last 10 winners were priced 15/2 or shorter on their most recent start. This equates to 70% of the winners from just 42% of the total runners.
Draw
The number of runners each year has fluctuated between 23 and 29 so for my draw analysis I am using the Nick Mordin technique of ‘reversing’ the draw because the very highest draws are berthed next to the stands’ rail. Hence, I am looking at how far the stall position has been away from the stands’ rail to hopefully give the most accurate draw history.
Looking at the last ten renewals, I have collated Percentage of Rivals Beaten figures (PRBs) for different sections of the draw. I have looked at the PRBs for all runners and then focused on those 33/1 or shorter in price, ignoring the complete rags. For the record, non-runners have been taken into account, so the draw positions have been adjusted to allow for this. My findings are as follows:
As the numbers show horses drawn within ten stalls of the stands’ rail have had a significant edge in this race over the past ten years. Indeed, last year’s race saw a huge draw bias as the race result below shows:
Now, draw bias can come and go at the Royal meeting, but personally a middle to higher draw would be my preference in this race unless the ground came up soft.
Run Style
In terms of run style 29 of the 40 win/placed runners over the last ten renewals were held up or raced mid division. Hold up horses have the best record when we analyse the PRBs hitting 0.58. Generally, a horse coming off the pace would be preferred.
For a field this size there is a surprising lack of genuine front runners. River King looks the most likely from 14, but it will be interesting to see therefore how quickly they go early.
With a maximum field declared here are my thoughts on a few of them.
Defence Minister – has been unlucky with the draw several times in the past with a prime example being his most recent race, over course and distance. There he was drawn on the wrong side, finishing third of his group but 17th overall. The two runners in his group that finished in front of him both ran well next time so his run was far better than the finishing position suggested. However, based on recent renewals of this race, he could have been unlucky with the draw again as he has a low berth in 8.
Hickory – definitely has age against him in terms of past trends for this race, but with two wins and five placed runs at Ascot he clearly loves it here. Having said that he was disappointing over C&D first time up this season. Was not suited by the run of the race at Sandown last time as it was dominated by horses that were up with the pace that day. Will need a career best to win, but may be worth a look in markets offering lots of places. Has the right type of run style and he is drawn in the middle so has options.
Cosi Bello – Lightly raced four-year-old with just five career starts (three wins, one second, one fourth). Up 2lbs for his seasonal debut win at Haydock in May after which trainer Charlie Fellowes said, "the Buckingham Palace Stakes is the obvious target. I think we’ll go straight there and keep him fresh. The stiff seven will suit him perfectly." Tends to race from off the pace which should be a plus, and he is drawn in 26.
Great Acclaim – Has raced over course and distance three times including when second of 28 last time out. He has been raised two pounds for that effort but his mark of 100 looks fair. His other two runs over course and distance also saw good efforts with another big field second and a 4th of 15. He has a very consistent profile and if excluding his 2yo career he has won six and been placed seven times from 24 starts. Could be well drawn in 23.
The Wizard Of Eye – Beat Great Acclaim over course and distance last time which was his second track/trip success. Raised five pounds for that win and would need a career best at the age of seven to win this. Could be ideally drawn though in 29.
Dance In The Storm – Has had seven runs on the turf with two wins and two placed efforts. Won first time up this year at Chepstow before disappointing at Epsom on Oaks day when fifth of 16. Epsom might not have suited her and if we can forgive that run then she should be there or thereabouts. Looks the best of the very low drawn runners.
River King – Not been out of the first three in five turf starts and has a PRB of 0.91. Comfortable winner from the front at Newbury LTO over 1 mile and likely to press on early here dropped a furlong. It’s hard to win from the front at Ascot but has a clear form chance. Drawn 14.
Suggestion: The draw could play a big part here again, but we can never be 100 per cent sure how that will pan out. In such a big field I am happy to try three against the field. I’m taking 20/1 Great Acclaim and 8/1 Cosi Bello from the higher draws and from the lower draws I will take a bit of a flyer on 25/1 Defence Minister as I have always been a fan of negative draw bias.
And that's a wrap for Ladies' Day. It doesn't get any easier, does it? But it should be another cracking day of sport, and one good winner will apologise for many other wagering missteps.
It's Day Two, Wednesday, at Royal Ascot and we have seven more top class races to watch / puzzles to solve. They are led off by the juvenile fillies but, before that, a couple of reminders...
Reminder 2: we've got a free £50 Tix competition every day. Bet £5 or more into the placepot/jackpot pools via Tix and, if you played the highest ROI ticket on the day, you'll get an extra £50 - on top of the 5% bonus paid to ALL winning bets placed through Tix. Click here to take part
Our friends at the tote are refunding stakes (up to a tenner) if your pick runs second in any Royal Ascot race
(*opt in required and, as ever, check the terms, etc).
The going for day two of Royal Ascot, Wednesday 17th June, is: Good to Firm.
GoingStick at 8.30am: Stands’ side: 8.9 Centre: 8.7 Far side: 8.5 Round: 7.6
Stalls: Straight Course: centre Round Course: inside
Rail movements: The rail on the Round Course will be positioned approximately 4yds out from approximately 9f out to the home straight. This will remain in place until after racing on Wednesday.
Weather: Dry overnight to Wednesday morning. It is forecast to be generally dry through the week, with an occasional shower possible on Friday. Max temp expected to be between 22 and 26 to Thursday when they could increase further.
2.30 THE QUEEN MARY STAKES (CLASS 1) (Group 2)
Presented by Gavin Priestley
Trends
All of the last 11 UK and Irish trained winners had run in the last 50 days.
10 of the last 11 UK and Irish winners had won at least one of their last two races.
9 of the last 11 UK and Irish winners had won 50% of their races.
11 of the last 15 winners had their last run over 5f (or less).
14 of the last 18 winners were sent off 4/1 or shorter last time out.
8 of the last 11 UK and Irish winners won their last race.
7 of the last 11 UK and Irish winners had suffered at least one defeat.
11 of the last 15 winners had run once or twice in their career.
All 33 horses that last raced at Windsor have been beaten.
Since 2003, all 28 runners that last ran on the UK AW have been beaten.
Race Analysis
It's the race that Wesley Ward has had most success in (four wins) and it seems to have spurred a couple of his compatriots to join him on a trans-Atlantic mission this year. With a runner from France also set to line up it gives a truly international feel to the race.
We'll start by removing the maidens, those outside the top 3 last time, those which haven't won 50% of their career races and any that last ran on the all-weather. 11 of the last 12 winners have been drawn 10 or higher (6 of the last 11 were drawn 20+) with the US Speedball Campanelle the only one to recently defy a low draw when coming out of stall 1 in 2020.
If we apply these trends and look for those with a high draw we can reduce the field down to nine possibles.
Wesley Ward runs two with Ruiva subject of a few good reports and apparently his number one hope after trouncing her field over 4 1/2 furlongs at Churchill Downs. As is usual for the Ward juveniles she made all that day and I'm guessing we can expect similar tactics here from a favourable draw. She's yet to race on turf although Ward assures us she worked fantastic on the surface the other day. Only time will tell if she can handle the start, the surface and a jockey who has never raced outside of North America before.
That's too many maybe's for me and I'm happy to look elsewhere.
His other runner, Shining Moment, was equally impressive when also making all the running at Churchill Downs but she did it on the 5f turf track and that may be in her favour. The booking of jockey Oisin Murphy is eyecatching and I think she'll run a big race at a big price from an even more favourable draw (21).
But the Ward runner was really put in her place on debut by another American raider, MORE CHAMPAGNE, and has 6 1/2 lengths to find with that rival from their encounter on the turf at Keeneland back in April. Shining Moment pulled far too hard that day and set a ferocious pace up front making her a sitting duck as she swung into the straight. It was therefore no surprise to see her fold tamely in the last half furlong or so which allowed More Champagne, who had enjoyed the perfect run through the race, an easy victory as she came up alongside beautifully before quickening away to the line. The front two were miles clear of the rest of the field.
Coming out of stall 14 the Thomas Morley-trained filly should get another fast pace to aim at and, unlike the Ward filly, her jockey, John Velazquez, is no stranger to Ascot with four wins to his name at the Royal meeting. I think she's a cracking each way bet with five places on offer with most of the bookmakers.
Suggestion: More Champagne 1/2pt EW 14/1 (5 places)
Tix Pointers: In the past 11 years, there were four winning favourites and three second picks coming home in front. The jolly placed in two of the other four years, with another second choice making the frame in 2018... but in 2024 we got 22/1 (co 10th fav of 4), 50/1, 50/1. Incredibly, the placepot only paid £916.60 that day, the rest of the results being much more punter-friendly.
High drawn horses have an excellent record, especially on quicker ground.
Formerly a two-miler the Queen's Vase was foreshortened to a mile and three-quarters in 2017, and at the same time was elevated to Group 2 status in recognition of the importance of the staying Pattern for the health of the breed. That decision was instantly vindicated as the first winner of the new version was the mighty Stradivarius, who would go on to carry all before him for the next six seasons.
If hoping for the emergence of another such luminary seems somewhat fantastical, it is a more realistic aspiration that the list of Group 1 winners - including Queen's Vase / St Leger doublers Kew Gardens and Eldar Eldarov - might be extended.
Favoured this time is the Andrew Balding-trained Galiyan, stepping out of maiden company after a solid staying effort at Chester's May meeting over a mile and a half. Three of the last five winners were unraced at two and twice raced at three, so there are precedents. That said, two of that trio won Listed contests on their previous start, and the third was sent off a more agreeable 15/2 when claiming his QV. Galiyan looks very short on what he's achieved to date - he must be really good at home.
There's a bit more form meat on the Limestone bone, Joseph O'Brien's New Bay colt having won the Listed Yeats Stakes last time. That was the same stepping stone deployed by connections of last year's winner, Carmers, which add further to this one's appeal. Limestone has a nice level of experience, which perhaps means he lacks the upside of some of his peers; nevertheless it was a significant step up in form when significantly stepped up in trip for the first time at Navan. He's yet to race on good or quicker.
Aidan rolls the stamina dice with Port Of Spain, a lesser Ballydoyle light heretofore, and beaten in a handicap last time out. In his defence, that handicap was the kingmaker London Gold Cup at Newbury, where he didn't get the smoothest of trips and was beaten four lengths. By St Mark's Basilica out of a Duke Of Marmalade mare, there's a murmur of robustness in the blood lines; mostly, though, this is a trust play: Aidan has a hundred - literally - colts to aim at this race, and Port Of Spain is the nomination. He's got it right six times in the last 13 years meaning a win this time would grant him 50% of the winners over 14 years. Still, I'm having to squint pretty hard, and away from the actual form book to make his case.
Asakir looked all over the winner of the Yeats Stakes before ceding to Limestone late on. Limestone had led the field for more than half the race before three horses went by him; then, in the final quarter mile, Asakir cruised to the front before getting chased down by the winner. The pair pulled eight clear of a fancied APO'B runner and the form looks good. In the back of my mind I'm wondering if a different ride on Asakir could reverse placings with Limestone - at the respective prices, I want to crystallise that image. He is another yet to race on a sound surface and is not necessarily bred for it; but I'm getting out of my lane with that sort of chat.
The stoutly bred Del Maro - by Camelot out of a Maxios mare who herself won the German Oaks - was born to be good. Unfortunately, the numbers on his form profile don't quite match that smart pedigree, yet. The extra three furlongs and a bigger field should place more emphasis on staying power, and that should elicit improvement notwithstanding this will be his eighth start compared with some having only their third. He is another who can conceivably go well.
There's a Royal runner in this field's midst, too. Point Of Law was a clearcut winner of a Newbury maiden last time despite looking very green on his second career start. Always handy, they quickened off a steady early tempo and I'd be inclined to mark up a couple of the beaten horses more than the winner. None of the four to race again from that day has won, the third and fourth both finding one too good since. The Gosden stable won this, as referenced, with Stradavarius in 2017 and also with Gregory in 2023. The latter's profile was not dissimilar though he'd already secured Listed honours by the time he arrived at Ascot.
Still they come. Unbeaten in two Ravenspire runs for the Executors of the Late Sheikh Mohamed Obaid and Karl Burke, and he's probably a tad over-priced for all that he's achieved very little in those two small fields novice scores. And Archie Watson's decent Royal Ascot record means Wareeth - two from three either side of a clunk in Listed company - cannot be wholly ignored. He's bred stoutly and could enjoy this half mile longer trek.
Suggestion: Lots of possibles, including Port Of Spain for which I'm hard pressed to make a case (which normally means I've missed something material). That Yeats Stakes form is probably above average and both the winner and second, Limestone and Asakir, have cases to be made assuming they handle the terra firmer. Of the rest, Galiyan is too short but has obvious potential; and Del Maro could make the frame.
Try 7/2 Limestone for the win, and/or 9/1 Asakir or 14/1 Del Maro each way.
Tix Pointers: Consistently one of the more predictable races at the meeting, with five winning favourites joined by the same number of second favourites prevailing, and a brace of third choices since 2013. Indeed, the longest priced winner bar one was 15/2 (beat the favourite). When Aidan shocked us with 33/1 Sword Fighter in 2016, the 8/1 fourth favourite hit the frame, too.
As well as Aidan (obvs), look out for Charlie A and Andrew B, both of whom have saddled more than a third of their runners into the frame.
3.40 THE DUKE OF CAMBRIDGE STAKES (CLASS 1) (Group 2)
Presented by David Massey
A bigger field than is normally the case for the Duke Of Cambridge this year, although we did have fourteen runners a couple of years ago. Which was nice.
John & Thady Gosden have won this three times in the last five years so it makes some sense to start with Friendly Soul. Yes, the Mare That Closed Haydock DownTM, or something, thankfully returns here in one piece, and for all her quirks she looked in good form at Haydock before the incident, bowling along happily on the front and yet to be asked to go about her business when the hole appeared, and she was quickly pulled up. Essentially, take Haydock and the Musidora run - when she hung her chance away - out of the equation and you’ve got a very talented mare with some top-class efforts to her name. And that includes a defeat of Kalpana in the Pretty Polly back in the day, lest we forget. Nicely drawn in stall 5, she’ll have the hard-pulling Falakeyah to take her into the race and she looks the one to beat, assuming all is well after that last day mishap.
Blue Bolt has been made early favourite for this. Her best piece of form to date came when second in the Sun Chariot last year, that run capping off a season where she did nothing but improve and gave the impression she’d be even better at four. She didn’t need to be at her best to win the Listed Conqueror Fillies Stakes on her reappearance and she won with plenty in hand, backed off the boards to do so (Kon Tiki, She’s Perfect and Arisaig in behind). She’s clearly smart and, for all she’s bred to get a bit further than a mile, she isn’t short of speed; she is just about the right favourite if short enough on balance, though.
Hold-up performers have had their share of success in this in recent times (think Crimson Advocate last year, Rogue Millenium in 2023 and Indie Angel in 2021) and if they do go a step too quickly then the strong-travelling Catalina Delcarpio looks the one to be with. Her only disappointment (I say disappointing, it really wasn’t a bad effort) came in the Ribblesdale last year when she appeared not to quite see out the twelve furlongs. I think it was that, rather than the firm ground, that caused the defeat, but in any case she looked a much-improved filly when winning the Listed Amethyst Stakes at Leopardstown last month. Responding well to pressure, she took it up with half a furlong to run, and was strong at the finish. There was a lot to like about the way she went about things there, and as long as Billy Lee finds room on her - a low draw could make things a little tricky in that regard - I think she looks the main danger to Friendly Soul.
I do like to try and make a case for an outsider, as you know, but I have to be honest with you here and say that’s proving something of a struggle. I don’t suppose it’s impossible to see Arisaig dropped out the back and Jamie Spencer trying to bring her with a late run but stall 1 is going to make that difficult, a lot of luck will be required. I have a soft spot for Dash Of Azure though, and she did run well enough in the Sandringham last year (a closing fifth at the line) to suggest a mile is within her compass, for all she’s generally been kept to seven furlongs. Stall 13 and Rossa Ryan both look positives, and maybe if there’s an each-way swing with the extra places to be had, it’s her. Watch for her late on the scene.
Selection: Dutch 9/2 Friendly Soul and 8/1 Catalina Delcarpio, or take a wild swing at 66/1 Dash Of Azure
Tix Pointers: John & Thady Gosden three times, and Sr. once in his sole name, have four of the most recent six renewals.
Although four-year-olds have won 12 of the past 13, five-year-olds actually have a superior place strike rate (36% vs 24%) and PRB (0.54 vs 0.5). To wit, aside from a year when the two 5yos were 33/1 and a year when there were none of that age, there's only been a single year when a mare of that age has missed the frame - of course, it was last year. The vast majority of runners are younger, but don't dismiss the fives.
Four jollies got it done since 2013, but only one since 2017. However, the first or second market choice has made the frame every year in that time.
4.20 THE PRINCE OF WALES'S STAKES (CLASS 1) (Group 1)
Presented by Rory Delargy
In terms of pure class, the Prince of Wales’s Stakes is one of the highlights of the Royal Meeting and class tends to come to the fore, with only two winners at double-digit odds since Lear Spear sprung a 20/1 surprise in 1999. Six winning favourites in the last 20 runnings isn’t far behind market expectations, but there is clearly no edge in either backing or laying market leaders blindly.
Ombudsman won this last year having suffered defeat in the Brigadier Gerard Stakes (to the reopposing Almaqam, albeit conceding that rival 3lb), and he arrives here having won that prep this time around, and that despite suffering a setback since scoring in the Dubai Turf at Meydan in March. He is at his best on good or quicker ground, so conditions are again in his favour and he has strong form claims on balance.
The problem that Ombudsman faces here is that he has yet to meet a contender of the calibre of Daryz, winner of last year’s Prix de l’Arc de Triomphe. Well, that isn’t strictly true, as the unfancied Daryz was well behind Ombudsman in the International Stakes at York last summer, with Francis-Henri Graffard’s charge seeming to find the step up to Group 1 company too much after wins in four lesser races since making a belated debut in April last year.
If that defeat seemed to burst Daryz’s bubble in the minds of some pundits, they might have been nodding to themselves when he was beaten again by Croix du Nord in the Group 3 Prix du Prince d’Orange at Longchamp in September; but others sat up and took notice, seeing an improved effort even in defeat and noting that the fast-finishing Daryz would have won in a couple more strides and would have learned plenty from the experience. His supporters had plenty to cheer about when a more battle-hardened Daryz showed up for the Arc and turned the tables in no uncertain terms to prove himself to be a genuine superstar, catching Minnie Hauk with a strong late run and pulling 5½ lengths clear of the field as the pair battled it out.
That was a big improvement from Daryz, and one which could have been put down to the emphasis on stamina given it was his first try at 1½m, so it’s been noteworthy that he has been imperious in two Group 1 wins this season while stepping back in trip, winning the Prix Ganay (1m2½f) by 3½ lengths before scoring by the same margin in the Prix Aga Khan IV (formerly Prix d’Ispahan) when dropped to an extended 1m1f. I was with him in the Arc on the basis that he would be suited by the trip, but I must say he has taken a big leap forward in my estimation, looking to have the measure of his rivals in the Ganay and the Ispahan before unleashing a devastating late kick.
He’s neither a one-dimensional stayer nor a mudlark – Timeform have the going as good for his Ganay win and only a little slower for the Ispahan, and his wins this season have set a remarkable precedent. In the last century, no three-year-old has won the Arc and then gone on to do the Ganay/Ispahan double despite the prestige of those races, and that’s largely because most Arc winners tend to get a little slower with age, or at least better suited to 1½m than shorter; but Daryz is that absolute rarity – a top class middle-distance performer who is getting quicker with age.
*For the record, the Arc/Ganay/Ispahan treble had only previously been completed by two outstanding horses: Sagace (who won the Arc as a four-year-old and took the other pair of races the following season) and Allez France (second in the Arc at three before landing the Ganay/Ispahan/Arc treble the following season).
The prospect of “firm” in the going description is the one unknown for Daryz, but while it’s easy to suggest he’s best on ground softer than good, that is partly down to the fact that French going descriptions almost always err on the soft side. It’s very possible that he might prove even better on quick ground – that is certainly the case for stablemate Calandagan despite that horse’s early wins coming on softer, while Daryz’s most talented half-brother, Dariyan, won the Prix Ganay on ground that Timeform described as good-to-firm. Their dam, Daryakana, also gained her biggest success when beating Spanish Moon on a sound surface in the Group 1 Hong Kong Vase, so I think ground concerns could well be wide of the mark.
Suggestion: Back Daryz at 2/1
Tix Pointers: It's been very close between the four- and five-year-olds since 2013, younger leading 7-6 in wins and 22-9 in win/places... but the junior cohort was much more strongly represented. Looking instead at percentages, which we must, fives beat fours 20.7% to 13.5% on the win angle; but fours beat fives 42% to 31% on win/place, and 56% to 53% on PRB.
Six-year-olds and up were 0 from 18, two places, and a lamentable 11% PRB.
One of the top pair in the market has made the frame every year since 2003.
5.00 THE ROYAL HUNT CUP (CLASS 2) (Heritage Handicap)
Presented by Sam Darby
It feels like it’s always said you want a high drawn hold up horse for races like this, but is that backed up by historical data?
There is no clear advantage from the above, so we need to dig a bit deeper.
This is a bit more insightful. The top seven stalls, based on PRB3, are all 17 or higher, with four of those being no lower than 24. Looking solely at the last ten renewals of this race, five were won by stall 21 or higher, but three have been won by 7 or lower. This doesn’t necessarily prove that no draw bias exists, but it does suggest that the draw bias can change from year to year. The strange thing about the Ascot straight course is that you can be sure a certain side is favoured, and then in the next race, or on the next day, the complete opposite appears to be the case. Last year is a good example of this. In the 2025 Royal Hunt Cup, the 1st and 4th were drawn 32 and 30 respectively, whilst the 2nd, 3rd and 5th were drawn in the three lowest stalls. Then in the Buckingham Palace Stakes (7f) the next day, the first six home were all drawn 25 or higher. So on the Wednesday extreme draws were favoured (either side) and on Thursday you absolutely had to be on the stands’ side rail. You can go poor very quickly trying to focus on the draw too much in straight course races here, but a very high draw is rarely a big negative. As for pace, the above image shows that wherever you are drawn, being delivered late is a pretty hefty advantage.
It’s always important to analyse the pace map, too. It’s very interesting that many of the early pace angles here seem to be clustered around the middle, with Linwood (16) the most likely front runner and One Smack Mack (13) and Archivist (18) other possibilities. This further muddies the draw waters, as the pace setters might come up the middle, or they could go either side from those draws. From the lower draws, I think the market is correct in making La Botte and Indalo the two most interesting contenders. The former was runner up in last year’s Britannia off just a few pounds lower and since a poor run in the Lincoln, it looks to me as though connections have been looking after his mark for this. As for Indalo, he’s been amazingly consistent and has proven himself in some of the biggest cavalry charges, so his credentials are pretty solid. With the pace setup as it is, I can’t rule out the middle draws, and the one I’d be interested in is Irish challenger Jagged Edge. He’s won his last three starts at this trip, was hugely impressive when winning last time out and he’s another with a favourable run style. From the high draws I really like the look of Blue Brother, but as first reserve he needs one to come out so he can get a run. He was a massive eye-catcher in this race twelve months ago, when getting no run throughout, and having not run since he’s back off the same mark. Rogue Diplomat is one of only two horses drawn higher than Blue Brother and he’s assured of a run. He ran very well against a draw and pace bias in the Spring Cup at Newbury and can probably be forgiven a lesser effort since in France. I do think he might want a bit more juice in the ground, but I’ve seen plenty of horses that enjoy cut run well on fast ground on this straight course. So that’s five horses on my shortlist, which is too many to back.
Suggestion I definitely want to have JAGGED EDGE (16/1) on my side. He’s gone up 9lbs for his latest win, but I don’t see many ‘potential group horses in a handicap’ in the field, and he definitely looks like he could be one. Stalls 15 and 11 have won this in the past six years so he has a massive chance as long as it’s not like last year’s race where you have to be very high or very low. I hope the positioning of the early pace stops that from happening. If BLUE BROTHER (12/1) gets a run, he’s the other one I want to back, but assuming he doesn’t get in I’d take a chance on ROGUE DIPLOMAT at the prices (20/1) as my second bet. The handicapper has struggled to get a hold of him as he often only just does enough, and his Spring Cup run, which has worked out well, was eye-catching enough. The ground wasn’t exactly slow that day either. Any of these could turn out to be badly drawn once the race is run, so I’d be keeping stakes win only, despite bookies paying plenty of places. With that in mind, I’m sure you’ll get even better prices on the day on the Exchanges. I’ll have to leave the low draws. If it’s evident the far side is favoured before this race is run, you’d hope Jagged Edge could tack over from 15 to give us a chance.
Tix Pointers: It usually pays to focus away from the top of the weights and on more lightly raced four-year-olds, ideally held up for a late run. It is a very, very tricky race though, where spreading out seems the only way to go.
5.35 THE KENSINGTON PALACE STAKES (CLASS 2) (Fillies' Handicap)
Presented by Dave Renham
The Kensington Palace is a 1-mile handicap open to four-year-olds and upwards for fillies and mares only. It is a relatively new race for the meeting, inaugurated in 2021. In terms of trends, then, with only five renewals there aren’t really enough races to have built up firm patterns; and for the first three years the contest was run on the round course, with only the last two on the straight course. The two straight course races have both shown a high to middle draw bias so it will be interesting to see what happens today. One trainer has done well from a small sample, that being Ralph Beckett. He has saddled four runners from which he had one winner and two others placed.
The pace map for the race looks like this:
Here are some of the main contenders:
Radiant Beauty – four wins out of her last seven runs including a very decent win over course and distance last time on 9th May. Won that from the front and generally runs close to or up with the pace. Has gone up 6lb for that run but her revised mark does not look insurmountable. Drawn 14.
Alobayyah – trained by William Haggas and was an impressive winner on debut on soft ground at Yarmouth in the Autumn of 2024. Her 3yo year was disappointing but she was a real eyecatcher last time when third over course and distance to Radiant Beauty, finishing very strongly after being given too much to do. If she comes on for that run, she will be a big player. Drawn 16.
Stateira – a four-time winner from ten starts with three wins from her last five. Stateira is the highest rated runner in the race having been raised 27lbs since November, and it could be tough carrying that much weight. Drawn 13.
Zgharta – was disappointing at Ascot last time in the race already mentioned won by Radiant Beauty. She was well beaten in sixth that day despite being favourite but looks feasibly weighted if she can put that run behind her. It's interesting that Oisin Murphy remains on board given another runner from the Balding yard he would be eligible to ride. Draw 6 is possibly not ideal.
All Moonshine – yet to race on the turf but has been super impressive on the all weather. Third on debut and three wins on the bounce since. It is difficult to predict how she will perform on the turf for the first time especially having not been seen since February, but Andrew Balding is respected and is one to consider. Jason Watson rides after Oisin opted for Zgharta. Drawn 12.
Song N Dance – yet another horse from the Ascot race won by Radiant Beauty, Song N Dance finishing second. Ridden by the excellent Saffie Osborne and could have a good draw in 19. Looks slightly better value than some of the other horses that contested that Ascot race.
Suggestion: Most of the horses at or near the head of the betting are drawn in the middle (stalls 12 to 16). In races like this I tend to split stakes and at least back two, sometimes three if bigger prices. However, I am drawn here to the top section of the market and therefore I am sticking with one and that is 11/1 Song N Dance. She looks a bigger price than she should be. Back each way with as many places as you can get.
Tix Pointers: Only two of the 23 mares aged 5+ have placed; the other 18 places in this race's five year history were taken by four-year-olds (a cohort which dominate entries annually).
The shortest priced winner was 10/1 (5th favourite) and no placed horse has returned shorter than 13/2 so it's tricky again. Keep some powder dry for these last two legs!
6.10 THE WINDSOR CASTLE STAKES (CLASS 1) (Listed Race)
Presented by Matt Bisogno
Much to the frustration of some - notably 2021 and 2025 winning trainer Eve Johnson Houghton, though she was far from alone - the Windsor Castle has seen its distance increase from five to six furlongs but, more materially, with a condition that eligibility is only to those whose sire won over seven furlongs-plus as a juvenile or a mile and up at three. None of those flashy pure speed types here, then...
A look at the represented stallions make for odd reading, to be sure. In place of Ardad and Blue Point are the likes of Dubawi, Wootton Bassett and, slightly hilariously, Cracksman. The one sire amongst the entries that makes most sense on traditional readings of such things is Kodi Bear, a getter of legion swift juvies. Unhelpfully, though not unsurprisingly, he is responsible for more runners - four - than any other stallion in the lineup.
Let's kick off with the massive-priced Troublesome Guest, then. A daughter of Kodi, obvs, she made a lovely debut in a valuable novice event at Newmarket a month ago. Drawn very high, as with very low presumed a help, she'd be a dream result for two of the wiliest old hands in town, Messrs Margarson and Egan Sr. I hope she runs very well for them - and can actually see her outperforming her price, too.
Staying high, the Territories colt Ruler's Control moves from a win over five on heavy to six on good to firm. The way he travelled through the race gives hope that he'll have no bother in this melting pot setup and he's another Joseph runner with prospects.
On the other side of the track, favourite Sergei Diaghilev has box two. Trained by Aidan O'Brien - four from 11 with 6f 2yos, two more placed, in the past four Royal Ascots - and ridden by Ryan Moore, the pair have form in that context of 41120119. A son of Wootton Bassett out of a Galileo mare he is a Coolmore archetype, and he justified odds of 4/6 when taking a six furlong Curragh maiden (good) three and a half weeks ago. Assuming low is a fair place to be, he looks certain to go well.
Down the middle - ish - is Controlla, a daughter of Night Of Thunder who started out in stakes company, narrowly failing to reel in the leader in a Naas Group 3. She was a 25/1 chance that day and has demonstrable class as well as the sort of speed and stamina combination needed to get competitively to the line in a race like this. Like Troublesome Guest, she gets a five pound concession from the colts.
Middleham Park Racing have been at it a while now and they know very well what they're about. Two runners here, with two of the foremost trainers of juveniles - including at the Royal meeting - in Archie Watson and Clive Cox. Archie sends Alpe d'Huez, for whom it was all downhill (geddit?) in the Woodcote at Epsom last time. This son of Kodi Bear was staying on at the finish at the Derby meeting and ought to appreciate this stiffer test.
I think Clive Cox could be the best trainer of juvenile sprinters in Britain and we get to test that theory with Boleto, another Wootton Bassett, who did plenty wrong on debut at Pontefract a fortnight ago but still got up under a cute Callum Rodriguez ride. This lad needs to step forward a bundle and probably doesn't have a brilliant draw either, but in Clive and CalRod we can trust.
Lots of others with some sort of a chance that I find it very hard to quantify.
Selection: I'm mainly staying close to the top of the market here. Huge respect for Sergei Diaghalev who may just win, but 5/2 or so in a field of 25 feels wrong. It may not be, of course! Controllalooks a pretty fair each way alternative at 4/1. She brings the best form, though has nothing with which to back it up, and she could be smart. Interesting that connections opted for the newly extended Norfolk against the boys rather than the fillies only Albany at the same trip. In the long grass - the very long grass - are 20/1 Boletoand 66/1 Troublesome Guest, both of which are wildly speculative and should be staked commensurately!
That's Day 2, then. Mostly really tricky, on paper at least. Best of luck wth your Wednesday wagers and we'll be back for Ladies' Day tomorrow.
For most flat enthusiasts, it's the best week of the racing calendar as five days of elite action unfold in the presence of royalty at the 2026 Royal Ascot festival.
There are plenty of domestic runners from the pointiest part of the ability pyramid, alongside a select smattering of international players and a veritable glut of young, unexposed could-be-anythings. Yes, it will be an exciting sensory overload and punting will not generally be straightforward; but winners, where they're found, are likely to reward well. So let's see if we can't shine a light on two or three.
I have enlisted some expert support in previewing the racing from Dave Renham, David Massey, Rory Delargy, Gavin Priestley and Sam Darby, all familiar names to long-term readers of the blog and, crucially, all great judges with their own approaches to solving the puzzle. To round out each day's septet of previews, and as editor across all content, you're lumbered with me, I'm afraid.
To Tuesday, Day 1 of Royal Ascot, then, a perennial feast of Group 1 action, kicking off as tradition dictates with the Queen Anne Stakes, a straight mile G1 race for older horses.
Side note 2: we've got a free £50 Tix competition every day. Bet £5 or more into the placepot/jackpot pools via Tix and, if you played the highest ROI ticket on the day, you'll get an extra £50 - on top of the 5% bonus paid to ALL winning bets placed through Tix. Click here to take part
Our friends at the tote are refunding stakes (up to a tenner) if your pick runs second in any Royal Ascot race
(*opt in required and, as ever, check the terms, etc).
Royal Ascot Day 1 Going/Weather News
The going for day one of Royal Ascot, Tuesday 16th June, is: Good to Firm.
GoingStick at 8.30am:
Stands’ side: 8.6
Centre: 8.6
Far side: 8.3
Round: 7.6
Stalls: Straight Course: centre Round Course: inside
Rail movements: The rail on the Round Course will be positioned approximately 4yds out from approximately 9f out to the home straight. This will remain in place until after racing on Wednesday.
Weather: Dry overnight to Tuesday morning. 0.4mm rain on Monday. 5mm rain recorded through the past 7 days to Tuesday. Dry, warm day is forecast. It is forecast to be generally dry through the week, with an occasional light shower possible on Wednesday and Friday. Max temp expected to be between 22 and 26 to Thursday when they could increase further.
2.30 THE QUEEN ANNE STAKES (CLASS 1) (Group 1)
Presented by Dave Renham
A few race trends for the last 15 years of this four-year-olds and upwards mile Group 1 contest:
Age
4yos recorded 11 wins from 83 runners (13.3%); 31% placed.
5yo have had 3 wins from 58 runners (5.2%); 22% placed.
6yo and up had just 1 win from 36 runners (2.8%); 11% placed.
4yos have provided the most runners albeit from the biggest sample. However, their win strike rate is comfortably the best and their placed performance has also been best.
Market factors
8 wins for favourites, four of which started odds on
Horses priced 11/8 or shorter have won 7 races from just 9 qualifiers. To BSP backing all such runners would have yielded a 40p in the £ profit.
However, since 2018 there have been four big-priced winners – two at 33/1 and two at 14/1.
Course form
Course winners secured 10 wins from 58 runners (17.2%) with 36% placed.
Those without a course win had 5 wins from 119 runners (4.2%) with 18% placed.
A win at the course has definitely been a strong positive over the past 15 years.
Course LTO
9 winners ran LTO at Newbury from 68 runners (13.2%) with almost all of them (65) having raced in the Lockinge. Hence, the Lockinge has been by far the best trial for this contest in recent years, and backing ALL runners blind who ran in the Lockinge LTO would have produced returns just under 50 pence in the £.
Race Class LTO
12 of the last 15 winners raced in a Group 1 race LTO. LTO Group 1 runners have provided roughly 55% of the total runners in the race and 80% of the winners.
Career win percentage
British or Irish runners with career win percentage of 60% or more provided 7 winners from just 22 runners.
Queen Anne Stakes Pace Map
Before we look at some of the leading players, we can see there is not much pace on here, with only one of the nine horses, OperaBallo, having led in one of his last four starts, and he did that just once. Hence, this could be run at a false pace, which often complicates matters somewhat.
This year’s contenders
Notable Speech – fourth in the race last year where things didn’t go to plan. He pulled hard that day, was short of room at the 2-furlong pole, then lost ground going sharply right before the jockey dropped his whip. He was beaten just over two lengths. A year later he comes here as favourite having been in very good form recently, winning three of out his last four races, including the Breeders’ Cup Mile and the Lockinge. He is trained by Charlie Appleby and clearly has a strong chance. The slight concern is that he has not been seen at his best at this venue.
Docklands – did this column a huge favour last year having been tipped up each way at 25/1 in the morning. He loves Ascot's straight mile with his record reading three wins, three seconds, a third, and a close-up fourth of 16. Despite now being six, he looks as good as ever based on his two runs this year – a Listed win at Doncaster in March and then an excellent third at Sha Tin in the Group 1 FWD Champion’s mile in April. The only slight negative is that he has a few pounds to find with Notable Speech on Official Ratings. The lack of pace in the race shouldn’t be a problem as last year they went off quite slow and that did not inconvenience him.
Opera Ballo – the second string from the Appleby yard but a leading contender. A regular winner having taken seven of his nine career starts. He won the Bet365 mile at Sandown last time and is joint highest rated in the field with Notable Speech on 125.
More Thunder – This time last year he was running in the Wokingham handicap at the Royal meeting but has since progressed to Group 1 level, finishing second last time to Notable Speech in the Lockinge. He struggled to lay up with the pace early then and gave himself too much to do; if he can sit more handily this time his chance increases, which if the pace map is anything to go by he should be able to do. Further, that was his first run of the season so we can expect him to come on for that.
Suggestion: Notable Speech looks the one based on recent form, but at the prices I’m happy to split a point between two against him with More Thunder and Docklands.
Tix Pointers: The favourite has placed in seven of the last 10 years.
However, in 2018 (15 ran) the result was 33/1, 10/1 (4th fav), 20/1; and in 2019 (16 ran) we had 14/1 (co 6th fav of 3), 20/1, 20/1.
Four- and five-year-olds have won 12 of the last 13 renewals.
Older horses are 1 from 32 with a PRB of only 37% during that time. Four-year-olds have by far the best record.
17 of the last 18 winners had won their last start.
17 of the last 18 winners had won a race at Class 4 or higher.
All of the last 18 winners had their previous run in a Class 4 race or higher race.
15 of the last 18 winners were unbeaten over 6f.
16 of the last 18 winners were 1st or 2nd favourite on their last run.
16 of the last 18 winners had run 1 or 2 times.
14 of the last 18 winners were unbeaten coming into the race.
13 of the last 15 British trained winners had their previous run over 6f.
Race Analysis
If we look for one or two runs and a win last time out we can reduce the field by half and then by removing those that weren't well fancied in the betting last time we can lose a couple more. That gives us a nice shortlist to look through.
Archie Watson won the Coventry in 2022 and on the whole his runners have run well in this race (although all three of his runners last year were unplaced - best performance was 6th at 100/1). If we simply concentrate on his runners that had had just one run, over 6f on the turf which they had won, we see that these types have finished 31220. That's a winner at 8/1 and places at 40/1, 20/1 and 6/1.
Following the same trainer didn't work out for us last year but I'm going to give him another try as his sole entry SIOUXPERB looked very promising when skating home on his debut by four lengths at Yarmouth as the well fancied 4/6 favourite. The Yarmouth race was run on similar ground to what he'll encounter here and the form has been advertised since with the second home, who was a further three lengths clear of the rest of the field, going on to win his next two starts. Those two wins included a decent looking class 2 Novice event at Newmarket last time out which he won by more than three lengths under a 6lb penalty.
His form looks sound and if able to post a similar performance it should give him excellent each way chances.
Suggestion: SIOUXPERB 1pt EW 14/1 (4 places)
Tix Pointers: Aidan O'Brien has won with four of the five winning favourites in the past decade.
During that period, the fav placed only five times with two second favs hitting the board in the other five.
Of the remaining trio of Coventry's, it's been a random number generator of a podium: 2017 saw 11/1, 33/1, 8/1 (jt 3rd fav); in 2021, it was 11/1 (jt 6th fav), 66/1, 25/1; and in 2024 the impossible 80/1, 40/1 (jt 15th fav!), 66/1.
It might be worth playing a few tickets with the some wildness here.
3.40 THE KING CHARLES III STAKES (CLASS 1) (Group 1)
Presented by Rory Delargy
A huge field means the draw will surely influence the result and that’s much the same as last year when stalls 14-17 filled the first four spots in a 20-runner affair (three of the last four spots went to stalls 19-21, for balance, so it’s not simply a case of higher is better, but that smart horses drawn together can help each other in straight-track races).
Last year’s winner American Affair is a great starting point as he was drawn 16 last year and now has an eye-catching berth in stall 18, with speedsters Big Mojo and favourite Overpass on either side. In terms of overall pace, the presence in high stalls of speedy sorts Jakajaro and Mission Central helps fill out the pace profile of the high-drawn group, and it will be a surprise if that speed does not hold up throughout the race.
Not only does American Affair find himself drawn where the best of the pace is in the King Charles III, but we already know he’s best when asked to come late off such a strong pace, so having genuine contenders to set the race up for him means he can have no excuse. He will, in truth, need to be at least as good as he was last year to prevail, and he’s easily forgiven a rare below-par run in the Minster Stakes at York. Jim Goldie has long been a master at getting his sprinters to retain their form well beyond the first flush of youth.
In terms of dangers, there are several obvious ones, with Big Mojo and Overpass unlikely to roll over even if getting involved in a strong gallop. The latter has done much of his running in Australia over 6f, giving the impression that a stiff five might be his perfect scenario at a track like Ascot. His presence on the stands flank counts against those early pacers around him who need to dominate, but if they go very hard then there are some among the lower stalls who will be finishing strongly.
My pick of that half of the field is last year’s Commonwealth Cup heroine Time For Sandals, who will relish a strongly run five here and will be doing good late work. She’s another who can be forgiven her modest run in the Minster Stakes, with 6f on softish ground blunting her speed, especially when short of peak fitness. She appeals as the value danger, and indeed for exotics, while outsider Behike is another for that list having made a big impression at Lingfield. He is very much in the “could be anything” category, and is sure to do better still, for all Newmarket or Goodwood later in the summer may be more appropriate.
4.20 THE ST JAMES'S PALACE STAKES (CLASS 1) (Group 1)
Presented by Matt Bisogno
Never mind the width, feel the quality... a short field of six for this year's St James's Palace Stakes, the usual rendez-vous point of European Guineas winners. The winners of the English and Irish 2000 Guineas are in attendance, so too the beaten favourite in the French version, but the Poulains victor is a late absentee having caught a cold (or some such) at the weekend. Pity.
No matter, though, because in Bow Echo and Gstaad we have a proper match, with a couple of spicy curve balls in play to boot.
Both the aforementioned graced Newmarket's 2000 Guineas in early May, Bow Echo charging clear of Gstaad by most of three lengths - fully eight lengths back to the third - to stretch his unbeaten run to four in the manner of a generational talent. If that sounds hyperbolic, it might yet be; but the ratings guys fell of their perches with excitement at what they witnessed. Timeform went 131, Racing Post Ratings plumped for 127 and the BHA, racing's official scorer, went 126. These were the best, or joint best, ratings since Frankel's electric performance in the race in 2011.
Gstaad, for his part, franked the form emphatically when coming three lengths clear in the Irish 2000 Guineas three weeks later.
If there is a problem, and there may not be, it's that the depth of both races is highly questionable. Prior the Newmarket race, pundits and ratings outlets alike were decrying the absence of star quality; and when Gstaad lined at the Curragh he was 4/11 favourite, with the only credible rival on market telling (Distant Storm, the distant third horse from Newmarket) running up, against at a respectful distance. The fifth, seventh and ninth from Newmarket have been well beaten since, though the 11th placed horse did win next time out... in a Class 4 handicap at Kempton.
If the form has the substance the ratings lads say it does, Bow Echo ought to win on all known evidence. But if it's been overrated by flattering defeats of sub-standard horses then the door is just ever so slightly ajar for a runner with a different profile. The obvious one on that score is Puerto Rico, whose juvenile level was solid and who disappointed connections in Paris in their Guineas. Still, he did finish fourth that day shaping as though he'd come on for the run: he was handy enough but just got outpaced before staying on at the one pace. The quick ground is an unknown but he was a dual Group 1 winners as a two-year-old (both in France, both very soft going).
Less exposed but more left field and with more to find is Talk Of New York, a four-time raced triple winner. Having started with a five length romp at Kempton he fell slightly short when taking on the Jumeirah 2000 Guineas in Meydan in late February. After that came a three-length score at Newmarket in conditions company before an impressive five length rout in the Heron Stakes, Listed, at Sandown nigh on three weeks ago. That was a progressive effort and, like the favourite, he's got more scope than the rest to again step forward; but perhaps that's fully reflected in current quotes of 9/2.
As a 2yo G1 winner Power Blue deserves a mention. He could be ridden from the front in a race where, unless Puerto Rico is sent on for Ballydoyle, there would be no obvious pace contention; and, with that sprint speed in his corner, he might offer a run for tiny stakes on this turning track - but it's still a very long climb to the line when the fuel gauge is in the red zone.
It'll be a nice day out for the new training partnership of Ismail Mohammed and Jose Santos with their lad, Lord Britain.
Suggestion: I think it's very likely that Bow Echo reasserts his class, but if there's a bet it might be a small 'without the favourite' stab at Puerto Rico whose juvenile form was close to Gstaad's and better than Bow Echo's.
Try Puerto Rico without the favourite for pennies, or perhaps a Bow Echo/Puerto Rico forecast (pays 10.8 with bet365 as I write).
Tix Pointers: Ten of the last 13 winners returned first or second favourite. Of the remaining three, two were third choice, and the jolly was placed behind 10/1 Circus Maximus in 2019.
5.00 THE ASCOT STAKES (CLASS 2) (Heritage Handicap) (GBBPLUS RACE)
Presented by Sam Darby
I do love these extreme distance handicaps, even if they are arguably just as unpredictable as races over the minimum trip.
Before I get stuck into the form, we need to have a look at possible draw and pace angles. At the very least they should tell us which horses are most/least likely to be favoured, even if the data can’t be used to completely rule anything out.
The quick takeaway from the above is that early leaders tend to not do brilliantly (judging by the PRB of 0.36) whilst there isn’t much between the other run styles. As for this particular race, it looks unlikely to be a gruelling contest with very little early pace on offer. Ismahane is pretty much the only front runner or prominent racer in the field, so I can see this being steadily run and tactical. That’s not only bad news for those likely to be dropped out early on (and there are a few of those), but I can also see this being an extremely rough race turning for home. A steady pace means a very well grouped field and there are sure to be plenty of hard luck stories, especially with those that get locked in on the rail. That brings me on to the draw data here.
These races are rare, so there isn’t a massive sample size, but the data point towards higher draws being slightly disadvantaged - not a great shock over such a distance on a round course. Perhaps the most telling insight comes from the draw and pace combination data. Again, it's not a huge sample size but it looks as though non extreme rides are great for low drawn runners and patient rides are best for those drawn middle to high. Given the likely pace set up for this race, I’m not massively keen on those likely to be held up so a low draw and prominent ride might be the recipe for success. As for the form book, in a ‘fair’ race the two I’d be most interested in would be Reaching High and Beylerbeyi. Reaching High was well backed for this last year but he never got any sort of run at any stage and he was one of the most unlucky horses at the meeting. He hasn’t run since, so it’s pretty evident he’s been put away to win this race off the same mark. I have two issues with him, though, and they are his price (around 9/4) and, related, the chance he’s unlucky once again. I’d be getting him prominent from stall 8 to give him the best possible chance but I think you’ll find more likely winners at this price at the likes of Ripon and Hamilton this week, so I wouldn't be interested in backing him just to try to get a Royal Ascot winner at any cost. As for Beylerbeyi, you only need to watch his winter runs on the all weather over inadequate trips, off this sort of mark, to know he’s a well handicapped horse. My worry with him is that he’ll be dropped out from stall 16 and he wants a decent gallop to aim at, which might leave him inconvenienced here. He’s halved in price since the final decs and whilst he’s another possible winner, I think the likely disadvantage provided by the run of the race is enough to make me reluctantly overlook him. Simply put, I want a horse who might be able to pinch a bit of an advantage. It’s not easy to predict what will slot in behind Ismahane, the likely front runner, but Kizlyar and Glenroyal may be seen to best effect. Kizlyar won a relatively uncompetitive race in Ireland last time out, but the 2nd and 3rd have finished 2nd and 1st since. He doesn’t have too many ground question marks (often a worry for some of the Irish runners in this) and seems to have a nice mix of speed and stamina. If you can throw out a poor run at Galway last year when turned out again within 24 hours of winning, Glenroyal has effectively won his last three races on the flat. He’s got quite a bit to prove in terms of stamina in the form book, but he’s a full brother to an Irish Cesarewitch winner and a half brother to a winner of this race and it should aid his chance if this becomes a relative speed test for the trip. I think it’s impossible to be confident about the Ascot Stakes as a betting race, but in terms of value I’d be backing Kizlyar at around 16/1 and Glenroyal at around 20/1 (both win only, there are enough question marks to put me off the place market). Reaching High has a really obvious chance, especially if able to get a good early position, and I’ll be kicking myself if Beylerbeyi wins but I just can’t back him in this sadly.
Suggestion: Split a point between 14/1 Kizlyar and 16/1 Glenroyal.
Tix Pointers: In 2015 and 2017 Ryan rode the winner for Willie - both returned fav. No other market leader has won since 2002!
Nine of the 13 winners were aged 6+, though placed percentages are a lot more evenly spread.
Willie hasn't won since 2018, and Ian Willie-ams (sorry) has claimed two prizes since then. Williams and Alan King (as well as the unrepresented this year Hughie Morrison) are the UK trainers on which to focus. Joseph O'Brien ran one (unplaced) in the 2024 Ascot Stakes; five (including 2nd 16/1, 3rd 33/1 and 4th 25/1) last year; and saddles seven this time!
Nevertheless, the worst market rank performance in the past decade was a fourth choice making the frame... until last year when the result was 20/1, 16/1 (6th fav), 33/1, 25/1 - as mentioned three of which were Joseph's, though that doesn't help much this year.
Run as a handicap until 2017, the Wolferton is one of the trappier races at the Royal meeting. Two years ago, Israr won and returned 11/4 favourite; he was the first since Mahsoob in 2015 and, therefore, the first of the non-handicap era. Roger Varian has two wins since 2020 and John (now with son Thady) Gosden has enjoyed five wins and five places from 21 starters. Both are represented this year.
The specific race conditions - that no horse shall have won a G1 or G2 since at least the previous August - makes it one of the few races not for progressive animals; that of course makes it more inscrutable, not less.
Although horses have won from very wide, five of the eight non-handicap winners were drawn 7 or lower. As the PRB3 (average percent of rivals beaten of a stall and its immediate neighbours) chart clearly outlines, inside is better all other things equal.
One thing I did notice when reviewing the run style of placed horses will probably become apparent to you when I share the following string: MMHMMMMHMLMPMMMMMMPHMHMLMPPMMPMM
All eight winners raced midfield and, as you can see, most of the placed horses did, too. The inference, borne out by the victors' odds and doubtless painful memory, too, if you habitually play this race, is that hard luck stories abound and it is very often the best trip that wins. That, clearly, makes life difficult.
Roger runs Enfjaar, a six-year-old with limited mileage. This lad ran fourth in the race last year when enduring a troubled passage from an inside stall. Trap seven is fine and, though he's older than probably ideal, this will have been a clear plan and he comes here off a lovely prep in a similar grade at Goodwood four weeks ago.
The Gosdens run Nahraan, unbeaten in three UK starts and third in a Group 3 in France last September. He lacks a run this season, which is a small negative, but the team know what they're doing (duh) so he can be expected to be plenty fit enough. I'm far from convinced by his form, however, for all that he retains obvious upside.
Last year's winner, Haatem, has an obvious chance again. Drawn 2, we know conditions suit and he backed up his Wolferton score with a good third in the Summer Mile over a trip shy of optimal. Given what looked an obvious sighter in the same Goodwood race contested by Enfjaar last time, he's a Wathnan wunner with weal pwospects.
Another string to the Wathnan Wolferton (enough with the W alliter-wation alweady!) bow is King's Gambit, third in the race a year ago. He ran a nice race from an unpromising position at Newmarket on his '26 debut before blowing out completely at Chester three weeks later. That was a too bad to be true effort but his typically held up run style may be suboptimal with so many mid-pack runners with gear changes ahead of him. No better man than Jamie for this gig, for all that the straight track is his muse.
Charlie saddles a couple at prices that look the types to be competitive in a race like this. The first is Ancient Wisdom, who will don first time cheekpieces in his quest to convert some consistent Pattern level form into a win. He'd probably prefer a bit more juice in the ground though he did win his novice on good to firm back in 2023. He's run 222 at ten furlongs, in G2, Listed and G3 company, and he'll probably settle midfield and hope for the gaps from stall 3. Billy Loughnane will be steering.
William Buick opts for Arabian Light, fourth in the Brigadier Gerard (G3) on his UK seasonal debut. He ran on well there having never been put in the race after missing the kick, and does have some solid upgrade figures to get him out of any pockets after the home turn.
The filly Survie is interesting. Although there are plenty of options for her sex, connections have opted to take on the fellas and Ryan will ride for connections of connections (Mrs Doreen Tabor, no less). She - Survie, not Mrs Tabor - has been mixing it in the best company: in the past twelve months she's run third in the Pretty Polly, second in the Prix Jean Romanet, fourth in the Prix Vermeille and third in the Neom Turf Cup in Saudi Arabia - all of those Group 1 races.
This is a sizeable step down then, though she was a well beaten third in the Dahlia Stakes at Newmarket when last seen. There was also a stable switch at the turn of the year - from Nicolas Clement to George Boughey - and this former G2 winner and multi-G1 placer has a class edge if she's, erm, man enough against males. There is a slight question mark about the ground, too; her best form is with some cut and that last day clunk was on similarly good to firm terrain as she'll encounter here. If not for that, I'd have fancied her chances.
It pays to respect anything Francis-Henri Graffard brings over, but Map Of Stars has looked decidedly out of sorts since running well in the Group 1 Prince Of Wales's Stakes over the same course and distance at last year's Royal meeting. Similar respect comments apply to Joseph O'Brien runners - he seems to be operating at another level this campaign - but his pair have car parked in 14 and 15 of 16 which greatly tempers enthusiasm.
I'm not seeing the case for making Wimbledon Hawkeye a single figure price even if it was a badly needed prep race last time. It could be argued that his best form is over ten furlongs on quick ground, so there's that; but it's not easy to see him reversing Sandown form with Arabian Light, particularly from stall 13. Not without a chance but looks short enough to my eye.
Ditto Ghostwriter, making his debut for Kevin Philippart de Foy and his first run since last year's Royal Ascot when he was third in the Hardwicke (1m4f G2). He has back class and this looks his trip, but it'll be a heck of a training performance after 360 days off the course.
Suggestion: As you'll have gathered it's a messy old race. I'm going to split a small stake three ways: I do quite like Arabian Light (20/1 Coral) and expect he'll step considerably forward from his prep run. I also feel like Enfjaar (12/1 Coral) has a chance to redeem a difficult transit a year prior, and I can't resist a tiny bit on Survie (14/1 Hills) despite the going concerns. Very far from confident with any of those, it should be said.
Tix Pointers: Only two winning favourites and one second pick since 2013.
However, nine and a half jollies have hit the frame, the wrong joint fav for placepot purposes placing in 2024.
They were joined by two second picks, a third choice and two fourth in. Probably still need to spread out a little in the 'lucky last'...
6.10 THE COPPER HORSE STAKES (CLASS 2) (Handicap) (GBBPLUS RACE)
Presented by David Massey
When I watched Klassleader beat Sing Us A Song in the Race To The Ebor Jorvik Handicap at York last month I was convinced I’d seen a very strong piece of handicap form, much as I had when I witnessed Merchant winning a similarly competitive York handicap the season before. William Haggas loves sending these potential blots to York - we saw another at the weekend with Extremely Zain - and the form from those races almost always works out well.
So whilst we aren’t seeing Klassleader here (and I'd not be shocked if his next outing was in Group company) we do get Sing Us A Song, and I make him the one to beat. He needed his first run of the season at Epsom when third to Night Breeze in the Metropolitan, the track possibly not suiting him either, and showed the benefits of that when going to York last month. He made a lot of the running there, doing plenty of the donkey work and never given a moment’s peace from Will Scarlet on the front; when you think that, at the line, Will Scarlet was some 17 lengths behind Sing Us A Song, it shows what an excellent shift the latter put in. He’s probably been beaten by a very good horse and the 2lb rise he got for that looks lenient to my eyes. James McDonald takes the ride here.
That’s because James Doyle jumps Wathnan ship to their other contender, Valiancy, who is the Haggas representative. He did nothing but improve as a 3yo, and started this season on the right foot, successful over 13f at Hamilton and barely coming off the bridle to win. He was put up 8lb for that, which looks fair, but if you think James Doyle never chooses the wrong Wathnan one, you only have to go back a year to recall Fallen Angel finishing third to Crimson Advocate in the Duke Of Cambridge to find some evidence of that. McDonald was the beneficiary that day so, with apologies to the Doyler, here’s hoping history repeats itself…
I will be having a saver - and a reverse forecast - with Daiquiri Bay though, because if he wins, having convinced myself there’s a big 14f handicap in him for over a year now, it might just ruin my week. I somewhat fell for him after he won at Chester last year, amazed that one his size was able to handle the Roodee's tight turns as well as he did, and when he turned up in the King George V Stakes here last year, was sure he was going to run a big race. Eighth doesn’t tell you how well he actually ran, the trip just looking on the short side, and a third in the Melrose at York later in the season backed up that impression.
Gelded last autumn, he came back to run a career best when beating Gamrai at Newmarket over a mile and a half in May, stamina once again looking his long suit, and I feel a step up to this trip can only be a plus point. A real trier, which is always half the battle, he’ll have his conditions and can go well.
Suggestion: Back Sing Us A Song at 17/2, and/or Daiquiri Bay at 7/1. Maybe even try a small stakes reverse forecast.
https://www.geegeez.co.uk/wp-content/uploads/2017/06/royalascot2017_gates.jpg320830Matt Bisognohttps://www.geegeez.co.uk/wp-content/uploads/2022/10/geegeez_banner_new_170x78.pngMatt Bisogno2026-06-15 12:37:042026-06-16 13:00:56Royal Ascot 2026: Day One Preview, Tips
geegeez.co.uk uses cookies to improve your experience. We assume that's OK, but you may opt-out from the settings. Cookie settingsACCEPT
Privacy & Cookies Policy
Privacy Overview
This website uses cookies to improve your experience while you navigate through the website. Out of these cookies, the cookies that are categorized as necessary are stored on your browser as they are essential for the working of basic functionalities of the website. We also use third-party cookies that help us analyze and understand how you use this website. These cookies will be stored in your browser only with your consent. You also have the option to opt-out of these cookies. But opting out of some of these cookies may have an effect on your browsing experience.
Necessary cookies are absolutely essential for the website to function properly. This category only includes cookies that ensures basic functionalities and security features of the website. These cookies do not store any personal information.
Any cookies that may not be particularly necessary for the website to function and is used specifically to collect user personal data via analytics, ads, other embedded contents are termed as non-necessary cookies. It is mandatory to procure user consent prior to running these cookies on your website.