Welcome to the first article of a new series where I will be looking at run style bias at individual all weather tracks, writes Dave Renham. All weather racing is now a ‘staple’ of our winter racing diet and there will be plenty of betting opportunities, starting today, in the coming months for punters at all of the six British courses, as well as Dundalk which I'll not be covering. For this series of articles, I will also not investigate Southwell as they changed the surface from fibresand to tapeta from 7th December 2021.
To view other all-weather track run style biases, choose from the below:
Chelmsford Racecourse Run Style Bias
Kempton Park Racecourse (AW) Run Style Bias
Lingfield Racecourse (AW) Run Style Bias
Newcastle Racecourse (AW) Run Style Bias
Wolverhampton Racecourse Run Style Bias
What I mean by run style is the position a horse takes early in the race, normally within the first furlong, which often defines its running preference. geegeez.co.uk has created some powerful resources to look at run style in the Tools menu tab. There is the Pace Analyser and the Query Tool which can be used to undertake this type of research for yourself. Running style is often linked with pace because the early pace shown by horses in a race determines their early position. Hence, for many, the words run style and pace are interchangeable.
The stats I am sharing here are based on the site’s pace / run style data. These data on Geegeez are split into four sections – Led (4), Prominent (3), Mid Division (2) and Held Up (1). The number in brackets is the score assigned to each section. The numbers are really helpful as you can drill down into them to help build a better picture and understanding of how important run style can be.
Below is a basic breakdown of which type of horse fits which type of run style profile:
Led – horses that lead early, horses that dispute the early lead. I refer to the early leader as the front runner;

Prominent – horses that lie up close to the pace just behind the leader(s);
Mid Division – horses that race mid pack or just behind the mid-point;
Held up – horses that are held up at, or near the back of the field.
Chelmsford City Racecourse is the first all-weather track under the microscope. I will be looking at individual distances with the focus being 8+ runner handicaps. The data have been taken from 1st January 2016 up until 30th September 2021, five years and nine months' worth.
Chelmsford 5 furlong Run Style Bias
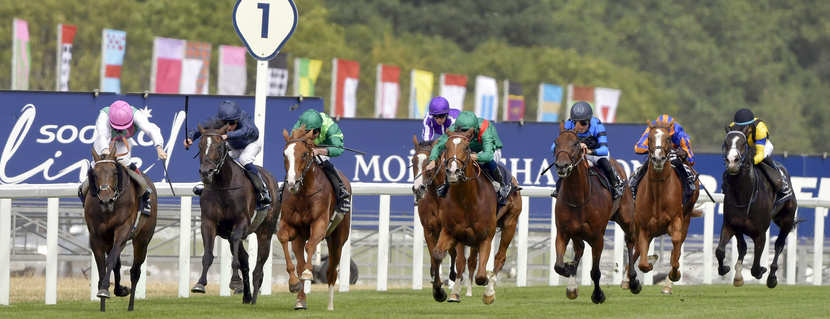
We'll start with a look at the minimum trip where the race start is close to the bend (see image at the top of this post). Let us look at the run style (pace) figures:

These figures clearly illustrate that the advantage is to horses that have led, or disputed the lead, in Chelmsford 5f handicaps. Horses that have race mid-division or further back early have a relatively poor record, both in win terms and profitability. As the shortest race distance, 5f races allow the least amount of time for runners to make their challenge from the back. Hence at most courses, both all weather and turf and especially around a turn, there is a strong front-running bias.
The success of front runners has been fairly consistent as the graph below shows; here I have looked at the winning strike rates (SR%) of front runners split into two year groupings (2016-2018 and 2019 to Sept 30th 2021).

As you can see there has been a similar front running performance in terms of strike rate: marginally better between 2016 and 2018 but probably not statistically significant. The A/E values correlate in the same way:

Again these were slightly higher in the 2016 to 2018 period (1.69), compared with an A/E value of 1.57 over the past three years. One might expect that market edge to erode further in coming years but there still appears plenty of 'juice' for now.
The draw for front runners does not seem to make too much difference – interestingly it is not the very low drawn front runners who have secured the highest strike rate, it is those drawn 5 to 7. In truth though, individual stall data provide a relatively small sample size so we should not read too much into them.
It is also interesting to look at the performance of front runners in terms of their market rank (position in the betting).

As we can see, front runners who are favourites have won more than half of their races. In general, horses that are relatively unfancied (those 7th or higher in the betting market) have been unable to retain their early lead. This of course makes sense, but it shows that it is something we need to factor in if we are thinking about backing a potential front runner: race position is best when coupled with some kind of ability, as predicted by the betting markets!
While digging into market factors I noticed that front runners that were priced 5/1 or less won 24 times from 59 races. This equates to a strike rate over 40%. Not only that, a further 20 placed giving an impressive win & placed percentage figure of 74.6%.
Now you might be reading this thinking that OK, we’d expect this type of market bias. However, let me share the data of 5f handicap favourites at Chelmsford with you across all running styles:

Looking at this, do you want to be backing a favourite that is likely to be held up? Or even one that is projected to race mid-division? Naturally, we cannot 100% predict what run style a horse will show in any one race - and sometimes horses miss the break or adopt a surprising tactic - but most tend to conform to a favoured style which helps steer us in the right direction.
Finally in this 5f section I’d like to split the data down further by number of runners – specifically, races with 8 or 9 runners compared with races of 10 or more runners. Here are the relevant A/E value comparisons for each running style:

It seems that bigger fields give front runners a slightly stronger edge and hinders hold up horses even more.
Chelmsford 6 furlong Run Style Bias
Moving up a furlong to the second sprint trip of 6f at Chelmsford, where they have a longer run to the turn, let us look at the run style (pace) figures:

The front running bias is not as strong over this extra furlong but it remains fairly significant. As with five furlong handicaps, the nearer you are to the early pace the better.
The bias has remained relatively consistent since 2016 and the average SR% for front runners over the past two seasons has been 19% (slightly above the 6-year average). Draw wise, front runners are again able to win from low, middle or high – there is no clear draw/pace angle here.
Looking at market rank there is also a similar pattern to the 5f data. Front runners from the top three in the betting have provided 36 wins from 114 runners (SR 31.58%); the rest of the betting market has provided 14 wins from 187 (SR 7.49%). Comparing the A/E values we can see there is much more value in front runners who come from the top three in the betting:

It is rare to talk about shorter priced runners being ‘value’ but these front runners seem to be.
Looking again solely at the overall performance of favourites by run style, we can see that front running favourites outperform every other type of favourite in terms of run style:

The bias to front running favourites is far less potent than it was over 5f, but nonetheless if you were the owner of the jolly and your horse was sufficiently versatile, which run style would you like the jockey to try and deploy? It’s still a no brainer when front running favourites are 1.67 times more likely to win compared to held up favourites.
As I did earlier with the 5f data I am going to split the 6f data down by number of runners, comparing races of 8 or 9 runners with races of 10 or more runners. Here are the relevant A/E value comparisons for each running style:

We see a similar pattern here with 10+ runner races strengthening the front-running bias as well as making it harder for hold up horses to be successful.
In general, it's very good to see the 5f and 6f figures correlate so well.
Chelmsford 7 furlong Run Style Bias
Up to 7f now, races at which distance start in a chute and cover the entire back straight before turning for home, and the run style splits for this distance:

Surprisingly perhaps, given the longer run to the turn, the front running bias at Chelmsford is actually stronger over 7f than it is at 6f. This is unusual as at most courses the bias to race leaders diminishes as the distance increases, especially when the distance to a bend is greater. This stronger front running bias is difficult to explain; it might be because the 7f races start from the chute and after the initial jostling for an early position the horses on the early speed are able to slow things down a little once meeting the main part of the course. Sectional timing data could possibly help here; but Chelmsford is the only UK racetrack at which an official timekeeper is not permitted to record such information.
Having said all that, in 2021 front runners have actually really struggled, winning just 1 of 22 races. This is something we need to keep an eye on, but I am guessing (hoping perhaps!) it is simply an anomaly. One stat that backs up my theory is that the placed figures for front runners stands at 44.4% in 2021, which correlates almost perfectly with the overall 6-year front running place percentage of 44.9%.
Over 5f and 6f we saw a stronger front running bias in fields of 10 or more runners. Over 7f there seems little difference. The front running A/E values are 1.45 and 1.40 for 8-9 runners and 10+ runners respectively.
As far as the draw is concerned front runners have again had success regardless of stall position. That said, when the front runner has come from the inside stall (draw 1) they have been particularly successful winning 12 of 41 starts (SR 29.27%).

Now a look at front runners in terms of their market rank. Let’s see if the same pattern emerges that we’ve seen at the two shorter distances:

A slight outlier with front runners who were 6th favourite aside, the same general picture is painted. Front running favourites do extremely well and let us again review the performance of favourites in terms of their specific run style:

The message the numbers continue to hammer home is if you are backing the favourite in a Chelmsford sprint handicap, you really would like it to front run, and you certainly do not want it to be held up.
Chelmsford 1 Mile Run Style Bias
It is rare to see very strong front running biases at distances of a mile or more. Let’s see whether early leaders have an edge over Chelmsford's mile, which starts in a doglegged chute, and if so by how much:

As expected the front running bias is diminishing – you would still prefer to see your horse leading early than rather midfield or near the back, but run style becomes less of a determinant of success. I am not going to delve deeply into this trip because there is little utility, but I will share the record of the favourite combined with running style:

There is not the strong front running bias seen at other trips here but clearly favourites who lead or race close to the pace (prominent) early in the race are much better betting propositions than those who race mid pack or near/at the back. If you had happened to back all favourites that were held up or raced mid division you would have lost 30p in every £ wagered. If you had backed all favourites that raced prominently or led early you would have a tiny overall profit.
Chelmsford Racecourse Pace / Run Style Bias Conclusions
All in all Chelmsford has a strong run style bias across multiple distances with front runners having a clear edge. The 5f trip offers the strongest, closely followed by 7 furlongs and then 6f. This group as a collective can be used as a betting angle, and then overlaid with form considerations.
The bias is still evident over a mile but it is relatively modest.
Let me close with a graph that helps illustrate this neatly: it compares the A/E values for front runners / early leaders (4, blue bars) with those for hold up horses (1, orange bars) across the four distances. The disparity at the shorter trio of distances is stark, where over a mile the gap has been been all but closed.

- DR
Other Recent Posts by This Author:
- The Impact of Last Time Out Run Style
- Combining Pace and SR Ratings, Part 2
- More on Combining Pace and SR Ratings
- A Look at Summer All-Weather Racing
- 3yo+ First Time in a Handicap: An Analysis