
In the next two articles in this series on the draw, I will share what I believe to be the Top Ten current draw biases in the UK and Ireland, writes Dave Renham. In this first half, I will reveal positions 10 down to 6; the follow-up one will examine ‘the top 5’. Of course, I appreciate that there will be people who disagree with my hierarchy, but ultimately all ten biases will be distinct and, with luck, profitable to deploy alongside more traditional form reading. As a bonus, I will also share some ‘near misses’ that just failed to make the top ten.
Now, just because a course and distance has a draw bias, that doesn't necessarily equate to a profit, as I have discussed already in the first two articles. However, having a fuller understanding of any biases does give us an edge over most other punters and enables us to factor this awareness into our wider considerations.
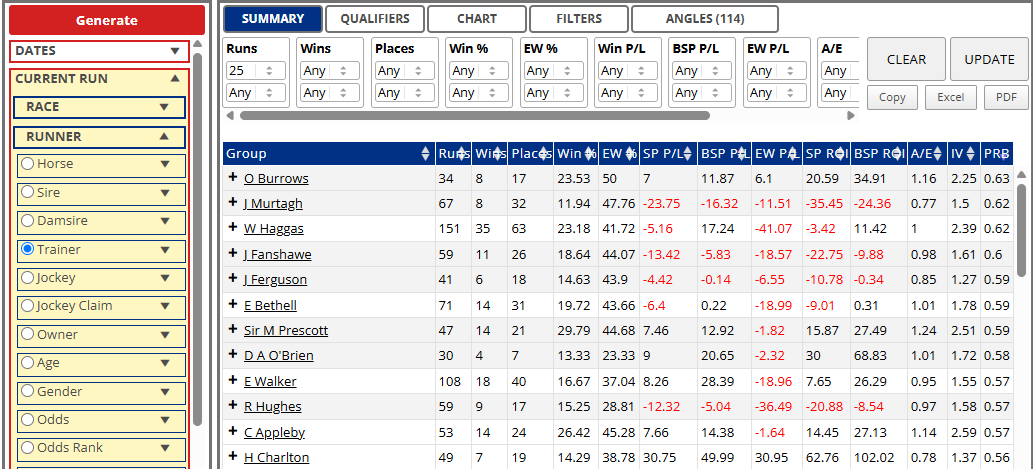
For each entry in the top ten, the plan is to begin by sharing the raw draw stats, and then to drill down into some interesting angles. These may be going considerations or larger field sizes. In all cases, I am looking at draw data from the last six full seasons (2016 to 2021) and, as ever, the initial focus will be 8+ runner handicaps. The profit and loss figures are calculated to industry SP, although where appropriate I will mention Betfair SP figures. With that said, let's begin the countdown...
10th position - Chester 7f
Ahead of the hugely popular May meeting on the Roodee, we go first to Chester and specifically the 7f trip. The draw breakdowns are as follows:

There is a distinct advantage here for those drawn low which may be little surprise given the tight configuration of the track. Lower draws have a definite edge here in terms of win %, placed % and Impact Value. In addition to this the PRB (percentage of rivals beaten) figure of 0.58 for low draws is strong. However, higher draws have actually proved to be the best value of the three sections despite lower draws winning nearly twice as often. Indeed, backing all high drawn horses would have made a profit to BSP to the tune of £48.61 (ROI +39.2%).

So why is this happening? Ultimately, Chester is well known for its low draw bias at various distances and the market naturally adjusts for this. It appears that at this distance it may have over-adjusted. The average SP of the lowest three draws has been 8.29/1; the highest three draws has averaged out at 22/1. This currently looks a case where it may pay to ‘go against the draw’ to find value.
I looked into whether perming lower draws in forecasts, tricasts, exactas or trifectas would have yielded any profit, but to no avail. In terms of possible profit routes, perming the lowest four drawn horses in trifectas came the closest, but would have lost 5% of overall stakes. However, if we had gone back an extra year and included 2015, this trifecta bet would have yielded an 8% profit. Exotic bets like these come with risk and low strike rates, so the odd decent payout can swing the balance.
9th position - Chester 7f 127 yards
This is the longer of two approximately seven furlong trips at Chester. With rail adjustments, from time to time this distance has been extended by up to 37 yards. For the record, when using the Geegeez Draw Analyser the distance to use is 1 mile (because of rounding, and to differentiate it from the flat 7f trip). Here are the raw draw splits:

Low draws once again hold sway as one would expect. However, it is not a profitable avenue backing lower drawn runners. Indeed there are similar losses across the board.
A similar pattern occurs over this ‘extended 7’ as we saw over 7f. Higher draws have proved slightly better value due to their inflated prices. In fact, the three ‘worst’ stalls in terms of the draw (the three highest draws), have combined to make a profit to BSP. They have produced a £34.95 profit to £1 level stakes which equates to returns of just over 21%.
Going back to the initial figures, horses drawn in lowest third of the draw have won 48.2% of all 8+ runner handicap races. This draw bias strengthens when the field size increases as the graph below shows:

There is a clear correlation showing lower draws perform better as the field size increases. Indeed, in handicaps of 12 or more runners the lowest three stalls have combined to produce a profit of £20.31 (ROI +52.1%) to BSP. At last some value it seems in backing lower drawn runners.
Chester’s low draw bias at various distances is clearly well known, and in general it is hard to make those low draws pay. However, in bigger fields over 7½f that might just be possible.
Finally a running style snippet for you: horses drawn low that lead early or race prominently win more than three times as often as all other draw and running style combinations put together.

8th position - Kempton 7f
I'm moving to the all-weather for #8. Kempton Park has a significant number of meetings each year with bundles of 7f handicaps. This gives us an excellent sample size to work with. All qualifying races give the following draw splits:

Horses drawn closest to the inside rail have the edge over middle draws, with middle draws out-performing higher draws. When we look at the individual draw positions we can see that once you get to stall 9 or higher, winning becomes more difficult:

Only horses drawn in stall 6 have proved profitable ‘blind’, which is entirely random; but it should be noted that, at Betfair SP, those drawn in stalls 1, 2 and 3 combined made a loss of just 1% (1p in the £).
The maximum field at Kempton is 14 and if we look at races with 12 or more runners, the bias strengthens:

In these bigger field races the lowest drawn horse, in stall 1, would have made a small 9.5% profit to BSP. Meanwhile, if you had backed the three highest drawn runners in handicaps of 12 or more runners, you would have seen a loss of £257.67 (ROI -50.5%) to SP; if using Betfair SP the figures improve a little but losses are still significant - £182.33 (ROI -35.8%).
There is some good news for those of you who like combining low draws in tricasts or trifectas. There have been 170 races with 12 or more runners at Kempton over 7f in the sample period. During those 170 races, the lowest three drawn horses have filled the first three places on five occasions. Now this may not sound many, just about 3%, but in reality this is quite remarkable given the huge number of possible three-stall combinations in each race. It is too complicated to go into the maths of it all, so let us look at the bottom line figures for perming the three lowest draws in tricasts or trifectas in these 12+ runner handicaps.
Let’s assume we had a 10p combination tricast on the lowest three drawn horses in these 170 races. Our outlay would be 60p per race (6 combinations / lines of 10p) and therefore an overall outlay of £102. Our returns would have been £345.11 giving a clear profit of £243.11. That converts to an ROI of 238.3%! The figures are even better for trifectas as the tote variant of the same bet would have yielded a clear profit of £311.50 (ROI +305.4%). As an aside, perming the three lowest draws in combination exactas would have made a profit too, with a modest but still eminently satisfactory 14% ROI.
From a running style perspective horses that lead early have a definite edge. Horses that race close to the pace (prominent) generally out-perform horses that run in mid-division or are held up. For those drawn in the lowest third here are the win percentages in terms of running style shown:

Leaders fare best and there is a sliding scale back to hold up horses from low draws which performed worst from the inside stalls.
To conclude, when betting at Kempton in 8+ runner handicaps, I would personally ignore horses drawn in stalls 9 or higher unless I could find a compelling reason not to, such as they had the early speed to get near the front (and they did not look to face too much early pace pressure inside). Bottom line: a horse drawn low that has early pace is the ideal type of horse we are looking for.
7th position – York 1m
Way back in the 1990s, York’s mile trip offered a strong draw bias and that remains the case today. As you can see from the racecourse map below, the 1 mile trip has a left turn that starts after about a furlong and a half, and the sweeping bend lasts for just over a furlong.

The result is that high draws can be forced wide, especially in big fields, meaning they have to run further. Alternatively they can take back and tack to the inside but then they will be faced with several horses to pass in the straight potentially needing luck in running. It should be noted that the finishing straight is quite long and therefore poorly positioned horses round the bend do have time to recover, but the draw stats illustrate the problem high stalls still have:

High draws have struggled across all categories, while the lowest draws have the edge over middle berths. In terms of wins, which essentially is key, the draw win percentages for each third can be nicely illustrated by a pie chart:

Nearly half of all 8+ runner handicaps between 2016 and 2021 were won by horses from the lowest third of the draw. Meanwhile, the highest drawn third won around one race in every seven (1 in 6.76 to be absolutely precise). Let's now look at the breakdown of individual stall positions as there are a few interesting patterns:

Firstly I note a cut off point at stall 6. According to the six-year data it is definitely an advantage to be drawn 6 or lower. That sextet of boxes have provided 33 winners from 282 runners (11.7%), while horses drawn 7 or higher have provided just 14 winners from 393 runners (3.6%). What this essentially means is that, since 2016, horses drawn 1 to 6 have been 3.3 times more likely to win than those drawn in stall 7 or higher. Also horses drawn in stalls 4, 5 and 6 have produced good returns to SP with excellent A/E values of 1.15, 1.59 and 1.36 respectively.
There also seems to be a second cut-off point at stall 14. The record of horses drawn 14 or higher has been dire – just 1 win from 111 runners. Backing all 111 runners would have yielded an SP loss of £102.00 – that means for every £10 bet you would lose £9.19. At BSP you would have been 1p better off (loss of £9.18 !!).
Why very wide draws struggle may be explained further by looking at how the stalls are set up at York. The picture below shows the stalls at York in a 20-runner 1 mile race. As can be seen, the stalls are split into blocks of ten which are joined together. In reality an extra two stalls width is added to the middle meaning that horses drawn 11 are effectively 13 stalls from the inside; those drawn 12 are 14 stalls from the inside, and so on.

On average, three to four races a year at York over 1m see fields of 16 or more; there have been 20 races during the period of study with this number of runners from which low draws have secured 12 wins (60%).
Sticking with races of 16 or more runners, there has once again been profit in certain tricast and trifecta perms. Knowing that the lowest six draws dominate these races, what would have happened if we had permed / combined these six stalls in tricasts and trifectas? The problem with six-horse perms, of course, is that there are a lot of combinations: 120 to be precise. Using 10p stakes once again, a combination tricast on the lowest six drawn horses would see an outlay of £12 per race with an overall outlay over the 20 races of £240. There were four winning bets and our returns would have been £361.20 giving a clear profit of £121.20 (ROI +50.5%). Trifecta returns, though, ‘win’ again; they would have yielded a huge profit of £417.72 (ROI +174.1%).
To conclude, York over 1 mile is a potentially playable bias, certainly in terms of narrowing the field down – in big fields I would ignore all horses drawn 14 or bigger. In all handicaps with 8+ runners my main focus would be on horses drawn in stalls 1 to 6.
6th position – Kempton 6f
Back to Kempton for our sixth best draw bias, this time a look at the 6f handicap draw statistics:

With the 7f trip showing a low draw bias, it is no surprise to see the same here. Indeed, this is an even stronger bias over the shorter distance and once more it comes from a large sample of races.
Looking at the win strike rate of individual stall positions the graph below has a clear trend:

As a general rule, win chance decreases as the actual stall position increases. We can see that horses drawn in stalls 1 to 3 have the edge over those drawn 4 to 6, who in turn have the edge over draws 7 to 12. Note that over 6f at Kempton Park, the maximum field size is 12, down from 14 for 7f races.
The placed percentage stats (win and placed combined) correlate extremely well as you can see:

When examining the 7f trip earlier, we saw the bias strengthening as the field size increased. This happens over 6f, too, as we get to near maximum fields (races with 11 or 12 runners):

For those tricast and trifecta fans out there, perming the three lowest drawn horses would have been profitable, although only just. Tricasts would have produced a small 2.6% return; trifectas a bit higher at 5.9%. The big winner from exotic bets would have been if you had backed the three lowest drawn horses in combination forecasts or exactas. If you had chosen the CSF (Computer Straight Forecast) for every £1 wagered it would have returned £1.30; exactas would have returned £1.38. Returns of 30p and 38p in the £ (30 and 38%) are certainly not to be sneezed at, and they occur more regularly than trifectas, too!
The Kempton 6f draw bias is a strong one and looks a playable one. The lowest four stalls always require very close scrutiny.
Finally a quick look at running styles combined with the draw. The heat map below shows the SR% for each draw/running style combination:

Front runners enjoy a good edge regardless of draw, although low drawn front runners are clearly the best of the bunch. Prominent racers from low and middle draws also perform above the norm. It definitely looks worth avoiding any high drawn horse that is likely to race mid pack or towards the back early.
So there we have the lower half of my top ten draw biases, #10 to #6... but I’m not quite finished yet!
Just outside the Top Ten...
Here are some biases that were close to the top 10 but just failed to make the cut.
Redcar 5f-1m (straight course) 14 or more runners
All the biases I have looked at so far have been round course biases, where the lower draws have the edge essentially due to the fact that they are in the best position to take advantage of the shortest route on the inside. But there are a few straight course biases as well, though - as I mentioned in a previous article - they are less prevalent these days due to better course management and watering systems.
At Redcar on the straight course lower draws have generally held sway, more especially when the field sizes get quite big. There is a decent amount of straight course data with 14+ runner fields at Redcar because they race over four trips on it – 5f, 6f, 7f and 1m. Here are the draw splits:

These stats look strong and definitely could have made the top 10 cut. In fact it probably would have done, but while I was doing the research there was a 20-runner race at Redcar early this season that went completely against the low draw bias script. It was a 6f handicap on the 18th April. Here are the first five finishers:

Draw 17 beat draw 19 with draw 16 back in third: three of the five highest stalls filled the first three places. Not only that, look at the prices – 40/1, 50/1 and 66/1. The tricast paid over £30,000! Also draws 13 and 18 filled 4th and 5th with stalls 10 and 12 rounding out the first seven home - all double digit stalls. The best finishing position from a low drawn horse was 8th, Jems Bond, who was beaten 5 lengths.
Now this could have simply been a one-off but, if it was, it is still not easy to explain. This type of occurrence does sometimes happen on straight courses. Some pundits believe it is down to pace bias on the day rather than draw bias. This is difficult to prove one way or the other, but it is certainly possible. What I can say is that this handicap was a very low grade affair (a 0-55) which may have been a factor in what might turn out to be a freak result. Keep your eyes peeled on upcoming big field straight track handicaps at Redcar!
Before moving on to the next course, here are some more six-year stats from 14+ runner handicaps at Redcar on the straight course. It is looking at the PRB figures for each individual distance. To remind you, PRB stands for Percentage of Rivals beaten which is a key measure when looking at draw bias.


A consistency /correlation can be seen across all distances adding confidence in the overall data.
For me, I would just like to see how a couple more big field races this year pan out before completely ‘nailing my colours to the low draws mast’. The six-year data is far more important than the one race on the 18th April but sometimes it is best to be cautious, especially early in the season, because things may have changed over the winter. I know from experience that draw biases can reverse, having seen it happen too many times over the last 30 years. My gut feeling is that low draws will still have the edge in the future, but I have been wrong before.
Brighton 1m (7f 214yds)
I have never really considered Brighton to be a course of draw bias interest but the 1 mile stats are interesting:

There seems to be an edge to high draws with low stalls seemingly at quite a disadvantage. It is not an easy bias to explain when you look at the course map:

Low is on the inside so if there were to be bias here the expectation would be that low draws would be favoured. There is one plausible explanation that Matt suggested to me when we were discussing it. He thought it may be to do with lower drawn horses hanging into the camber against the far rail and not getting a clear run, while those drawn wider either go forward or come wide in the straight thus guaranteeing clear sailing either way. That certainly makes sense and is perhaps the reason for this counter-intuitive bias.
If there is a true bias here then it seems to get stronger in bigger fields, but with a caveat that the sample size is small – below shows the 2016-2021 data with 13 or more runners:

15 races is a very small sample, but it is still statistically unlikely that these figures are completely down to chance. My plan is to keep an eye on Brighton’s mile trip this season in the hope that this ‘bias’ is replicated.
Chelmsford 1m
The final near miss to share in this article (there will more near misses next time) is Chelmsford over 1 mile. We have an excellent sample size here with 277 races:

Here we have a noticeable edge to low in all areas. For the record draws 1, 2 and 4 have all made a ‘blind’ profit to BSP ranging from 9% to 19%, so the bottom four stalls may be worthy of focus (it would make no sense whatsoever to exclude draw 3 simply because it was unprofitable).
When we get to near maximum fields (15+) high draws seem to really struggle albeit from a modest sample:

There have only been 22 races with this many runners, but there is good correlation across all the key ‘markers’.
There is not a similar low draw bias at either 5, 6 or 7f at Chelmsford which begs the question, why? I think the answer can be explained when we examine the racecourse map:

Mile races start from a separate ‘chute’ and thus wider draws have to negotiate an extra bend, which comes up reasonably rapidly, compared with the shorter distances. Therefore, if high drawn runners stay wide early, they will be travelling a greater distance than those hugging the inside. The reason the bias is modest is that wide horses still have around six and a half furlongs to recover from a potentially difficult start. This course and distance seems to be simply a case of low is best, though a higher draw is not insurmountable.
And that's it for the first half of my top ten draw biases (and near misses). Tune in next week for the five most playable biases. Until then...
- DR
Other Recent Posts by This Author:
- Combining Pace and SR Ratings, Part 2
- More on Combining Pace and SR Ratings
- A Look at Summer All-Weather Racing
- 3yo+ First Time in a Handicap: An Analysis
- Royal Ascot 2026: Must Know Betting Angles


Is there any chance these can be put into the individual course info pages for quick reference. thanks
Good idea, Mick. We’ll look to do that once the series is complete.
Matt
Comments are closed.