
As regular readers will be fully aware, I have a huge interest in pace and the potential biases they can create, writes Dave Renham. Hence 2021 kicks off with another article examining this pivotal aspect. The research for this piece has been a bit of a labour of love which began with me collating a huge amount of data while looking for predictive patterns around run style.
Firstly, I highlighted any horse aged four or older, that in the 2019 flat season ran at least ten times in sprint handicaps (5-6f). I wanted to avoid younger horses as they were less likely to have developed a running / pace style. That gave me 303 horses from which to analyse individually. I then took these horses and gathered their individual pace data for each race in which they competed in 2019. This included all of their races, both handicap and non-handicap, and at any distance. Having said that, over 91% of all races were still 5f or 6f sprints with the vast majority handicaps. This totalled roughly 4300 individual pace scores (!) which is a decent sample to study.
To recap, you can get run style data on Geegeez, and this is split into four sections - Led, Prominent, Mid Division and Held Up. Here is a quick explanation of which type of horse fits which type of pace profile:
Led – horses that lead early, usually within the first furlong or so; or horses that dispute or vie for the early lead;
Prominent – horses that lay up close to the pace just behind the leader(s);
Mid Division – horses that race in the middle of the pack but in front of the rear ‘quarter’;
Held up – horses that are held up at, or near, the back of the field.
Geegeez also assigns points in regard to which position they took up early in the race. Leaders get 4, prominent runners 3, horses that ran mid-division 2, and those held up score 1.

My aim with this data crunching was to see how relevant recent pace data is in terms of predicting future pace. I have touched upon this in a couple of previous articles, but I wanted to go into far more detail here. The reason pace prediction interests me so much is that I know that front runners have such a huge edge in sprint handicaps. Indeed, in 2019, if you had been able to predict pre-race the early leader or leaders in 5-6f handicaps in the UK you would made a profit to SP of £5700 to £10 level stakes. That equates to around 35p profit in the £.
At this point it is important to say that we have to be careful how we compare, for instance, last time out (LTO) hold up performances with LTO front running performances; the problem is that in each race there are always more hold up horses than early leaders, so we need to account for that in any comparisons made. Having said that, hopefully how I present the data will make sense and, more importantly, be ‘fair’.
Horses that led early last time out
My first port of call was to look at horses that had led early LTO and to see what running style they showed in their next race. There are two columns in the bar chart which I will explain underneath.

The orange columns show the percentage of horses to show that particular running/pace style in all of the races in this study. Hence leaders accounted for 14% of all runners, prominent racers for around 39% and so on. This is our ‘control group’ data if you like.
The blue columns in the bar chart show the percentage of horses that displayed that particular running/pace style after having led early LTO.
As the blue columns show, LTO leaders are much more likely to lead next time compared with the ‘norm’ (control group data). Just under 35% of LTO leaders led again in their next race. This figure is around two and a half times larger than the overall base figure of 14%, and implies that a LTO running style can be highly significant. In addition, it was noted that more than three quarters, 77%, of last day leaders either led or raced prominently next time compared with only 23% that raced in midfield or in rear.
Horses that were held up early last time out
It is always best to look at the extremes, so I’m moving from LTO front runners to LTO hold up horses.
This next graph is set up in the same way with the orange columns showing the percentage of horses which displayed that particular running/pace style in all races (our control group). The blue columns this time show the percentage of horses that showed that particular running/pace style after been held up LTO.

This picture is almost a complete reverse of our first graph, as one might hope. Over 45% of horses that were held up LTO showed that same running style in their next race. As you can also see it is very rare for LTO hold up horses to lead early next time. Just 4.8%, less than one in twenty, of hold up horses in this exposed handicapper sample have gone on to lead next time out.
I think it is useful to compare the two sets of figures now without the control group data (orange column). So the graph below compares early leaders LTO (in green) with hold up horses LTO (in red), and their subsequent run in terms of pace / running style. It shows the massive difference between the two:

Clearly LTO running style, whether it be a front-running preference or a hold up one, clearly does influence the next run. Indeed, this graph shows us that it is seven times more likely that a horse will lead if it led LTO compared with one that was held up LTO. Likewise, it is around 4.5 times more likely that a horse will be held up if was held up LTO as opposed to one which led last time.
Horses that raced prominently last time out
Moving on to those that raced close to the pace LTO and their subsequent next run. Again I have reinstated the overall ‘control group’ data (orange) as our comparison.

There is a more even looking graph this time, although LTO prominent racers are more likely to race front half of the pack rather than back half in their next race. (Led/Prominent running styles occurred 62.3% in their next race versus Mid Div/Held Up on 37.7%).
Horses that raced mid division last time out
With last day midfield run styles, we also see a more even looking percentage comparison. However, only 9% of horses that raced mid division LTO went onto to lead next time compared with our base figure of 14.1% for all races. This is worth noting on what can be considered a meaningful sample size.

Comparison of LTO data for horses that took the early lead
I’d now like to combine the data for all horses that led early and compare the chance of it occurring in relation to their most recent run style. We have seen this individually on the four orange/blue graphs, but it is useful to see the comparison on just one graph. The figures on the left axis are, as previously, percentage chances of leading.

This neatly shows the importance of the LTO running style in relation to the next race, especially as there is a lovely correlating sliding scale. LTO leaders (LL) led next time more than twice as often as those who raced prominently (PL) last time; and they in turn led nearly twice as often as those that race mid division (ML) last time; and last day midfielders led almost twice as often as those held up (HL) last time.
Comparison of LTO data for horses that were held up
Comparing the hold up horses’ data in the same way, we see the same type of correlation, but in reverse, if you like.

The LTO running style is a key marker yet again. Horses are far more likely to be held up if they were held up LTO (HH). Likewise, horses that raced mid division LTO are more likely to be held up than those that raced prominently LTO. Finally, only about one in ten of LTO leaders are held up in their next race (LH), quite often when they inadvertently miss the break.
Horses that led early in both of their last two starts
I wanted to go a step further and review those horses that had led in both of their previous two races to see which running style they assumed on their next run. Again I will show the comparison with the overall pace data for all races (our control group in orange):

As the graphs indicate (blue bar on the far right), nearly 45% of horses that led in both of their previous two starts led again next time. In fact, fully 86% of them led or raced prominently in that follow up race.
We have already seen that one LTO run in terms of running style/pace is a good indicator of what will happen next time out. This data seems to show that the last two runs combined are an even better indicator (which is what would be hoped, of course). This is hugely significant and shows why you should start to take note of race pace data here on geegeez.co.uk if you haven’t already.
Horses that were held up in both of their last two starts
To the other extreme, and horses that were held up on both of their last two starts. The hypothesis is the reverse of the previous graph with the highest blue bar on left (highest percentage for hold up horses) and the lowest on the right (for leaders). Here are the data:

We see precisely the type of result that we had forecast. Over 57% of horses that were held up off the pace in both of their last two runs were held up again. Just 2.7% of them went onto lead next time out. Again it is useful to compare each individual blue bar with its orange neighbour (the control group). It helps to show that even though more horses raced prominently next time than raced mid division (21% v 19%), in reality prominent racers were well down on their overall figure of 38.7%.
Performance based on pace score of last four runs
For each race on the geegeez.co.uk pace maps, we are presented with the pace figures/running styles for up to the last four UK/Irish races (users may look at the longer-term run styles via the ‘RS’ column in Full Form. The racecard also provides a total of those last four runs. The maximum score is 16 (last four races saw the horse lead each time) while the minimum is 4 (last four races saw the horse held up each time).

In my study I have over 3000 sets of 4 consecutive races for individual horses. Hence this is a huge sample under analysis. In the table below I have collated the percentage chance of a specific running style occurring in conjunction with all of the last 4 race pace totals between 4 and 16 inclusive. Hence we are expecting to see horses that have a pace total of 4 being far more likely to be held up in their next race as compared with hold up horses, for example.
Similarly, horses scoring 16 points in their last 4 runs, we are hoping to see many more leaders next time as compared with hold up horses.
Here is the output:

The figures in the table correlate strongly.
For example, a total pace score of 4 (held up in the last four races) has seen almost two-thirds of these horses being held up again next time. Compare that with a paltry 1.4% of horses that have gone on to lead next time.
At the other end of the scale, horses with a total pace score of 15 or 16 went on to lead in their next race almost 45% of the time, with only one in twenty of them being held up.
This table is a powerful recommendation for using past run style data for the basis of your pace prediction. It is impossible to accurately predict what running style every horse will show in every race but using the Geegeez data gives you a huge advantage over the wagering crowd. If you carefully choose specific races, such as older horse sprint handicaps, this will also increase your chances of successful prediction.
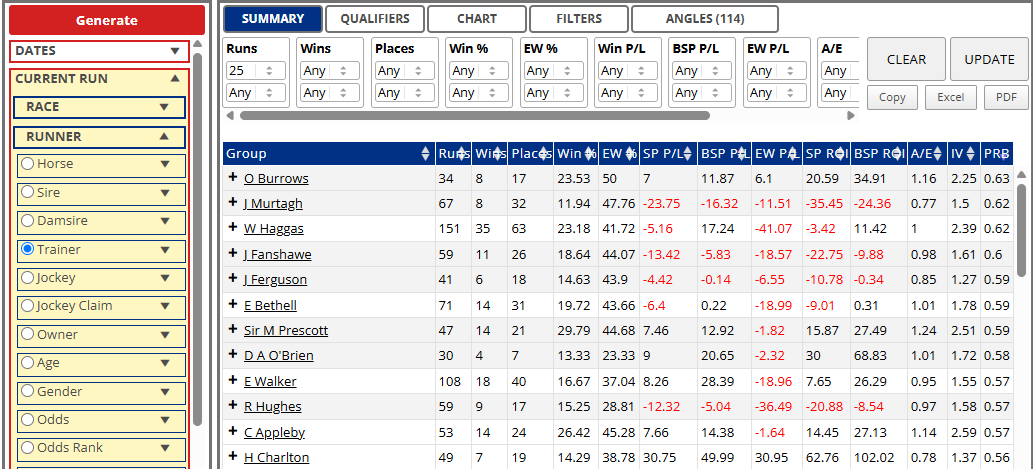
An Example: Pace Edge in Action
To finish, here is the type of race we really want to be looking for:

This was a 6f handicap race at Catterick in October. Only one horse had a pace total in double figures, Dirchill, with a decent score of 14 as well as leading in both of his last two starts.
He was five points clear of the next runner, which is a huge margin, and when examining the last four races of his eight rivals, 27 of those 32 races had seen them display either a hold up style or a midfield one. Also the historical Catterick 6f stats strongly favour pace setters over mid div/hold up types (see the green and red blobs at the top of the image).
The result is shown below:

Dirchill made all the running to score at the tasty odds of 15/2.
Other Recent Posts by This Author:
- Combining Pace and SR Ratings, Part 2
- More on Combining Pace and SR Ratings
- A Look at Summer All-Weather Racing
- 3yo+ First Time in a Handicap: An Analysis
- Royal Ascot 2026: Must Know Betting Angles


Thought-provoking stuff again Dave, thanks for your work to produce it.
I tend to focus on NH handicaps so could do with an AW alternative at this time of year, will definitely look to use your data in the future.
As convincing an argument as you could have for incorporating pace into your selection process….almost makes me want to do maths at your school Dave!
Compelling analysis. Impressive sampling size and this article really does warrant the description “game changer”. I will be looking far more closely at pace in 3yo+ sprint handicaps in future. I’ve always appreciated the importance of pace but never have I seen anything like this in terms of predictive power.
Many thanks, Dave!
Once again another very informative article, very interesting indeed.
Thank you for your efforts Dave.
Thanks for the data Dave. Appreciate all the work involved in producing this and it will def help with defining some angles for the AW meetings while NH season is at the mercy of the weather.
Excellent article Dave. So well researched, as normal. I played small stakes over the last 3 days, since your article and had the following results.:
Tues 7/1 w, L, L,
Wed L, L, L
Thur 12/1 w,
+14 points, Wow, cant be bad
Just looking at the bare form only,
Comments are closed.