
Much has been made of sectional timing in the past 18 months or so, including by me, and it can indeed offer great insight into how races were run. But the challenge for publishers, including here at geegeez.co.uk, is to successfully answer the question, "How do I use sectional timing to inform my betting?". That will be the main focus of this article, but before that a spot of revision.
What Are Sectionals? And why should we care?
I recorded this video a little over a year ago and it is actually very good (I wouldn't normally say that about one of my recordings!) in terms of breaking things down. So, if you prefer to watch/listen rather than read, this is for you. If you prefer to read, scroll beneath the video box...
[Hint: if I speak too slowly for you, click the cog icon bottom right and change the playback speed to something more suitable]
I've written previously in some of my Clock Watcher posts about various terms and concepts related to sectionals, and those can be accessed from here.
The following blog posts are also useful if you want to really understand sectional timing concepts (and I would encourage you to block out a bit of time and work through them). They're here:
Why Sectionals Matter - by Tony Keenan

What Is The Point of Sectional Timing in Horse Racing - by me
An Introduction to Sectional Timing - by Simon Rowlands
Tony's piece is quite high level and a good flavour of the subject; mine is a little lower to the ground but still overview stuff; while Simon's excellent paper is chapter and verse on both the mechanics and some practical applications of sectional data.
**
Understanding Sectional Data Terminology
Let's quickly whizz through some of the key terms and concepts applied to sectional content. First up, what even is a section?
Section
A section is simply a part of a race. A race is a 'section', though given that it is the start-to-finish section it doesn't tell us much about the sub-plots within the narrative. Sections are not quite arbitrary and they can be of varying lengths depending on who/where the intel is coming from.
Here at geegeez.co.uk, we have three different section types: by furlong, call points and OMC.
By furlong, as the name suggests, has a variable number of sections depending on how many furlongs there are in the race; 'call points' breaks a race into five roughly equal chunks; and OMC breaks a race into Opening, Middle and Closing chunks.
Sectionals
Within each section, we can establish the amount of time taken, distance travelled, and position in the race (and lengths behind the leader, or in front), as well as things like stride length and cadence (which are very much for another day).
Once we have, for instance, the sectional time, we can make comparisons: with the same horse in other race sections, with other horses in the race within the same section, and with historical data for races run over the same track and trip.
Sectional percentage
Rather than raw times, e.g. a 12 second furlong, we tend to convert those times into percentages of the overall race time, e.g. the horse completed the five furlong race in 60 seconds and recorded a 12 second furlong in the middle of the race, therefore that sectional percentage was 100% (see image). Do not get unduly hung up on the 'how'!

Finishing speed percentage
Finishing speed percentage is a sectional percentage where the 'to' of the section is the finish. For example, the section might be two furlongs out to the finish. We calculate finishing speed percentage in the same way as we do other sections, and this specific number tells us whether horses were finishing faster or slower than 100%. More pertinently, when compared with 'par', it tells us about the performance against historical standards.
This is important because some courses have, for instance, uphill finishes where the closing section will be slower than it is for level or downhill sections of the same track. Runners in all other races over that course and distance (and indeed other distances at the same course) will have encountered the same topology, allowing for comparisons. [Hopefully that makes sense]
Par
Par in the sectional context is an attempt at defining how much energy (in percentage terms) 'should' be expended in each part of a race based on our understanding of prior truly run races over the same course and distance. What is a truly run race? Good question. It is one where it can reasonably be considered that the leader at each section went close to optimally in terms of efficient use of its energy.
We calculate par not by averages but by a logarithmic scale of race rank percentiles. [Again, these are mechanics, you don't need to know this: I merely share for the more curious!]
In layman's terms, the par percentile in a five-furlong race (where most are truly run, but a fair number are overly fast) will be greater than the par percentile in a mile and a half race, where many more contests are tactical. Specifically, we use the 38th percentile to establish par for five-furlong races at a given track, and the 20th percentile for twelve furlong races.
Par is a line in the sand against which to compare performances in a race.
Enough with the terminology, how do we actually use this stuff?
**
Using Sectionals to Understand the Past, and the Future
As with all form study, sectionals provide historical performance context for today's race: they help us understand what a horse is capable of - and, importantly, what it might have to offer under a slightly more favourable setup/ride. This video outlines some scenarios to mine for and, if you prefer blog posts, beneath the video is a 'words and pictures' version of the same.
Upgrade figures (UP)
Let's look at some examples, starting with a very obvious one originally flagged in this post.
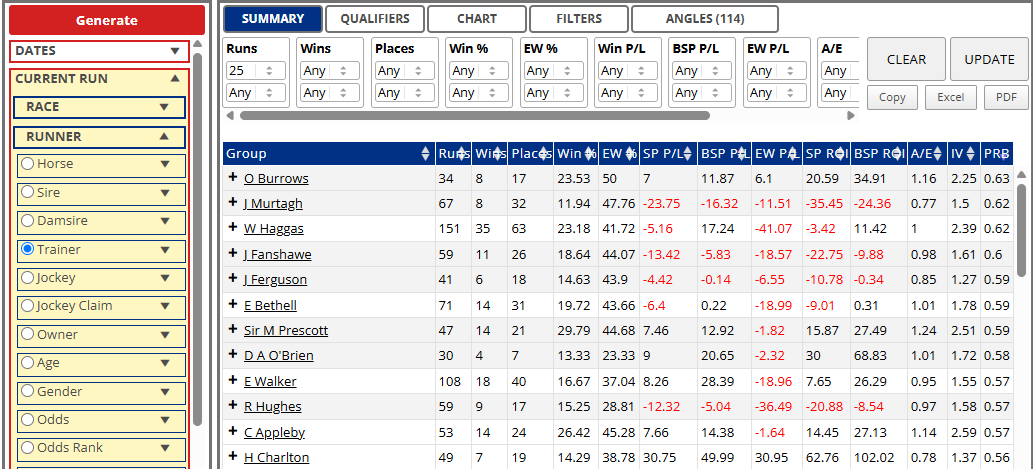
Punchbowl Flyer came into the Wokingham unbeaten in his previous two races and exited that race having finished no better than eighth of 21. But he was first home on his side of the draw and, crucially for this article, had a solid upgrade figure - see the right hand UP column in the image below.

The UP column contains sectional upgrade figures calculated based on finishing speed performance against par. A figure greater than five or so implies a horse may have been compromised by the run of the race and may have more to offer next time.
As we can see (in the middle of the image below), Punchbowl Flyer returned to winning ways just a few days later.

The coloured blobs show how PF raced in the Wokingham based on his time spent in each section: fast (orange), even to fast (yellow), even (green), slow (blue), slower (bluer)! Like many others, though to a greater degree, he went too hard too soon.
The line above the coloured blobs show his 'Future Form': a win at 11/4 in a £10k handicap.
Making a list of upgrade horses is a simple way of highlighting runners who might be ready to win soon.
Here's an example of a little novice sprint at Wolverhampton the other day, where a contested lead meant two horses completely blew each others' prospects:

Both Beauzon and Sidcot Swallet might be worth another chance if looking like getting an easy lead.
Beware the well beaten outsider with a big upgrade figure
Sometimes you'll see a big upgrade against a no-hoper beaten half the track. Remember, the figure is calculating inefficiency, and you'll find a few horses who were ridden inefficiently but who likely would not have been competitive even under an ultra-efficient ride. Here's an example:

Juriste, a 66/1 shot, was beaten 26 lengths in this 1m6f contest. He might be capable of a lot better but the balance of probabilities is that he's flattered by his upgrade figure of 12. As with all form reading, we still have to make subjective judgements along the way, though most are fairly clear-cut.
Big Upgrades in Slowly Run Races
Upgrade figures are NOT speed figures. They are 'inefficiency calculations'. When I was first playing with our UP numbers I tried applying them to a pure speed rating (Topspeed, though that's academic). They didn't really tell me anything, which wasn't a surprise as the two scales (UP and TS) are totally unrelated. But what I did discover, again far from a shock, was that bigger upgrades often occurred when the race was slow early.
That doesn't mean the upgrade figure has less merit; far from it. It is very useful to know, objectively, which horses are capable of producing a notable gear change off a steady gallop if today's race looks like being steadily run.
Fast Finishers
A second 'use case' for sectional data, and kind of a subset of the first one in a way, is identifying horses whose finishing effort was a good deal quicker than the race finishing speed as a whole. We call these fast finishers and they can be easily spotted in a couple of ways, one prescriptive and the other user-definable. Let's start with the easy way...
Easy Fast Finishers
We recently introduced a Fast Finishers report, which flags all of today's (and tomorrow's) runners that produced a finishing speed percentage which bettered the race finishing speed percentage by 2.5% or more. It looks a lot like this:

In this extremely convenient example from yesterday, the top two - based on 'sectional upgrade' (the right hand column, Sec Upg) - were tidy winners, at 3/1 and 5/1 respectively. Coincidentally, they also recorded the two largest finishing speed percentage differentials (FS% Diff). This is not usually the case.
As a side note, FS% Diff is calculated thus: ((Horse FS% / Race FS%) x 100) - 100
Taking the top one: ((105.14 / 98.52) x 100) - 100 =
(1.06719 x 100) - 100 = 106.719 - 100 = 6.719, rounded to 6.72
That's a verbose way of saying it is not Horse FS% - Race FS%!

Bespoke Fast Finishers
But what if you want to find your own performances of merit? Maybe you don't like our arbitrary '2.5% greater than race FS%' cut off. Fair enough. Here's what to do.
Open up the first result for a meeting, then select the 'OMC' and 'Sectionals' options. I also tend to have the 'Comments' open, and usually 'Running Lines' as well:
![]()
Remember to turn sectionals ON on your My Geegeez page in the 'Racecard Options' section. Default display option is 'None'.

OK, with things set up (you only have to do it once), work through the results comparing the race FS% with the runners' FS%'s. Once you find an interesting one, scout the in-running comment (and perhaps the Running Lines as well) to corroborate the numbers. Here's an example from that same Wolverhampton card where a number of beaten horses were compromised by the run of the race:

We're looking specifically at the percentage figure in the closing sectional block. Here, the race closing sectional/finishing speed percentage (3-0) is 103.3%. See the highlighted block top right.
The UP column reveals both fast and slow finishers: Punchbowl Flyer was an example of a slow finisher (did too much too soon) further up this post; and here we can see that all of Parikarma, Risaalaat, Reclaim Victory and, to a lesser degree, Castle Quarter, had too much to do.
Parikarma, whose FS% here was 106.5%, ran over a flat mile at Leicester a couple of days later and finished in similar fashion. She may win soon, perhaps over a slightly longer trip. Those others are all worth noting in their next couple of starts, assuming their general form credentials also stack up. [That is worth re-stating, though it may be quite obvious to some: a horse must have shown it is capable of competing against today's race conditions - or at least not shown it is incapable of competing - in order for any sectional insight to be useful].
**
Sectional timing is a very useful means of understanding what happened in a race. As bettors, we need to be alive to horses capable of stepping forward in finishing position terms after races where they were to some degree compromised. Here at geegeez, we've tried to make the information as usable as possible via both our Fast Finishers report and our Upgrade figures, and I hope in the above you've been inspired to experiment with this data for yourself. If you're not currently a Gold subscriber, you can join us here.
Good luck,
Matt
Other Recent Posts by This Author:
- Query Tool v2 is Finally Here (Very nearly!)
- Royal Ascot 2026: Day Four Preview, Trends, Tips
- Royal Ascot 2026: Day 3 Preview, Trends, Tips
- Royal Ascot 2026: Day 2 Preview, Trends, Tips
- Royal Ascot 2026: Day One Preview, Tips


very good, i dont like just following one horse really as i have to look at the race as a whole and every horse in the race to come up with my decision to bet… which is where these timings would come in handy on the racecard under the previous form , which they do but only for attheraces courses! presume racinguk dont share their data with geegeez?
thanks
Racing TV don’t yet share their data with anyone!
Very much hoping that changes soon.
Matt
How soon could soon be?
I’d like to get to grips with all the AW tracks for this.
We don’t know unfortunately, Andy. With a following wind, in a couple of months. But potentially not until next year. It depends on a lot of things, the first of which is the data being available.
Chelmsford sectionals will not be available as they have no agreement with a timing provider: they’re the sole uk course to be outwith
Matt
Great article Matt, thank you. Not got to grips with sectionals yet but this really makes it easy to understand.
Thanks for this Matt. I’m still struggling with ST and I think what I would find useful is if you give us an example from the FF report and then go into detail of the race its running in. So for example – Star of Valour won its race at the 5:50 Chepstow when you shot this video, but what I would find useful is looking at the 5:50 Chepstow race in detail and giving us a few pointers to figure out whether it has a chance.
Comments are closed.