
Nursery Nuggets: Betting in 2yo Handicaps
Introduction
On 5th July the first of more than two hundred nurseries - 2yo handicaps - programmed for 2018 was staged, at Haydock Park. They are a feature of the second half of the calendar year and, due to the unexposed nature of many of the runners, have often been considered off limits to large swathes of punters.
But nursery handicaps are just like any other group of races: they have distinct characteristics which require a primary focus in certain key areas. Happily, there are plenty of data on which to chew and from which to attempt to draw meaningful inferences.
In this post, I'm going to focus on nurseries since 2014 - four years' worth - and in the UK only. I'll exclude the five races already run in 2018 at time of writing, so we have complete years from 2014 to 2017.
During that time 8618 runners contested 972 races, none of which culminated in a dead heat. There are therefore 972 winners in the sample. Average field size can quickly be calculated as 8.67, meaning plenty of opportunities for each way punters (609 of the 972 races had eight or more runners). Let us try to determine some characteristics which separate the winners from much of the rest of their fields. To do that we'll start with an old adage I heard in my formative punting years, but first some context...
"Back the top weight in 2yo handicaps"
I don't know who first coined this, or why. It is predicated on good sense inasmuch as horses tend to win handicap races in descending order of weight rank. That is, the highest weighted horse wins most often, the second highest weighted horse wins next most often, and so on. But nothing so straightforward was ever missed by the market, meaning backing top weights in handicaps will send you skint quicker than an afternoon playing find the lady on a grubby street corner.
Ignoring those races - amateur riders and the like - where horses are asked to carry in excess of ten stone (the pattern is the same), the below shows the effect of weight carried on win percent in all flat handicaps in UK between 2014 and 2017.

Win strike rate in UK flat handicaps, 2014 to 2017, by weight carried
That is what one might call a pretty robust correlation. More weight equals a greater chance of winning. But here's how that chart looks when expressed as return on investment at starting price...

Return on investment at SP in UK flat handicaps 2014-17, by weight carried
What this basically tells us is that, ignoring the most lightly weighted horses, there is a vague consistency in losses down to around 8-04 (eight stone four pounds). In other words, although more weight equates to more winners, from a betting perspective it amounts to similar losses almost regardless of the equine's impost.
[In the image above, I hovered over a data point merely to illustrate that further intel can be gleaned from these charts; there is no specific relevance of highlighting the 9-13 group of horses].
The above preamble is intended as context for what follows, namely a similar perspective on nursery handicaps. This is how the diffusion of weight affects a horse's chance of winning in such races:

UK nursery handicaps, 2014-17, performance by weight carried [max 9-07]
In the image this time, I've included one of the variables on the left hand side, so you can see I've truncated the weight range at 9-07. This is because there are a handful of runners which carried more than that, some of which won at 100% (i.e. one from one), thus skewing the line.
We can see the trend generally follows the 'all age' flat handicaps superset. Below is the impact of weight on ROI in nursery handicaps, and as can be seen it offers a far less clear picture:

ROI by weight in UK nursery handicaps, 2014-17
Not only do lower weighted horses win less often, they also lose more cash. Meanwhile, at the top end of the weight spectrum, we have a couple of spikes either side of nine stone that creep comfortably north of break even. Of course, in the general sense it's not especially helpful because there's no reason why horses carrying 9-01 should be more profitable than those carrying 9-00: it's just a quirk of the data.
But there is something of an ROI cliff at around the eight stone mark, and horses carrying less weight than that in nurseries can generally be treated with contempt. The reality is that many of them are simply not good enough to ever win such a race, perhaps any race.
Getting back to our "back top weights in nursery handicaps" starting point, the next chart shows win strike rate and return on investment (SP) by weight rank:

Win percent and ROI by weight rank, UK nursery handicaps, 2014-17
Ignoring the obvious outlier (rank #19) with its big priced winner, the blue bars show how win strike rate diminishes as we drop down the weights; and the orange bars show how one would have lost less by sticking to the higher weighted runners.
As interesting as this may (or may not) be, it is academic for those of us looking to butter our bread. As with absolute weight, so weight rank confirms that one will lose money more slowly rather than win money following higher rated, and therefore weighted, horses.
The value of experience in nursery performance
All juveniles intending to run in nursery handicaps must have either won their first two races or run at least three times. In both cases, the lack of racecourse evidence and/or experience can lead to horses improving significantly as they strengthen up and get the hang of things. And, yes, as they are presented with a test for which they might have been bred.
We can examine the bearing this has on nursery handicaps by looking at performance by number of career runs. Here, received wisdom says that a horse's best chance of winning may be when stepping into handicap company for the first time. But the data do not bear that out:

Nursery handicap debutants (0) win at a rate of 10.77%, whereas those having their fourth nursery start or more win 13.1% of the time. Those with intermediate levels of experience win incrementally more. There is then a correlation between amount of handicap experience and an increased win chance. But what of profitability?

Here, an interesting picture begins to emerge, although still somewhat ambiguous. Looking at exchange prices, we can see that not only are those with more nursery experience more likely to win but, unlike those carrying bigger weights, they are also profitable to follow (at exchange prices).
Greater experience in nursery handicaps should be considered a plus for a horse.
The virtue of ratings
Although there are occasional blind spots in the public consciousness such as, arguably, the benefit of experience in nurseries, a better way to get an edge is to create or derive some information not available to the masses. That could be a system, methodology or a set of ratings.
Geegeez Gold publishes Peter May's 'SR' ratings under license and they reveal some interesting things in the context of nursery handicaps. This next chart shows nursery win rate by SR rating rank:

Win strike rate by SR rank, UK nursery handicaps 2014-17
The top rated horse in nursery handicaps in the four year study period won 18.44% of the time for an SP profit of - drumroll please - 0.95 points! While nobody ever went skint taking a profit, an ROI of 0.1% is more for your institutional investors than us profit-minded adrenaline junkies.
But it is a pretty good starting point to look at thing like race distance, weight, going, field size, market rank and class. One needs to be a little careful not to fit the story around the data, but it might be reasonable to assume that shorter distances - and therefore more consistently truly run races - would fare better from a rating perspective (when that rating has both a speed and form element within it). Likewise, perhaps bigger fields should yield better results for the same reason. And, based on earlier conclusions, those carrying more weight may be expected to at least win more often if not show a profit. Finally, perhaps ratings will manifest themselves as a marketable differentiator of class.
SR and Race Distance
Starting with race distance, we get some credence to the 'shorter distances are better' perception, as follows:

Top-rated SR, by race distance, UK nursery handicaps, 2014-2017
The pure sprinters at five furlongs have won almost one in four when top-rated, and have been profitable to back blindly to boot. Indeed, taking all sprint race distances - which I generally classify as seven furlongs or shorter - we see a pleasing hit rate, supported by a solid place strike rate, and a solid ROI:
| Runs | Wins | Places | Win % | EW % | Win PL | EW PL | ROI | A/E | IV |
| 708 | 137 | 288 | 19.4 | 40.7 | 69.66 | 1.64 | 9.84 | 1.02 | 1.73 |
SR and Weight Carried
Next we can see the distribution of top rated nursery runners by weight carried. Top weight in such races is generally allocated 9-07, and it is interesting (though not altogether surprising) to note the strong coincidence of top weight - which equates to top official rating - and top SR rating.
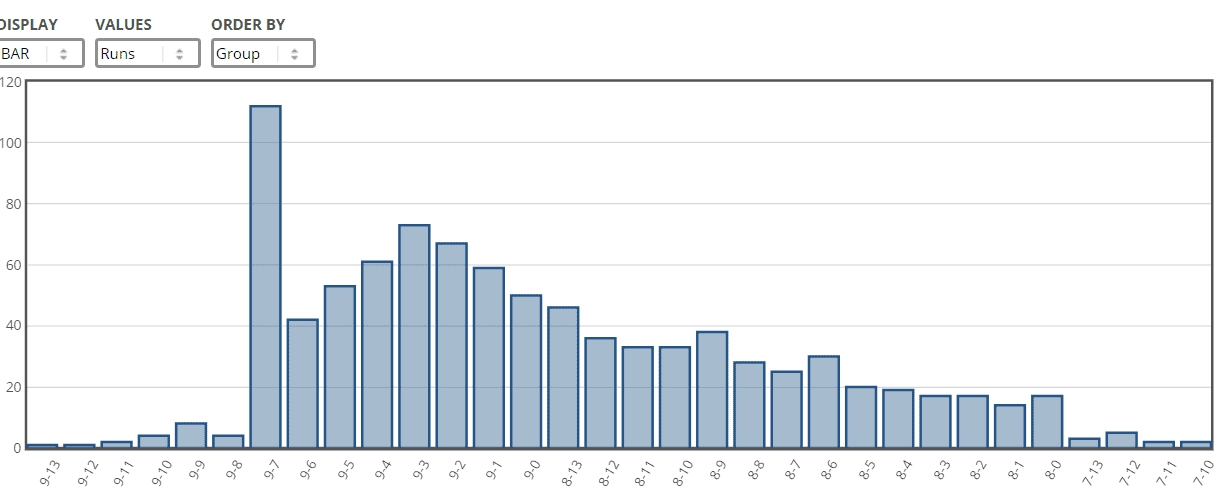
Distribution of top-rated SR nursery runners, by weight, UK 2014-2017
But what of profitability? Here, an interesting anomaly emerges:

Impact of weight carried on top-rated SR horses, UK nursery handicaps 2014-2017
Those 9-07 horses, with their confluence of top public and private ratings, are notably unprofitable to follow. My assumption for this relates to the public element - that is, officially top-rated - and to the aforementioned 'back top weights in nursery handicaps' mantra espoused by so many for so long.
What is more interesting is that immediately below the top rated/top weighted, there is a full stone range in the weights where backing top SR runners yields both a high strike rate and an SP profit. Nevertheless, I'm not entirely comfortable with discounting the top weights: the pursuit of sustainable profit is rooted in sensible logical analysis. Conveniently discounting strands that don't fit is a surefire way to secure disappointing outcomes thereafter!
SR and Going
I struggled with this one a fair bit when I saw the output. Why? Because there is a correlation in the data that looks plausible. But I just cannot find a way to explain it. Here's what I mean:

Top SR in UK nurseries, 2014 to 2017, by going
The firm ground category consists of six runners, of which none won (as you can see from the above), but five were placed! Good to firm and good ground have produced slightly lower win strike rates than slower surfaces but the place strike rates are broadly comparable, leading to my discomfort in 'conveniently' excluding faster turf.
Lawns on the soft side of good or slower, and all weather surfaces, have been highly profitable. I will leave it to the reader to attempt to justify quick turf runner excommunication...
SR and field size
What of field size? My hypothesis is that bigger fields, and therefore more reliably run races, should yield better results, in terms of profit if not strike rate (there obviously being more horses to beat in the latter case). The data don't really support the hypothesis, however:
| Runners | Runs | Wins | Places | Win % | EW % | Win PL | EW PL | ROI | A/E | IV |
| 2-5 | 114 | 39 | 59 | 34.21 | 51.75 | 5.98 | -4.84 | 5.25 | 1.15 | 1.53 |
| 6-8 | 326 | 68 | 142 | 20.86 | 43.56 | 6.87 | -29.74 | 2.11 | 1.06 | 1.47 |
| 9-12 | 364 | 51 | 135 | 14.01 | 37.09 | -6.90 | -56.51 | -1.90 | 0.84 | 1.44 |
| 13+ | 118 | 12 | 33 | 10.17 | 27.97 | -5.00 | -10.37 | -4.24 | 0.84 | 1.46 |
We would of course expect strike rate to diminish as the number of runners increases; but the theory of more truly run races leading to better results for top SR horses holds little water, notwithstanding that all runner groups are within fine margins of break even one side or the other. In short, there's little of positive or negative utility in field size.
SR and class
My premise with regards to class is that the ratings may fare better in better class races; the rationale is that in such races, where many unexposed recent winners or good grade placers lock horns, the winner may be underestimated by the market but not by a private handicap (which is, in essence, what any set of 'unofficial' ratings are).
This time the theory does seem to stand a test.
| Class | Runs | Wins | Places | Win % | EW % | Win PL | EW PL | ROI | A/E | IV |
| 2 | 91 | 16 | 37 | 17.58 | 40.66 | 28.08 | 36.91 | 30.86 | 1.25 | 1.73 |
| 3 | 77 | 19 | 32 | 24.68 | 41.56 | 11.17 | -3.20 | 14.51 | 1.18 | 1.77 |
| 4 | 195 | 42 | 83 | 21.54 | 42.56 | 3.28 | -23.84 | 1.68 | 1.02 | 1.53 |
| 5 | 291 | 52 | 113 | 17.87 | 38.83 | -40.20 | -78.02 | -13.81 | 0.96 | 1.57 |
| 6 | 268 | 41 | 104 | 15.3 | 38.81 | -1.38 | -33.31 | -0.51 | 0.84 | 1.63 |
Without wanting to get too unequivocal, there are some strong looking patterns. Actual versus Expected, a measure of the value proposition (more info here), slides in a linear manner from best class to worst, with Class 2 to 4 offering degrees of positive expectation.
In profit terms, all bar Class 5 have made a surplus at exchange odds, and even the 40 point-losing at SP Class 5 fares close to even at exchange prices. A focus on better races looks a beneficial means of deploying the Peter May SR figures in nurseries.
SR and the market
There are so many ways to slice and dice the dataset, and one more is to overlay market information: odds and / or odds rank.
| Odds | Runs | Wins | Places | Win % | EW % | Win PL | EW PL | ROI | A/E | IV |
| Odds on | 20 | 14 | 16 | 70 | 80 | 3.79 | 2.50 | 18.95 | 1.18 | 3.78 |
| Evs to 2/1 | 100 | 39 | 62 | 39 | 62 | -1.41 | -16.39 | -1.41 | 1 | 2.78 |
| 85/40 to 7/2 | 200 | 59 | 109 | 29.5 | 54.5 | 32.07 | 13.87 | 16.04 | 1.15 | 2.37 |
| 4/1 to 6/1 | 237 | 32 | 88 | 13.5 | 37.13 | -48.50 | -100.73 | -20.46 | 0.8 | 1.25 |
| 13/2 to 10/1 | 213 | 15 | 61 | 7.04 | 28.64 | -77.00 | -118.82 | -36.15 | 0.64 | 0.66 |
| 11/1 to 18/1 | 112 | 9 | 27 | 8.04 | 24.11 | 20.00 | 16.00 | 17.86 | 1.16 | 0.8 |
| 20/1 + | 62 | 4 | 11 | 6.45 | 17.74 | 65.00 | 85.25 | 104.84 | 1.7 | 0.73 |
This is quite interesting, there appear to be three distinct areas: a profitable and high strike rate top of the market; an under-performing mid-market, in both profit and strike rate terms; and a surprisingly robust 'long tail' for those who can suffer losing runs in the pursuit of big winners.
The thirteen winners priced at 11/1 or bigger SP paid an additional 109.94 points at Betfair SP. Even taking out the 50/1 scorer (95 BSP), Celestine Abbey, still leaves 64.94 extra units of profit at BSP. But anyway, if you're backing the rags, why would you exclude the best of them?!
Conclusions / Pulling it all together
From the beginning of July to the end of the calendar year, there is a nursery handicap - or two, or three - almost every day. Knowing how to play the odds specifically for such races is an edge most punters don't bother to look for; and it is one where a few rules of thumb may help separate out a lot of the losing chaff.
The first relates to weight: those horses carrying eight stone or less won less than 5% of the time, and lost a massive 57% of stakes at SP across 356 runners. The story is broadly similar longer term: since 2009, 58 from 1142 were able to win (5.08%) for an ROI of -43.46%. Ouch.
Treat nursery runners carrying eight stone or less with grave suspicion.
In terms of experience, more is definitely better, both in terms of winning chance and profitability. In the four year sample period, it was shown that horses won more often with each additional run in nursery handicaps and, moreover, that with at least two prior nursery starts were profitable to back at exchange prices.
Favour experienced handicappers in nurseries.
So far so generic. But still, using nothing more than a daily paper, you ought to be able to find qualifiers for a system - more than eight stone, more than three prior nursery runs - that has made a profit of 27.46 points at starting price and an enormous 251.9 points at Betfair SP in the four year review period.
How can Geegeez Gold's ratings assist?
We've seen earlier in this article how our SR figures are most effective in shorter races, specifically at up to seven furlongs. Back top rated SR horses carrying more than eight stone at distances of seven furlongs or shorter has yielded 136 winners from 689 runners (19.74%) and a profit at SP of 71.66 points. I don't have the exchange data yet, sadly, but this group includes the two biggest priced winners from the 11/1+ analysis above, those two being worth an additional 51.31 points at Betfair SP. So let's be conservative and call it 150 points profit on 689 bets (21.77% ROI).
I couldn't justify logically leaving those 9-07 top weights out, but if you can, you might be able to replicate the better historical rate of 114 from 585 for 102.67 points at SP. <<< Caveat emptor: you need to be comfortable that there's a legitimate reason to exclude the top weights.
Focus on top-rated SR horses at distances up to and including seven furlongs.
Going was likewise difficult to assimilate: the data say strongly that top-rated SR's perform best on softer than good or all weather surfaces, but there is no obvious reason why faster surfaces should yield lower strike rates and poorer ROI's. Of course, the fact that we geegeez.co.uk licenses the ratings means they are 'black box' to us and, therefore, that we/I cannot discount that there is something in the algorithm to support what those data say. I'm still struggling though...
It may pay to focus on softer turf and all weather...
Those are three solid guiding principles which are worth committing to memory/the notebook:
1. Treat nursery runners carrying eight stone or less with grave suspicion.
2. Favour experienced handicappers in nurseries.
3. Focus on top-rated SR horses at distances up to and including seven furlongs.
For fun, and as something to add to my QT Angles watch list (facility coming soon, I promise!), I'm going to add the following which may make more experienced punters cringe even though I hope I've sufficiently explained/excused/caveated/apologised for each element in what preceded:
- More than eight stone and less than 9-07 (top weight generally)
- Top-rated on SR
- Seven furlongs or shorter
- Softer than good, or all weather
It looks very good, but it may be that the veneer hides something less credible. Please handle with care...
| Year | Runs | Wins | Places | Win % | EW % | Win PL | EW PL | ROI | A/E | IV |
| 2014 | 86 | 16 | 35 | 18.6 | 40.7 | 86.70 | 96.92 | 100.81 | 1.04 | 1.66 |
| 2015 | 107 | 26 | 45 | 24.3 | 42.06 | 6.55 | -2.16 | 6.12 | 1.26 | 2.17 |
| 2016 | 86 | 16 | 34 | 18.6 | 39.53 | 25.16 | 15.42 | 29.26 | 1 | 1.75 |
| 2017 | 114 | 30 | 53 | 26.32 | 46.49 | 40.09 | 36.41 | 35.17 | 1.42 | 2.33 |
ALL |
393 |
88 |
167 |
22.39 |
42.5 |
158.5 |
146.59 |
40.33 |
1.2 |
2.02 |
I will personally also manually check for levels of experience when such runners crop up, as we don't currently have such variables in our Query Tool.
**
Nursery handicaps are a significant part of the flat programme book in the second part of the season, and I hope that the above has offered a few morsels worthy of consideration when playing such races.
Good luck!
Matt
p.s. this post was put together primarily with the aid of Geegeez Gold's Query Tool, which enables users to ask questions of our database and to display the answers to those questions in numerous table or chart output formats. Gold subscribers can try Query Tool here.
Non-Gold subscribers can register a free account here, or sign up for a trial (or renew a previous subscription) here.