Topspeed Ratings in UK National Hunt, Part 1
An analysis of Racing Post’s Topspeed (TS) in UK National Hunt Racing, Part 1
Back in December I wrote a two-part article analysing the performance of the Racing Post Topspeed Ratings (TS) in all-weather (AW) racing, writes Dave Renham. You can catch up with part one here and part two here.
I must admit to being pleasantly surprised by the overall performance of the ratings and so, in this article, I am going to analyse Topspeed in UK National Hunt racing. Hereafter I will use the abbreviation TS in lieu of Topspeed. TS ratings can be found in the Geegeez Racecard and past TS data is now interrogable in the Query Tool, which I have used to research this piece.
Introduction
If you have yet to read the two AW pieces let me explain what the TS ratings are and how they work. First and foremost, they are the Racing Post’s Speed Ratings.
The raw TS figure is a measure of the speed a horse achieved in a particular race. It is amended slightly considering things like distance, weight carried, and the ground conditions.
Essentially, TS is calculated by comparing a horse’s time with a standard time for the same course and distance. The TS figures we see in the Geegeez Racecard are known as "adjusted" TS ratings with the main adjustment made for weight carried in the current race. I believe the TS handicapper also tweaks this adjusted TS rating for the current race conditions. The adjusted TS figures we see in the Racecard are based on a horse's best raw TS performance from the past 12 months. Performances must have occurred in the same ‘Race Code’, so for NH racing, past hurdle race TS raw ratings will be used for hurdle races only, while past chase TS ratings will be used for chases only.
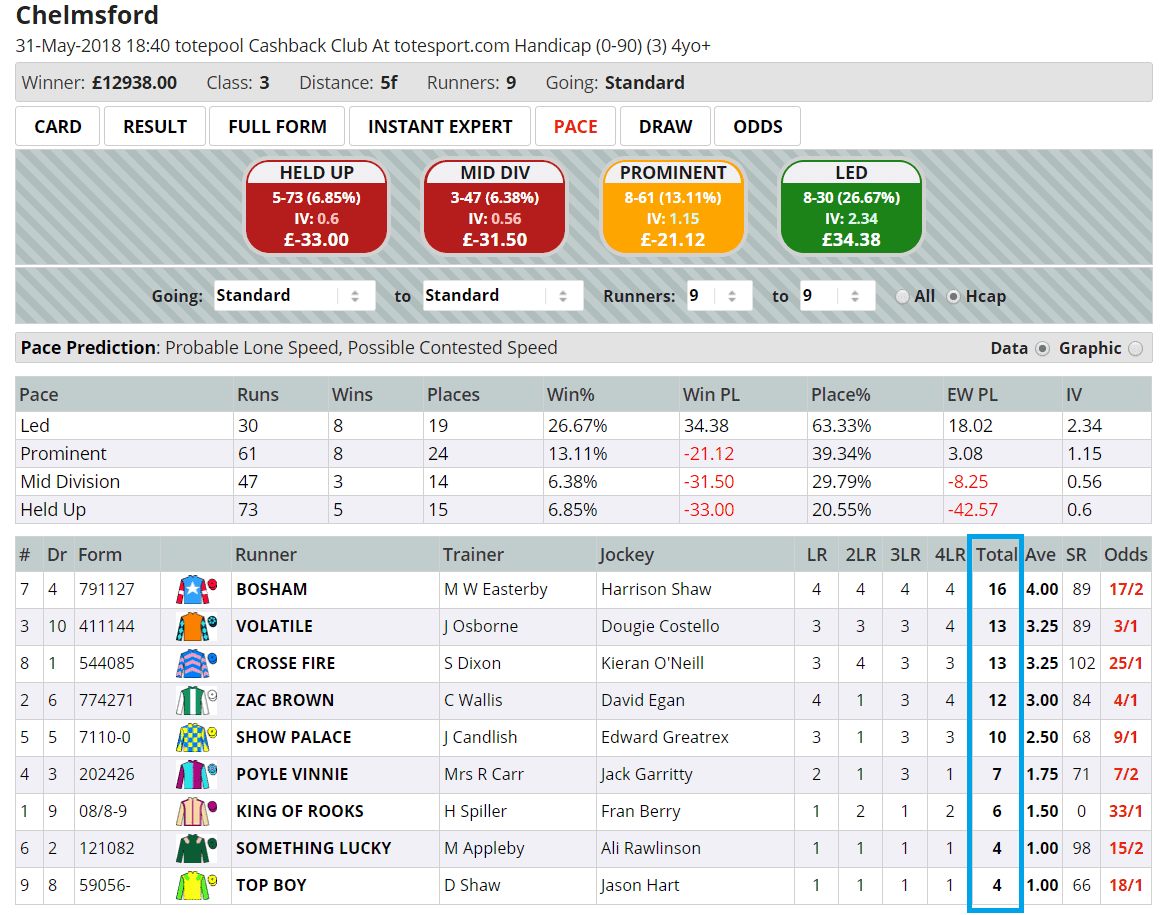
So where do we find the TS figures on a daily basis? In the screenshot below I have highlighted in yellow where the adjusted TS figures can be found on the Geegeez Racecard from a race run on Feb 5th this year:

It should be noted that some races will have a horse or horses that do not have a TS rating. This may be due to the race being their first run in a chase for example, or horses on debut, etc.
My focus for this article, as stated earlier, is UK National Hunt racing and I will be analysing TS figures for these specific race codes (NH Flat, hurdles and chases). I have ignored hunter chases as many of these horses were previously running in point to points, and I am also excluding any NH Flat races run on the AW.
Data have been taken from January 1st, 2019, to December 31st, 2025, with the profit/loss figures being calculated to Betfair SP (BSP) less 2% commission. Like my AW deep dive, this is the first of two articles exploring the results of the Racing Post’s TS ratings.
Strike Rates by TS Rank
Over the years I have talked to numerous figures in the racing world who have compiled their own ratings in the past, be they speed ratings or ability ratings. All of them have stated that in order to judge the effectiveness of their ratings the win rate is key. The top-rated runner should win the most often, the second-rated should have the second highest win rate and so on, gradually reducing for the others. In an ideal world, the top-rated runner would also be the best performer in terms of returns. However, it is important to point out that regardless of how good a set of ratings is, we cannot really expect the top-rated runner to secure a blind profit across thousands of races.
I am going to start by looking at win percentages (strike rates) for different TS rated runners. This covers all qualifying races across the period of study. The horizontal axis is labelled from 1 and stands for the top-rated runner, 2 is the second rated, 3 the third rated and so on:
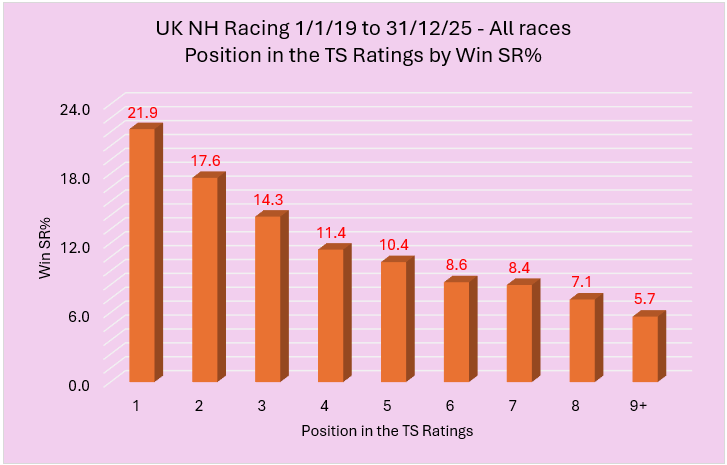
The win strike rate for top-rated runners has been better than one win in every five races which is a decent starting point for any set of ratings. More importantly perhaps, the win percentages have correlated positively with the rated positions showing the sliding scale I was talking about earlier. Hopefully, the same pattern will be replicated as we look at Each Way (win & placed) strike rates. Here are those splits:
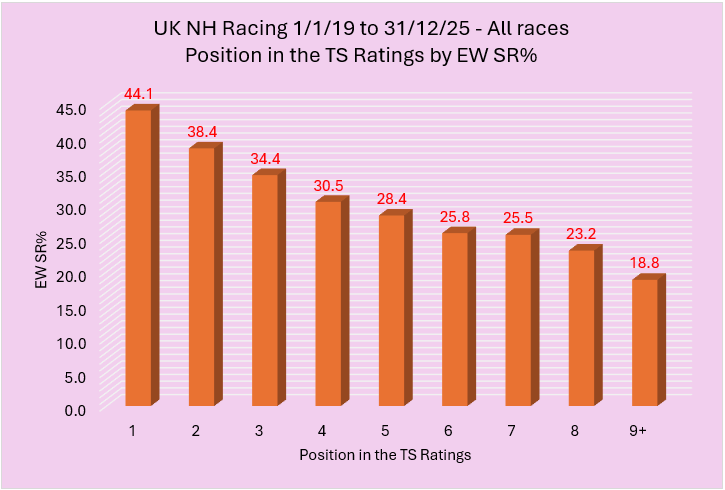
The top-rated runner has achieved the highest percentage once more, and the sliding scale is once again in evidence. These ratings certainly have the right ‘feel’ at this juncture.
Finally for this opening section, let me share the Percentage of Rivals Beaten (PRB) figures. Being able to share these is due to another of the recent Geegeez additions - that of having PRB figures available in the Query Tool Results Summary. Again, the hope is that we see the same type of graph, with the bigger bars on the left and the smaller ones on the right:
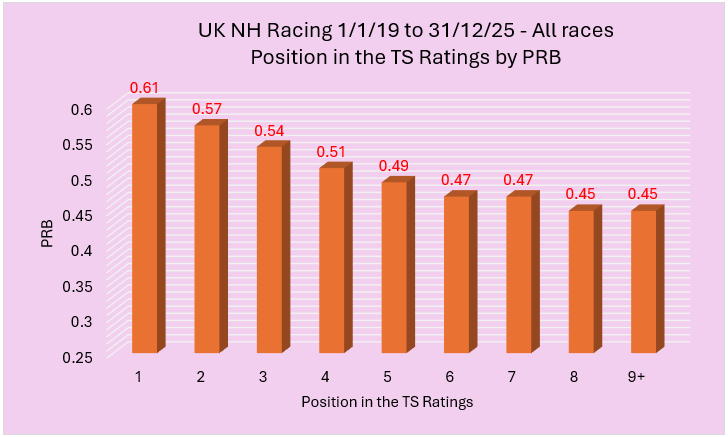
We have the hat-trick in terms of correlation with this graph. Based on the first three sets of data analysed, the TS ratings seem to have been highly accurate at predicting the overall performance of a horse in relation to the TS ranked positions.
TS Top Rated in UK National Hunt
From my initial starting point, having seen the edge for the top-rated runners in terms of win rate, EW rate and PRB, it makes sense to focus on the TS top-rated horses to see if we can find any positive or indeed negative angles to exploit. Below is the record of every single TS top-rated runner since 2019:
![]()
Over 25,000 top-rated runners is a significant sample, and to see a small profit overall is extremely impressive. From here, it is time now to dig a bit deeper.
Annual strike rates – TS top-rated runners
Let me start the digging process by comparing the yearly win strike rates, and the yearly win & placed (Each way) strike rates to see how they matched up. The graph below shows the splits:
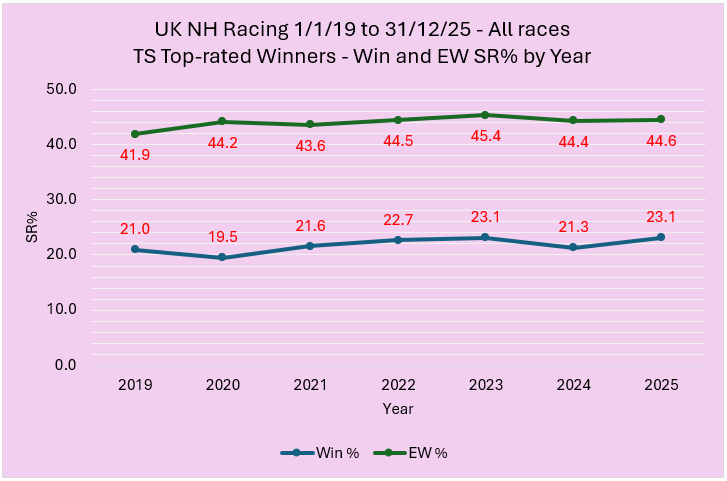
Both lines are relatively straight indicating that the performance of the TS top-rated runners has been consistent from year to year out when it comes to winning and placing. In terms of the PRB figures they have been remarkably consistent, ranging from a low of 0.60 to a high of 0.61.
Market Rank – TS top-rated runners
I would now like to look at the record of the top-rated runners in terms of market position / rank. The market rank is based on traditional SP, that is Industry SP rather than BSP. Profits and losses, however, have still been calculated to BSP:
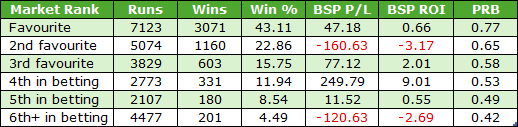
Top-rated runners when favourite have edged into profit, but the overall figures do not really conform to any major pattern. Essentially, all market positions have performed quite well with only second favourite and 6th+ in the betting runners producing losses. In reality though, the losses have been quite small.
TS top-rated favourites by Race Code
Sticking with favourites, let me share how well they have performed across the three different race codes namely chases, hurdles and NH Flat (bumpers):
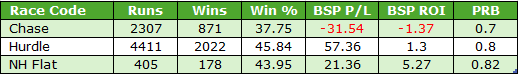
There were much higher win rates for favourites in hurdle and NH Flat races than in chases, and perhaps this has influenced the bottom lines as both are in the black. The record for chasing favourites has still been decent enough considering we are talking over 2000 qualifiers.
TS top-rated favourites by Handicap or Non-Handicap
How about top-rated favourites in terms handicaps versus non-handicaps? The splits were thus:
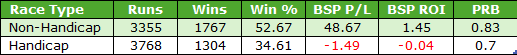
Non-handicap TS top-rated favourites nudged into profit while the handicappers broke even. All findings so far are generating 'good vibes' as far as the TS ratings set is concerned, as each group of results has shown robust consistency.
TS top-rated favourites by Handicap Chase or Handicap Hurdle
The final set of favourite stats I wish to share are the TS top-rated splits in terms of handicap chases versus handicap hurdles. Once again, we see the consistent theme continuing.

We have seen remarkably similar metrics across the board.
Handicaps versus non-handicaps – TS top-rated runners
Reberting to top rated TS runners, regardless of their market rank, I now would like to examine the difference between handicaps and non-handicaps in terms of those top-rated horses. The split was thus:

As we should have expected top-rated non-handicap runners had the better win rate; but both secured a blind profit, albeit only just in the case of the handicappers.
TS Performance by Rating Rank
In the second half of this two-parter I will share more top-rated stats, but for now I want to move away from the top-rated horses and take a quick look at the performance of the second-rated runner. Before I do though, let me share the results for different rated positions across all races:
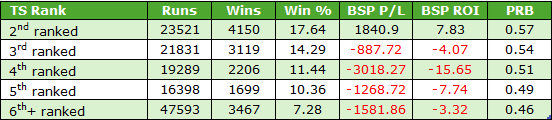
As the table shows, second ranked TS rating runners have secured a significant profit. However, before we get too excited and back these runners blind, let me divide those second-rated runners into two cohorts, one priced 20/1 or longer and the other priced 18/1 or shorter:

Both were in profit, but as we can see the vast majority of the profit came from the longshot bracket. That said, six of the seven years for the 20/1+ group turned a profit as the table below shows:

Strike rates of between 2% and 3% are only for those with titanium constitutions, so here is the breakdown for the shorter priced group (18/1 or less) of TS second-rated runners by year:
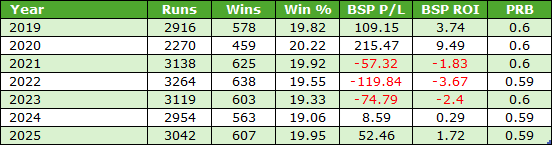
There were four winning years out of seven, and the three losing years were not too bad. Again, we can see excellent consistency in terms of win rates and PRB figures.
2nd Top-Rated Bonus Stats
There are a couple of extra stats worth sharing as regards the second-rated TS runners.
Firstly, when starting favourite, second-rated TS runners have scored just under 38% of the time (1789 wins from 4715) for a sound profit of £200.08 (ROI +4.2%).
Second, focusing on hurdle races only would have seen a return of over 12p in the £ for those positioned second in the TS ratings.
**
For the TS top-rated and second rated to both prove profitable over such a time frame is testament to the quality of the ratings. Next week, in the second article, I will expand on the performance of top-rated TS runners, looking in depth separately at both non-handicap and handicap data. Until then...
- DR