Tag Archive for: Exeter

Uttoxeter 3m Handicap Chases: Deep Dive

3-mile handicap chases at Uttoxeter: a deep dive

Last month, I wrote a piece on 7-furlong handicaps at Kempton, writes Dave Renham. That was the second time I had looked at a specific course and distance in this way. Certain types of races on the all-weather lend themselves to the approach as there are many such contests each year. In National Hunt racing we do not get the sample sizes that we do on the AW, but I still wanted to try a similar thing. I trolled through different course and distance (C&D) combinations and discovered that Uttoxeter over 3 miles had the greatest number of handicap chases annually of any course in the country. So it is that this combo begins my NH deep dive journey. As a bonus, there will be some additional course and distance 'goodies' appended to this piece.

I mentioned in the last article that looking for patterns and pointers for races from a specific C&D is a type of trends-based approach. Using past race trends has become more popular in the past 15 years or so, although generally this approach has been used for big races such as the Grand National or the Derby.

As stated above, I will be focusing on handicap chases over 3 miles only, with data taken from 2017 to 2025. Profits have been calculated to Betfair Starting Price (BSP) with returns adjusted for 2% commission. Let's crack on.

Race Distance

Before looking in depth at the numbers let me share the class of race we tend to get when racing over this C&D. The graph below shows the splits:


Around 75% of all races are either Class 4 or 5 contests with not too many high class chases over the 3-mile trip here.


Betting market

Let me look at the betting market for our first main set of stats and specifically market rank. I have used the Betfair market for this:


As we can see favourites have done well, producing returns of just over 10 pence in the £. Second favourites have fared quite poorly, especially when priced higher than BSP 6.0 – this cohort has won just two races from 40 (SR 5%) for hefty losses of £27.92 (ROI -69.8%). Those ranked fifth or higher in the betting have had a poor record, and it should be noted that the biggest priced winner over this C&D across the 143 race sample was returned just 31.54 BSP. This has not been a happy hunting ground for outsiders. Horses priced BSP 35.0 or bigger were 0 from 149 with just nine placed efforts. Backing them to win would have obviously lost punters £149 to £1 level stakes if backing every single one but backing them instead to place on Betfair would have also amassed big losses of £70.01.


Age

A look next at the age of horses that competed over this C&D. There was only one four-year old runner, so I have ignored that age group. Let me share win strike rates first:


There seems to have been a clear advantage to younger horses, especially those aged five to seven. Let us see how the overall figures look in terms of profits and returns:


There definitely has been an age bias here, and this table confirms it. Younger horses, aged five to seven, have not just won far more often but each have produced a blind profit. In contrast, there were significant losses for those aged eight to ten. The 11-year-old-plus group have edged into profit but this figure is badly skewed as three of the nine winners were the three biggest priced from all of the races, with BSPs of 29.18, 31.07 and 31.54.


Course form

A look at course form next. Below is the breakdown of course winners versus non-course winners; however, the non-course winners have been split into two: those who had raced at the course before and those who had not:


Course winners had the best win strike rate, but they would have lost more than 10p in the £ if betting blind. Those with no course experience have performed quite moderately with the lowest strike rate and the heftiest losses.


Distance change

I wanted to look to see if a change in distance from last time out had made any difference. For the record, the ‘same distance’ stats include races of half a furlong shorter or longer from last time, as well as the exact 3-mile trip:


The figures suggest that a run last time out within half a furlong of the Uttoxeter 3-mile trip was the optimum. It produced the best win percentage and much better returns. The A/E (BSP) index for this group was excellent too, standing at 1.10.


Weight carried

I decided to look at weight carried by splitting the runners into two – those 11st 3lb or higher versus 11st 2lb or lower. This gave us fairly even groups to compare:


These results surprised me a little as I had expected those carrying more weight to win slightly more often. In terms of returns over this period, the lower weighted cohort almost broke even whereas those in the higher weight bracket incurred a hefty 20% loss at BSP.


Recent form

Next on my list was the performance last time out in terms of finishing position. The splits were thus:


A bit of a mixed bag here with horses that finished fourth last time faring best in terms of returns. Funnily enough the figures for last day fourths were not really skewed by big priced winners, but the sample size means these results are unlikely to replicated in the future; well, I surmise that to be the case, especially from a returns perspective.

The main takeaway here I guess is the inferior performance in terms of ROI% of horses that finished fifth or worse last time out – losses of 21p in the £ is steep. This is especially true as the overall returns combining all courses in 3-mile handicap races have seen a loss of just 3p in the £ to BSP.
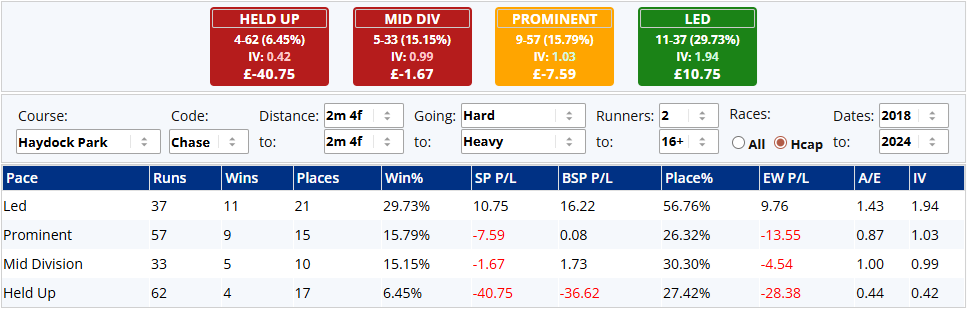
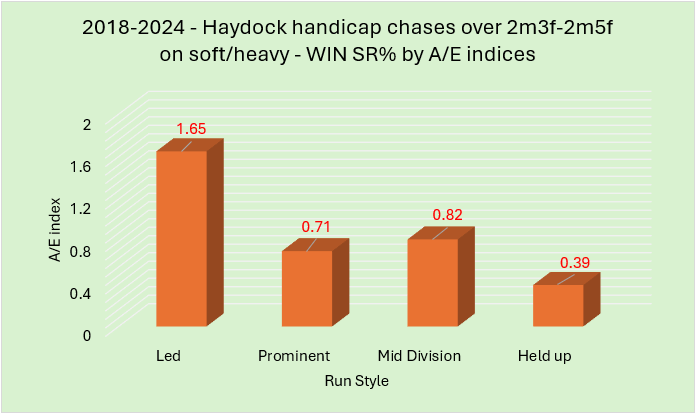
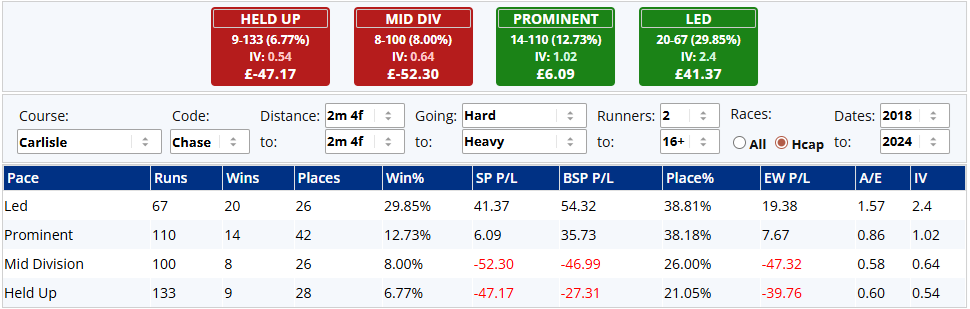
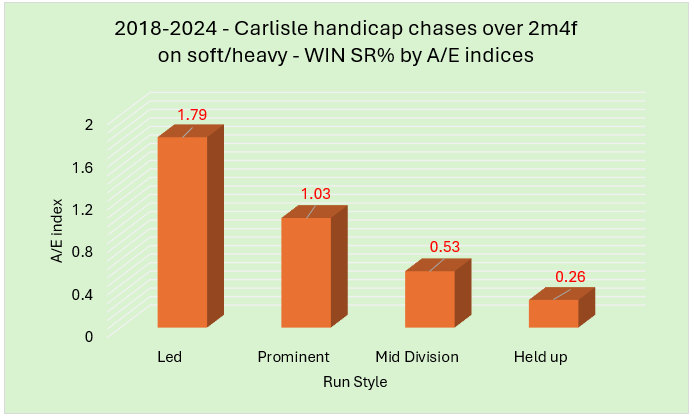
 

Run Style

Back in November I wrote a two-parter sharing the top ten handicap chase C&D biases in the UK. This track/trip combination did not make the final list, but it was part of my ‘long list’ of 20 and was one position away from being shared with readers as it stood in 14th, and I shared the top ten as well as three near misses (11th to 13th). Anyway, the following splits for wins to runs ratio for each run style group should not surprise anyone!


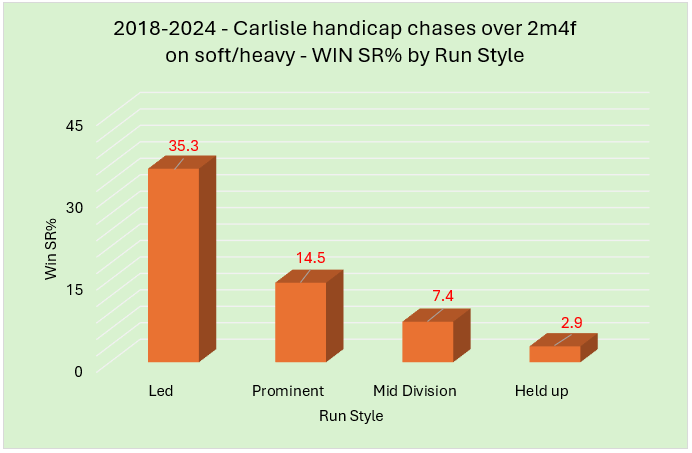
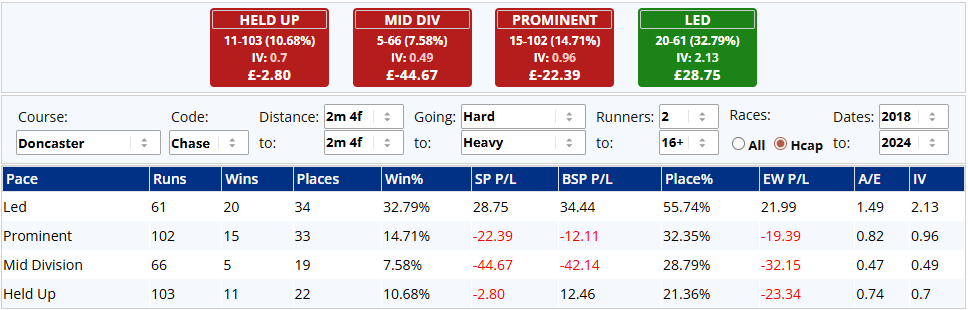
Front runners / early leaders have had a strong edge, with hold-up horses really struggling. This has been mirrored by the each way stats with leaders making the frame over 43% of the time, compared with just 23% for hold up horses (within their run style groups). Hence the PRB figures also continue this strong correlation:


For the record, if we had been able to predict pre-race who would lead early then we would have seen huge returns of over 69p in the £!


Ratings

With the recent addition of Topspeed ratings and Racing Post Ratings (RPR) to the Geegeez Query Tool, I thought I would share some results over this C&D focusing on ranking position. RPR first:


The rankings proved to be excellent since 2017 with the top two rated outperforming the rest by some margin, both in terms of strike rate and profit / loss / ROI%. And how has Topspeed fared?


Top rated runners again performed very well while second rated runners also nudged into profit, albeit just. Both sets of ratings were extremely good across this time-frame.


*


I hope this article has highlighted where the value has been in these Uttoxeter 3-mile handicap chases, and now as promised here are some bonus C&D extras. These snippets cover Bangor, Exeter and Perth as each of these tracks hosted more than a hundred handicap chases over 3 miles between 2017 and 2025. The key findings are shared in bullet point format.


Bangor 3-mile handicap chases

  1. As with Uttoxeter there were no winners priced BSP 35.0 or bigger.
  2. Favourites lost over 10p in the £.
  3. Amazingly, just like Uttoxeter, horses that finished fourth LTO made a decent profit of 48p in the £ from an 18% win percentage!
  4. Horses carrying 11st 2lb or more again won more often than the 11st 3lb+ group and produced a small blind profit of just over 3 pence in the £.
  5. This has been a rare C&D where front runners have not had an edge. Indeed, prominent racers fared best in terms of wins to runs ratio. Meanwhile front runners, midfield and hold-ups all had similar wins to runs ratios, within 1.7% of each other.
  6. The top-rated Topspeed runner won 22 races from 104 (SR 21.2%) for a profit of £27.45 (ROI +26.4%).


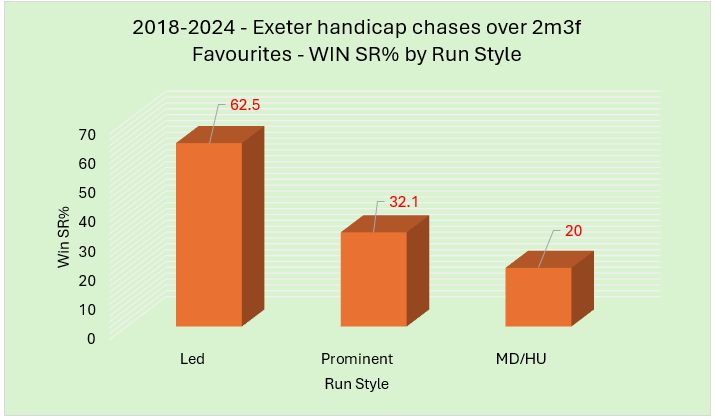
Exeter 3-mile handicap chases

  1. Favourites really struggled here, winning just 19.8% of the time (21 wins from 106) for hefty losses of £38.58 (ROI -36.4%).
  2. Outsiders fared better at Exeter than at Bangor or Uttoxeter with five horses winning at odds in excess of BSP 35.0. Backing all such longshots would have yielded a profit of £180.60 (ROI +150.5%).
  3. 11yos and up enjoyed just one win from 90 attempts.
  4. Horses finishing first, second or third LTO all individually made a blind profit to BSP.
  5. Exeter’s 3-mile trip favours front runners very strongly. They won 29% of all races from just 15% of the total runners.
  6. The top-rated Topspeed runner won 16 races from 107 (SR 15%) for a profit of £14.98 (ROI +14%).


Perth 3-mile handicap chases

  1. Favourites excelled, winning 34.9% of the time and returning just over 11 pence in the £. Second and third favs also were ‘in the black’.
  2. There has been just one winner priced over BSP 18.0.
  3. Horses with two or more previous course wins did well with 22 wins from 94 (SR 23.4%) for a healthy profit of £42.78 (ROI +45.5%).
  4. Last day winners have struggled in terms of returns, losing over 27p in the £ at BSP. Horses that finished second or third last time were both profitable to follow.
  5. Front runners have a small edge over 3m at Perth, while hold up horses have really struggled.


That's all for this piece. I hope you will be able to make use of these facts and figures in the coming months and years.

Until next time...

- DR

Top 10 Front Running Biases in Handicap Chases, Part 1: 10 to 6

The Top 10 front running biases in handicap chases Part 1 – 10 to 6

Over the next two articles I will share what I believe to be the Top Ten current run style handicap chase front running biases in the UK and Ireland, writes Dave Renham. In this first half, I will reveal positions 10 down to 6; and next week I'll reveal my top five. Of course, I appreciate that there will be people who disagree with my hierarchy but, ultimately, all ten biases have shown themselves to be profitable to deploy alongside more traditional form reading. As a bonus, today I will also share three near misses that narrowly failed to make the top ten.

Introduction

To compile my top picks, I have used data for handicap chases only as they are not so prone to distortion by the ability range of the horses competing. Data are from 2018 to 2024 with no minimum runner consideration.

I mentioned in a recent offering that Gold members of Geegeez have so many benefits and one of these is access to the Pace Analyser. This allows users to dive into run style / pace biases at any racecourse in the UK and Ireland. The data can be filtered based on going, field size, distance and race type. There is also the option to separate hurdles and chase (and NH Flat) data at jumps courses; and across all courses the data can further be filtered by year to allow for possible changes in any bias. The Pace Analyser is ideal for research such as this, and it was the main source that I used to produce what follows.

The run style data on Geegeez is split into four groups - Led, Prominent, Mid Division and Held Up. A quick refresher of which type of horse fits each profile:

Led – horses that lead early, usually within the first furlong or so; or horses that dispute or fight for the early lead.

Prominent – horses that lay up close to the pace just behind the leader(s).

Mid Division – horses that race mid pack.

Held Up – horses that are held up at, or near the back of the field.


Near Misses

In general, the ‘led’ group has an edge in most handicap chases. Some courses offer a stronger edge than others and hence let me start by looking at the C&Ds that were near misses:


Exeter 2m3f

To get this distance on Geegeez we need to use the 2m4f distance figure on the Query Tool / Pace Analyser as distances are grouped every two furlongs. It should be noted, too, that some race distances at a track change slightly sometimes due to rail adjustments. This happens more and more these days, or at least it is more accurately reported these days!

Let me share the Exeter figures taken from the Pace Analyser:


This is a good time to note that not all run style groups have the same number of runners; there are always going to be far more hold up horses than front runners / early leaders. However, despite the ‘led’ group having just 82 qualifiers compared with the held-up group of 161, they have still won 20 races compared with 15. The Win%s in the table show the strike rate within each run style group, and for this article that is how I will quantify ‘win strike rate’.

The ‘led’ group produced by far the highest percentage at 24%. That is, 24.39% of the horses that led early went on to win their races. (They actually won 31.25% (20/64) of all races in the sample).

Leaders' place percentage was comfortably the best too, with 47.6% of early leaders still in the frame at the finish line; while their A/E index of 1.39 indicates that front runners were very good value.

If we considered favourites only in these races and their performance by run style, we have seen the following win strike rates splits (I have combined favourites whose run style was either Mid Div or Held Up):


Front runners / horses that contested the early lead had an outstanding record when favoured by the market. However, it's a different story for those favourites that raced mid pack or at the back early. As can be seen, the bias over this course and distance has been very strong indeed, but still it wasn't quite enough to make my top ten. Exciting times ahead, then!

Before moving on, in terms of what has happened in 2025, of the eight races to date, five have been won by front runners.


Sedgefield 2m5f to 2m5½f

Using the Geegeez tools we use the 2m6f distance.


Front runners have hit a win rate in excess of 30% and the only reason this track/trip did not make the list is due to the relatively strong stats for horses that raced in midfield early. Also, the 2025 stats to date have seen horses racing mid-pack early doing well and winning three of the six races to date.


Lingfield 2m

The stats were as follows:


Strong figures again for front runners, although this is another course and distance (C&D) where qualifying races were relatively infrequent (only four races per year on average). Indeed, at the time of writing there has been just one qualifying handicap chase in 2025, but it was won by the early leader as we can see:


It is also worth noting that he was projected as the 'probable lone speed' in the race:


OK, near misses shared; onto position ten in my list.


Top 10, 10 to 6

#10 Chepstow 3m

Some readers may expect front runners to be at a disadvantage over longer distances in handicap chases: surely for a horse to lead from start to finish in a 3-mile race would not be any easy assignment, right? However, looking at the Chepstow breakdown I suspect might change a few minds!


Front runners have bossed these races over the past few seasons, while prominent racers have been clearly second best with much better stats than horses which raced off the pace. 68 of the 96 winners raced close to the pace or at the front - that's 71% of the winners from 47% of the runners. And a front runner has been over four times more likely to win than a hold up horse when analysing the win percentage within their respective groups (25% versus 5.7%).

Now, as stated earlier, we get more hold up horses than front runners in most races and there were just over twice as many hold up horses compared to front runners between 2018 and 2024. That means therefore that when talking purely about race wins, front runners have won just over twice the number of races than hold ups.

There have been seven races this year so far with two being won from the front.


#9 Sandown 2m4f

It is time to head to Surrey now, and specifically Esher, to look at the 2m4f stats from Sandown. The run style splits for this time frame were as follows:


It's a similar story to Chepstow’s 3-mile trip but front runners have had a better place record here, hitting over 53%. There have not been that many qualifying races per year (roughly five to six) but keep an eye out for confirmed front runners when they race over this C&D. Those on the early lead have had an even stronger edge on soft/heavy ground as can be seen below:


From Sandown we head up country to Haydock.


#8 Haydock 2m3f-2m5f

Haydock seemed to have 'played around' a little with the usual 2m4f trip occasionally adding or dropping a furlong. Hence, I have combined results together a furlong either side of two and a half miles. Let me share the run style stats:


There has again not been a huge number of races each year, but the front running numbers were extremely strong over the period of study. 11 of the 29 races were won from the front and that cohort also had an outstanding place record. Hold up horses really struggled in terms of winning, though they fared better from a placed perspective.

Haydock, like Sandown, has seen the front running bias strengthen on softer ground. On soft or heavy the run style win strike rates were as follows:


It should be noted the sample size stands at only 17 races. The A/E indices correlate strongly as the graph below shows:


All in all, Haydock over 2m4f has strongly favoured horses racing at the front end.


#7 Carlisle 2m4f

Staying north for number seven, as we head to Carlisle next. The run style splits were:


It could be argued that both Haydock and Sandown should be positioned higher than Carlisle in the list; but Carlisle’s overall sample size was bigger and that swung it for me, along with an outstanding A/E index of 1.57 and excellent IV of 2.4. The figures for both of these metrics were the highest of the four C&Ds shared to date, and comfortably so.

In terms of underfoot, once again we have seen a strengthening of the bias on softer ground. I will share the win strike rate percentages and the A/E indices once more. Firstly, the win stats:


Clearly, as with the 2m4f trips at Sandown and Haydock, on soft or heavy it has been hard to make up ground from further back. 21 of the 27 races were won by front runners (12 wins) or prominent racers (9). Hold up horses had a win rate of under 3% within their run style group which is the lowest figure seen to date.

The A/E indices positively correlate with the win SR%s as we would have expected:


A ‘led’ figure of 1.79 suggests huge value; not so for the 0.26 hold up A/E index.

One final front running stat to share for this track and trip combination is connected with those early leaders that were in the top three of the betting market. This collective won 16 races from 36 qualifiers which equates to a win rate of over 44%.

This year, at the time of writing, there have only been four qualifying races over this C&D (all going conditions), and three of the four have been won from the front.


#6 Doncaster 2m3f to 2m4½f

Onto Donny now to close out the first half of my top ten. They have races over similar distances from 2m3f to 2m4½f so all races within that distance band are included (2m4f for all on Geegeez Pace Analyser):


Front runners have won 20 of the 51 races and have an excellent placed record to boot. The ground is rarely testing at Doncaster, but on good to soft or softer the bias does seem to get even stronger:


11 of the 25 races, which equates to 44% of all races, were won from the front under these conditions.

If we considered favourites only at Doncaster and their performance by run style, we have seen the following win strike rates splits (I have once again combined favourites whose run style was either Mid Div or Held Up):


Favourites that led early have been far more successful than other run style groups.

And that rounds out the lower half of my top ten. Next time it will be the top five, some even stronger biases than these! Until then...

- DR