
This deep mid-winter lockdown is not good for much, but it is providing ample opportunity to conduct racing analysis, reading, and a general upskilling on the racing knowledge front, writes Jon Shenton. Yes, it’s wafer thin positive but, as for many others, focusing on our wonderful sport provides a diversion and purpose through the long dark nights.
With that in mind, I’ve decided to focus on the yard of Fergal O’Brien for this edition of Trainer Profiles as there is plenty of data-driven interest emanating from the stable’s runners. Based at Ravenswell Farm deep in the Cotswolds, and a few miles away from Cheltenham, the yard as of 23rd January has notched 73 winners during this National Hunt season. That’s enough to reside in 7th in the trainer table in terms of prize money, and 3rd in terms of winning races. O’Brien and team have been an outfit to keep onside for quite some time and are still on an ascendant arc.
A link to their website is here and it is well worth perusing at your leisure (it also saves me using wordcount on the intro!)
In addition to this, it would be remiss of me not to highlight the very entertaining twitter presence that the yard has, which has attracted over 36,000 followers currently. I’m sure that if you’re on the platform you probably follow them already but, if not, I’d heartily recommend checking them out @FOBracing. An array of very funny content awaits, along with a championing of many worthy causes and a dedicated obsession with cake and cardigans.
Meanwhile, back in the betting world…
Fergal O’Brien: General Market Performance
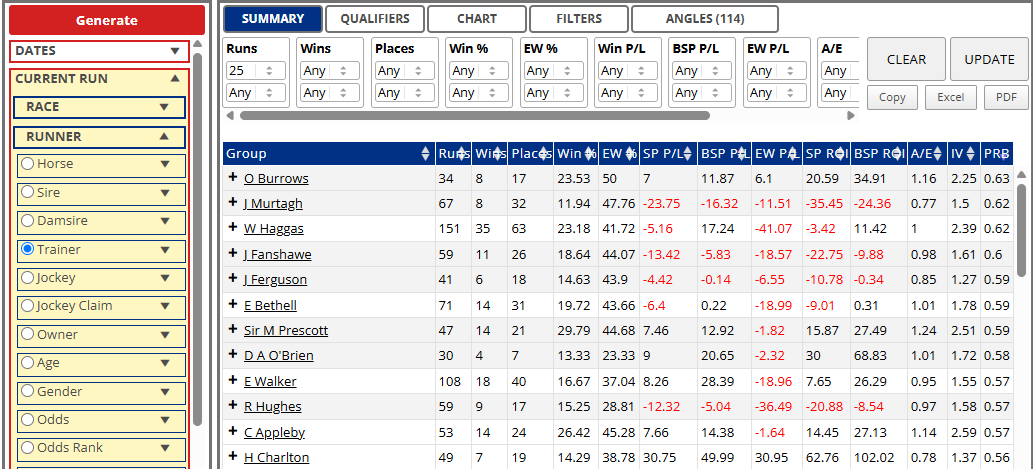
As per my recent article on Jeremy Scott I like to get a feel for the general performance of a yard through a quick market check. The below table contains data representing O’Brien’s runners from January 2011 to present (9th Jan 2021). It relates to National Hunt runs only in the UK.


Immediate focus and initial conclusions show a competitive yard at all prices but there does appear to be a potential sweet spot in one or two of the more fanciful price ranges. Based on these data it would have been profitable at SP to support every one of the yard’s horses where their odds returned between 13/2 and 20/1 over the past decade or so.
To help further contextualise, the below graph demonstrates the A/E performance of the team at SP when compared to the UK National Hunt Market Average over the same period.

O’Brien’s numbers match the market trend in reasonably close fashion until the aforementioned 13/2 price banding. The orange (FO’B) line on the graph shows a significantly improved outcome versus the overall market through these ranges. It may also be prudent to note that at SP’s north of 20/1 the yard is 7-from-416 so historically there aren’t many that deliver from completely out of left field.
In summary, the graph and stats demonstrate an operation who can swim against the tide of conventional market consensus on a regular basis.
When presented with a picture such as this it is sensible and pragmatic to establish why the market seems to consistently understate the chances of a horse under certain conditions. In general, markets are positively receptive to recent evidence of a “good” run. As a result, a good first port of call is to check performance by whether the horse had a decent result in their prior race. There are numerous ways of doing this. However, keeping it simple and evaluating by whether the horse placed last time out is as good a starting point as any.
The table below shows these mid-range priced animals for FO’B in relation to whether their last outing resulted in a placed finish. There are 77 runs where the horse at the price ranges had no previous run, so they are excluded from the data.

The numbers clearly demonstrate enhanced performance for horses that had (at least by finishing position) a less impressive venture last time out. An obvious health warning is that a strike rate of 11% is not for the faint of heart. By tracking and backing such runners indiscriminately over the past decade one would have faced a longest losing run of 37 (according to horseracebase) during that period. It takes a lot of mental fortitude, and a commensurate betting bank, to keep pressing on whilst in the eye of a storm like this.
Taking it slightly further, there is always reassurance in finding reasons that a runner may improve next time. Factors such as differing underfoot conditions, headgear amendments, and even jockey changes can all be considered. Race distance is another.

The table above displays the performance of those unplaced last time out runners by whether they competed over the same, or a different, race distance compared to last time out. There is a clear divergence in performance: essentially, a change in distance has resulted in an improvement in a high proportion of the yard’s runners.
Again, it’s not an angle for the timid, and it is hard to advocate backing these blindly with a strike rate shy of 12%. However, the evidence at least increases the mental fortitude to partially ignore the market when an FO’B horse does not have the comfort blanket of a productive run last time out, especially if there is a credible reason that the horse may step forward today, perhaps as a result of a different trip.
Having said that the record of horses at an SP of between 16/1 and 20/1 in this sample is neutral so, ideally, I’d want a price at 14/1 or shorter to play.
Fergal O’Brien: By National Hunt Race Code
Maintaining a high level focus the below table illustrates the yard’s performance by the race code within National Hunt racing. For reasons broadly alluded to above I’m only considering runners with SP’s of 14/1 or shorter from this point on in this article.

It’s all good stuff, however, there is slightly more meritorious performance levels in the chase and NH Flat disciplines. Initially, I want to focus on the bumper component. I have referred to O’Brien’s proficiency in these races in this earlier article. However, it’s worth a quick refresher / reminder, and updated view here.
The first stop is to check performance by the number of career runs under rules that the horse has experienced. This info is contained below.

Again, it probably is another exhibit demonstrating how the consensus of the market underestimates a first-time out runner with zero racecourse evidence. Evidently, there is only marginal variance between the two data sets in terms of win and place rates. However, the debut runners outperform the market in terms of A/E at 1.11 and return nearly 25% profit as opposed to an 8% loss for those with a previous trip to the track.
It’s not all good news though, the below table shows the monthly distribution of the yard’s debut runners.

It seems that the boat has been missed in terms of this current National Hunt season. Autumn is clearly the peak period for O’Brien in terms of delivering new runners to the track. Any animal making their bow during this time of year is usually a serious betting proposition. It doesn’t mean that runners at other times need the cold shoulder treatment. However, that concentration in performance from September through to November is compelling. Keep this in the front of your mind later in 2021. Hopefully, we’ll be able to get to the racetrack to watch them prevail!
Fergal O’Brien: By Track
When evaluating O’Brien’s performance across the different racecourses around Britain there are several interesting considerations which are of the ‘sit up and take notice’ variety.
Firstly, the below table gives us the numbers for the stable runners by general geographic location of the track. Sorted by A/E. The top line is sweet viewing.

These Scotland data are extremely noteworthy! Nearly a third of the runners sent north of Hadrian’s barrier return home furnished with winning spoils, returning a fat SP profit of 43.5% for punters too.
Mr O’Brien and team appear to have the measure of precisely when to undertake the long trek north. There is a small caveat (as usual) in that the place data isn’t materially superior for the Scottish runners than those sent to the rest of the UK. This may indicate a statistical anomaly in this exemplar performance, especially given the ever-present warning regarding sample sizes.
For completeness, zooming in on these data below, we can view the numbers for individual Scottish courses.

Unmistakably, Perth is the track that has been targeted on these raids. It’s an eye-watering 387-mile expedition from Cheltenham and a six-and-a-half-hour drive (on a quiet Saturday, too, when checking my app!): with a nearly 800-mile round-trip, making the outing worthwhile is obviously a sensible proposition.
Perth has a summer only fixture list (April through to September) so tracking stable runners during this time provides a National Hunt interest while the flat season is in full swing.
Turning the focus southwards, here is a top ten of all tracks in England and Wales in terms of A/E data in relation to the stable runners (30 runs minimum).

One or two points are well worth raising based on this table. Firstly, despite a small sample size, the yard’s runners at Sandown are seemingly always significant and should be on any shortlist for further evaluation. It’s also of interest that O’Brien’s horses generally run very well at their local track, Cheltenham. A lower strike rate (18%) is easily explained by the generally larger field sizes and the competitive nature of racing at NH racing’s premium venue.
However, something else caught my attention here: six of the tracks that make this list have the potentially interesting trait of being right-handed in nature. If you add Perth (another right-hander to the list) that’d be seven of the yard’s top 11 performing UK tracks being righties.
As a result, I thought it would be interesting to evaluate all of Fergal’s UK runners and their relative performance by track direction with the 14/1 odds ceiling.


Am I alone in finding this of interest? Probably, but I do find it fascinating!
In truth, only the yard would know if this was a “thing”. It’s more likely just a numerical curiosity but given some of the volumes involved it was well worth flagging! If nothing else, it’s a good example of the merit of stats and data in horse racing. The interpretation of the information is key and, without having a reason, it’s best to play safe. Consequently, I wouldn’t advocate building an angle around this. In fact, I’d strongly suggest you didn’t unless there is a tangible reason that the variance in performance exists (please feel free to leave a comment if you have a view!)
However, it is still worth writing it: by backing every single one of the 911 stable runners over the past ten years at SP (at 14/1 or shorter) on a right-handed course you’d have made a 14% rate of return!! I’d love to have a discussion with the yard to understand if there is any solid rationale for this, or whether it’s absolute codswallop!
Fergal O’Brien: By Jockey
For the final lap on Fergal, a quick assessment of the jockeys the yard typically engages to ride for them is in order.

These data illustrate the records of the jockeys who have most frequently represented the yard over the past two years, with the numbers showing their records at 14/1 SP or shorter dating back to the start of 2011.
Firstly, that’s an incredible percentage of rides that number one stable jockey Paddy Brennan takes for the yard. Secondly, it’s quite remarkable that by extensively backing all of Brennan’s rides for the stable from 2011 onwards you’d have a tidy profit of 11% to SP. It’s clearly a tight and fruitful combination of the utmost quality.
That said, I’m not personally a huge fan of jockey angles and can never seemingly make them pay. However, there is undoubted merit in analysing jockey performance by pace (run style) profile using the Geegeez Gold Query Tool.

No mega surprises here; it is generally seen that performance improves the closer to the front of the field a horse is in a race, and an O’Brien/Brennan animal is no different as the numbers clearly demonstrate. Finding a probable front running horse with this trainer / jockey combo is a desirable way to go punting.
Whilst a horse that gets to the front is optimal, the numbers are reasonably strong across the board. Even horses that are held up more or less break even (I’ve excluded 31 instances without a pace rating, where the in-running comment for the horse failed to outline its early race position). Again, this is not really angle material for me, more of a shortlisting tool.
The emerging talents of Max Kendrick and Liam Harrison are well worth keeping fixed in your sights, too, especially when they are working for Mr O’Brien. Kendrick in particular is off to flyer when riding for this stable.
That concludes this statistical jaunt around the O’Brien yard. I’ll be tracking them with a great deal of interest over the coming months and years, they are evidently an operation on the rise.
- JS
Other Recent Posts by This Author:
- Finding Profit in Novice and Handicap Chases
- Trainer Profiles: Keith Dalgleish
- Trainer Profiles: Nicky Richards
- Trainer Profiles: Jeremy Scott
- Newmarket Racecourse: Pace, Draw and Trainers


Great piece.The right/left hand angle is not something id normally look at.Maybe the fact he does so well at Cheltenham lessens the relevance be interesting to here what fob thinks.
Thanks very much Lee. Yes wouldn’t it be interesting to find out whether there is something in it! Until then I’m going to play it safe!
Is their any material difference in these results since FOB moved from Naunton to his new stables?
Very interesting article, be good when query tool as lto finishing position added to its armoury for those of us without HRB. As always your articles always get the old grey matter working, which in my case takes a bit of warming up. Looking forward to seeing more trainers put under the microscope.
Great read thanks.
Comments are closed.