
An initial investigation into Geegeez Instant Expert
I wonder how many people who read my weekly articles here are Geegeez Gold members? If you are, I think you're going to like this one... and if not, maybe it will give a gentle nudge to try things out, writes Dave Renham.
Introduction
One of the many benefits of being a Gold member are the daily racecards. These give far more ‘bang for our buck’ compared with other racing sites. Below is a screenshot of the racecard for a contest at Wolverhampton on Tuesday 5th May of this year:
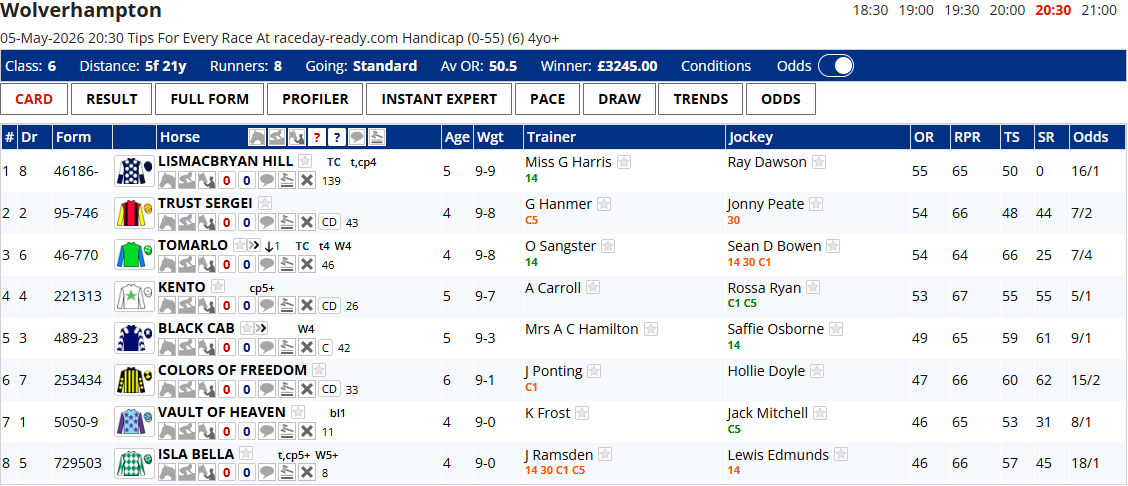

As we can see, there is the usual type of information we would see on most racecards such as the draw, recent form figures, name of the horse, age of the horse, weight carried, the trainer, jockey and official rating. However, we also get to have the Racing Post Rating (RPR) for each horse, the Racing Post Topspeed figure (TS), and Peter May’s excellent ratings (SR).
These extras are just the start, as if we cast our eyes to the top of the Racecard we can see some tabs: Full Form, Profiler, Instant Expert, Pace, Draw, Trends and Odds. Clicking on these tabs presents a wealth of further information and data in order to assist with our race analysis. There are also some icons just below these tabs (between the word ‘Horse’ and ‘Age’) with breeding data, jockey and trainer form etc, etc. So, to coin a phrase, these racecards are literally gold!
In this article I want to focus on the Instant Expert tab in a little more detail. This tab is exclusive to Geegeez, and the tab lets us see a variety of key data for horses as shown below using the same race as above:
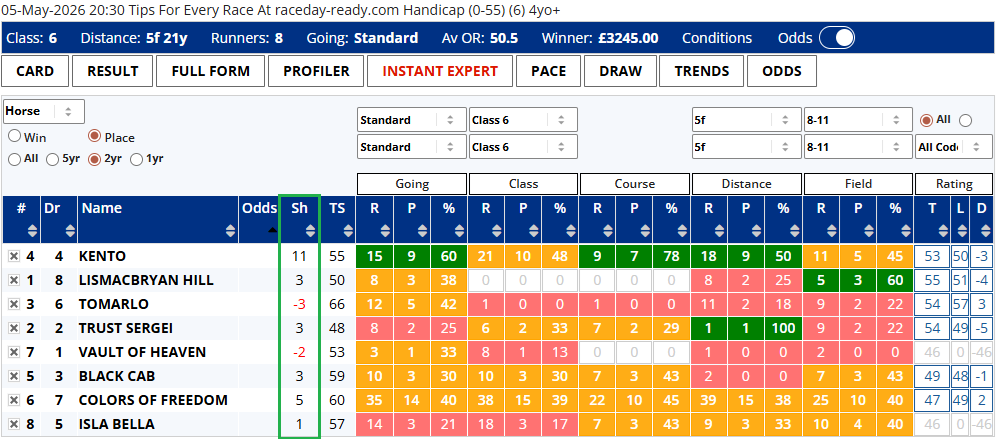

Instant Expert gives us punters key horse information. It has a unique ability to summarise the form profile of every runner in the race into a single easily digestible view. It covers the form of each horse in terms of wins (or places), runs, and win (or place) percentage for each of five key areas namely going, class, course, distance, and field size. It also compares today’s official rating for each horse with their last winning official rating. The display is colour coded to help see things more clearly at a glance: green for a higher percentage rate, amber for a middling percentage, and red for a low percentage. Horses with no form under a certain condition have grey figures. It should be noted that the past data is taken from UK and Irish racing only so will not include overseas form.
Users have the ability to change parameters easily. In the above example I am using placed form over two years. This is my favoured combination, but at the touch of a button we can change this to one or five years, or even look beyond that for older horses using the ‘All’ tab. We can look at win data only if preferred over any of the four-time frame options. Also, we can expand individual areas if required; so for example when I look at All Weather races, after looking at the stats for the specific going, I will click the going tab, so it includes both standard going and standard to slow to give me extra data. Clearly, we can do the same with all other variables should we wish and I will often do this for longer distances on the distance dropdown. For example, if a National Hunt race is being run over 2 miles 1 furlong, I will expand a little by including past results from any race from 2 miles to 2 miles 2 furlongs.
In addition to drilling into each horse within the five key areas, we are able to look at sires, trainers and jockeys within those areas too should we wish. Sire data is particularly useful for 2yo races for example, when the majority of runners have little or no past form to speak of. Trainer data is something most punters like to look at, and I will always look at the trainer data when analysing any race. This Instant Expert tool is exceptionally useful, and we can crunch so much data within a matter of a few seconds.
In the last few months there has been a new addition to the Instant Expert template, namely a new column with scores based on The Shortlist scoring system. Green percentages score three points, one point for amber, none for grey, and minus one for red. Hence across the five areas horses can obtain a top score of 15 (five greens) and the lowest score is -5 (five reds). The scores update when you change the variables and dropdowns above the main data grid. In the screenshot I shared above, the Shortlist column has the heading ‘Sh’ and is highlighted in the green box.
In this race, we can see Kento had the highest Shortlist score of 11, whereas Tomarlo had the lowest figure of -3.
Having set the scene, I am now going to share some research I have undertaken connected with these Shortlist scores. I have used a data set that I used for run style / pace articles a year ago, in May 2025. I will be looking at 5f handicap data from the whole of 2024 with the exception of 2yo handicaps, or nurseries, due to limited past horse form.
This sample covers 575 races and over 5000 horses with their individual Instant Expert Shortlist totals. This, therefore, is a reasonable sized sample, and I must say that adding over 5000 Shortlist scores to my Excel sheet was not the quickest process! [We're very grateful! - Ed.]
After all the leg work to input these individual scores, I hoped that I would find something worth sharing! Let’s see…
I am going to write this research up while crunching the numbers so, at this point, I do not know which way this will go. Normally, I do all the research, then crunch the numbers and then write it up. Therefore, it will read more in the present tense than usual.
So, to recap, the highest possible Shortlist score is 15 and the lowest -5 so one area I plan to look into will be the performance of different individual Shortlist scores. I guess the hope is that the higher scores, 12, 13 and 15, (14 is not a score that can be achieved), would certainly win more often and hopefully prove better value, than the lowest scores such as negative values of -1 to -5. However, there is a slight caveat to this because there will be plenty of races that are contested by horses with modest or poor long-term records and hence a Shortlist score of 3 or 4 could in fact be the highest Shortlist score in the race; so I will also need to rank the Shortlist scores in each race. One would hope and indeed expect that the higher ranked positions would win more often than the lower ranked ones and, assuming that is the case, does that lead to a difference in returns?
In terms of these ranked positions, there will be some horses in most races who have the same Shortlist score and therefore they will be treated as ‘joints’. In other words, if we have a five-runner race and the Shortlist scores are 13, 11, 8, 8 and 0 then the horses scoring ‘8’ with be ranked both ranked third, there will be no fourth ranked horse, with the horse with ‘0’ being ranked fifth. Fairly obviously I hope the 13 score would be ranked one or top, with the ‘11’ second.
In this article I will start by looking at the results with no price cap as I just want to examine the raw data first. Obviously, the odd big priced winner could skew the bottom lines, but I will mention it when that happens. I will probably use a price cap at various junctures, I’m just not sure exactly when as yet.
Instant Expert Shortlist (Sh) – Performance by Rank
My starting point is to look at the ranked positions of the Shortlist scores across all the handicap races in my sample. I began by comparing their win percentages / win strike rate. The graph below shows the breakdown:
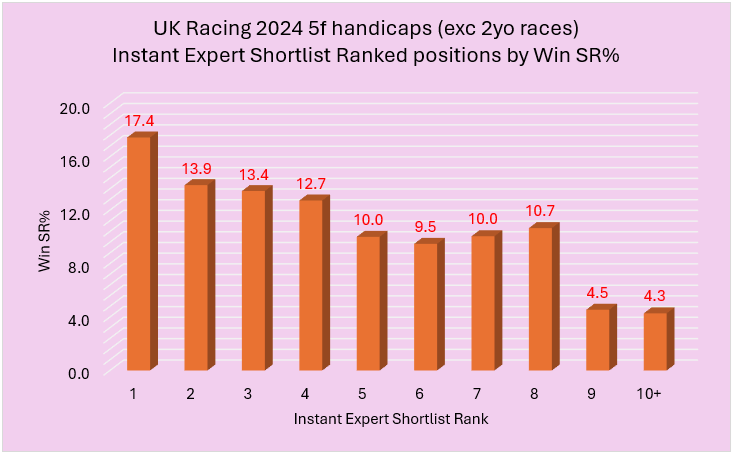

The hope was that we would see the usual sliding scale from left to right as we normally do when we look at any type of ‘ranking’. Generally, that has been the case here, although those ranked seven and eight are slightly out of kilter. I think because there were a good number of ‘joint’ positions we should expect slightly more overlap than normal. The good news though is when we look at either end of the graph we see the top ranked runners winning the most often and those ninth or worse winning the least. Not only that but the top ranked have by far the best win rate and likewise those ninth or lower have by far the worst.
To build the picture further I want to look at the PRBs (Percentage of Rivals) for each rank. This metric essentially creates much bigger sample sizes as the figures are affected by all the runners in every race. Hence, I am hoping this graph will have the near perfect left to right sliding scale:
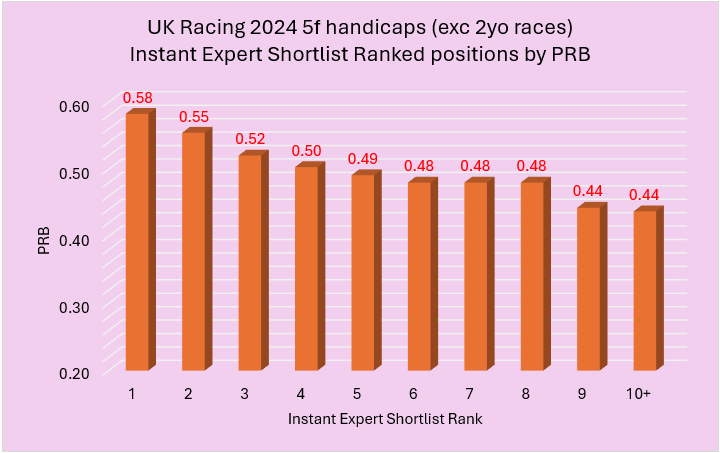

0.58 is a strong PRB for the top ranked and we essentially see our ‘normal’ type of graph when analysing the performance of ratings or in this case rankings.
So, how does all this equate then into profit and loss returns? As I tend to do in all my pieces, I will use Betfair SP (BSP) less 2% commission on any winning bets for these calculations. Here are the splits:
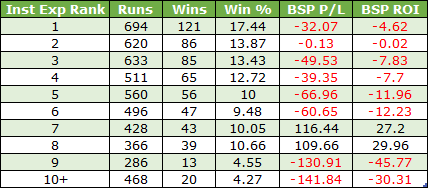

As far as I am concerned, it makes excellent reading if focusing solely on either end of the table. The top ranked runners have by far the best win strike rate, while the top two ranked runners combined have seen very small losses overall. Meanwhile those ranked ninth and tenth have produced significant losses of nearly 46p and 30p in the £ respectively. These definitely look to be horses to avoid.
However, we can see that those horses ranked seventh and eighth both made decent overall profits. At first glance this is not ideal as I would have preferred to see any profitable figures at, or near the top of, the table. However, both of their profit figures have been skewed by one big priced winner in each case. A horse called Rainyniteingeorgia won at Lingfield on 22nd December 2024 at the odds of 127.21 when ranked seventh. Take that winner out, and the remaining 427 horses ranked in seventh place would have made an overall loss. In terms of the eighth ranked winners Big Nut won at Musselburgh in August ‘24 at odds of 80.0 which wipes out a huge chunk of the eighth ranked runners’ profits.
Instant Expert Shortlist (Sh) – top two ranked runners
I want now to dig into the top two ranked runners in a bit more detail as when combined together they have not been that far from breaking even (losses of just under 2.5 pence in the £). With these combined results I am going to see if they have performed better or worse within different areas. To begin with, I am going to look at Class of Race. Here are the splits for each Class level combining the results of the top two ranked runners:
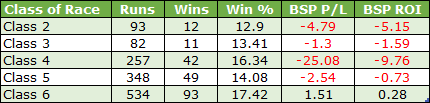

The figures do not fluctuate massively. Lower win rates in Class 2 and 3 races is what I would expect as these races tend not only to be very competitive but have bigger fields. Bigger fields mean lower win percentages. Also, the data sets for both of these class brackets are relatively small. Returns are similar across the different classes, although in Class 4 races the losses were a tad above the rest.
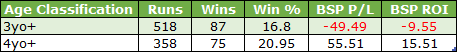
How about if we split the top two ranked runners by the Race Age Classification? There are three main types being 3yo only races, 3yo+ (races for horses 3 years old and older), and 4yo+ (4 years old and older races). There was one 6yo+ race in the sample which is obviously too small to worry about!
Before digging into the stats for each I am hoping to find slightly better results for the more exposed runners, namely the 4yo+ races. I am also expecting that the 3yo+ races would be the least predictable with less exposed 3yos running against more exposed rivals. However, I have been known to be wrong before! Right, let's see how the top two ranked runners have fared across the three different age classification types:
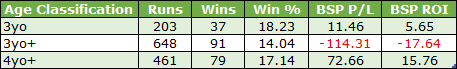

The 3yo only results are interesting; definitely better than I would have expected. The results for the 3yo+ and 4yo+ races seem to match my initial hypothesis which is pleasing. There is a significant difference in the strike rates between 4yo+ and 3yo+ races for these top two ranked runners. Also, the 4yo+ results for these runners see very decent returns of close to 16p in the £, compared with losses of over 17p in the £ in 3yo+ races.
However, before we get too carried away, the 4yo+ figures did have a BSP winner of 55.0 which accounts for a decent chunk of the overall profit figure. Therefore, it makes sense to implement a price cap when comparing these 3yo+ and 4yo+ results to avoid bigger priced runners potentially skewing bottom lines. Thus, for the next dataset I will include only horses that were priced under 15.0 BSP. Let's see if this changes things or not. I will build up the tension by first comparing the win and each way (win & placed) percentages for each:
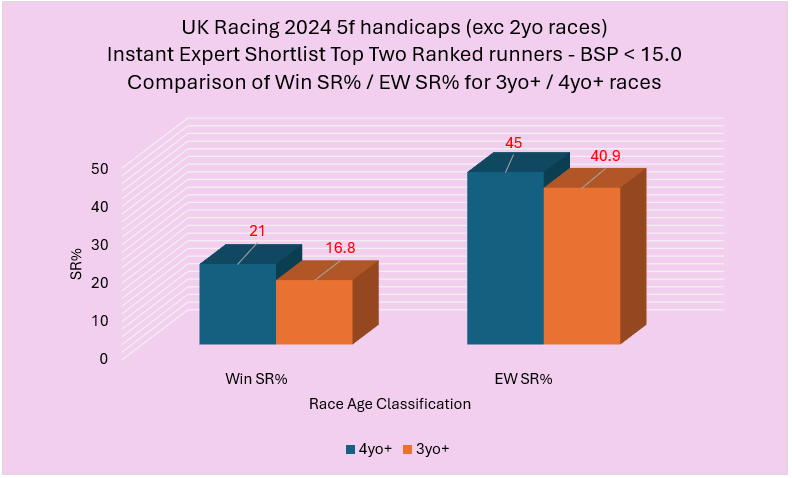

We see positive correlation with the 4yo+ top two ranked runners having outperformed their 3yo+ counterparts in both the win percentage and the EW percentage. This also correlates so far with what saw before I introduced a price cap. What about the profit/loss returns? The table below shows the splits and does the 4yo+ group come out on top as before?

They have indeed, and comfortably so. Based on this sample, and I appreciate it is just one sample of races, it seems that the top two rated runners from the Instant Expert Shortlist scores should be considered a strong positive in 4yo+ handicaps.


Sticking with 4yo+ handicaps, how have the top two rated performed when they finished first, second or third LTO? Let’s find out:
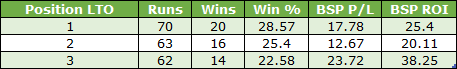
These figures are very impressive with each one showing a profit. I should add a caveat that each individual LTO position sample is fairly modest. However, to create a bigger sample, if we combine the results to include any horse that finished in the top three LTO we get 50 wins from 195 (SR 25.6%) for a healthy BSP profit of £54.17 (ROI +27.8%). Based on these findings, horses that finished in the first three LTO require close scrutiny if racing next time in a 4yo+ handicap when in the top two of the Instant Expert Shortlist scores.
Shortlist Rank Comparison: 3yo+ Handicaps vs 4yo+ Handicaps
Before finishing I want to share the PRBs for all individual Instant Expert Shortlist ranks for both 4yo+ handicaps and 3yo+ handicaps. We have seen already that the top two ranked runners have performed much better in 4yo+ races. How about using a PRB comparison across the board? The chart below gives us a neat graphical comparison:
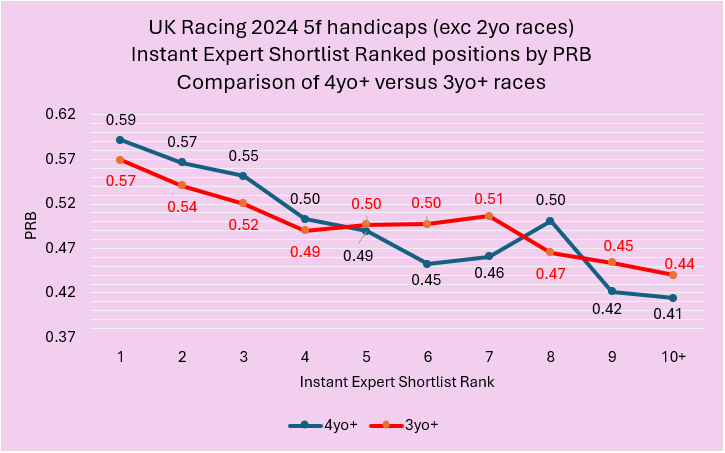

This graph perfectly illustrates why, for this sample of races, the ranking of Instant Expert Shortlist scores would have worked better in 4yo+ handicaps compared with their 3yo+ counterparts. The graph highlights the edge to higher ranked runners in 4yo+ handicaps coupled with the fact that the lower ranked runners perform less well when compared to the lower ranked 3yo+ groupings.
It is important to reiterate that what the graph shows is what we should expect from drilling into each horse in terms of their record on the going, in the specific race class, at the course, over the distance, and within a specific field size grouping. Handicappers aged four or older, as a rule, would have raced more often than 3yo handicappers over a full 2-year period. This would be especially true in the first half of the year, as 3yos only have two full years of races once they reach the end of their 3yo year, and that's assuming they started racing early on as juveniles.
More data for each of the five areas should be expected to be more robust and reliable.
*
When I started this research, I was heading into the dark somewhat. I assumed I would have enough decent material for an article and, as it turns out, I have plenty more to delve into. And I haven’t even started to look at the individual Shortlist scores from 15 to -5 yet. All in good time!.
Based on my findings so far, the Instant Expert tab is one that is not only unique to Geegeez, but it really might have the potential to almost single-handedly improve our bottom line. That certainly seems the case for the data analysed to date.
Next week I will continue my research and share the rest of my findings.
Until then...
- DR