


It's 1st September, the kids are about to go back to school, the nights are drawing in, and those hot balmy evenings are soon to be a thing of the past. OK, so point one may not be applicable to you, and point three wasn't applicable to any of us (!) but, nevertheless, the month of September is the beginning of the changing of the seasons. And it's also the time when we welcome back an old friend.
Yes, I am of course (of course!) talking about Peter May's UK National Hunt ratings! Dormant from May to August, where Peter feels they don't really produce as well as he'd like, they're now ready to burst forth once more until the end of next April. So, what are they and how do we use them?
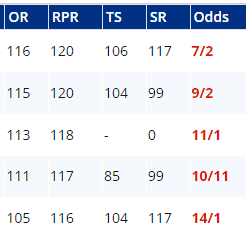
They are ratings, numerical barometers of a horse's prospects in a given race, and they appear on your racecard in the 'SR' column. I think we might change that to 'PJM' because SR - speed rating - is not quite right. You see, Peter's numbers are derived from a neural network: he's been doing artificial intelligence since long before it became fashionable. And they're much than a measure of speed; they include a number of form considerations making them a sort of composite of, in Racing Post terms, RPR (Racing Post Rating) and TS (Topspeed) - both of which we also publish on geegeez. Here's an example:

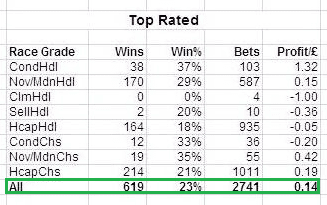
But how have they performed? Well, it's important to consider that no rating set should be expected to be profitable to follow blind... although Peter's actually were last season. Backing the top-rated on his numbers in every NH race from September 2022 to April 2023 at Betfair SP would have yielded a 14% return on investment:

This was an outlier in terms of annual performance so I don't propose anyone bets the top one blind, and nor would Peter. But it's indicative of two things:
- The predictive power of the ratings
- The relative value of the ratings
In terms of predictive power, the top one won just about a quarter of all races last season. In terms of value, these figures are under bet because they're less fashionable than, say, Timeform or Racing Post Ratings, which are virtually ubiquitous and suffer from a profitability perspective as a result: if everyone knows something finds winners, that thing will affect the odds available such that the sum of those winners cannot pay for the sum of its losers. If fewer people know about something, it has more of a chance to pay its debts. If you see what I mean.
Anyway, like I say, blind betting is not the way forward. But what about a few angles?
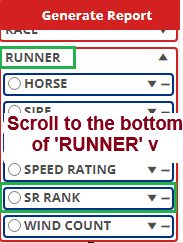
You may not know that 'SR Rank' is a variable in Query Tool, which makes experimentation with these ratings easy.

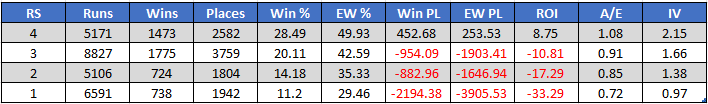
Let's look at the last three years (1st September 2020 to 30th April 2023), by SR rank - keep in mind these figures are to SP, so not as sexy as BOG or BSP returns:
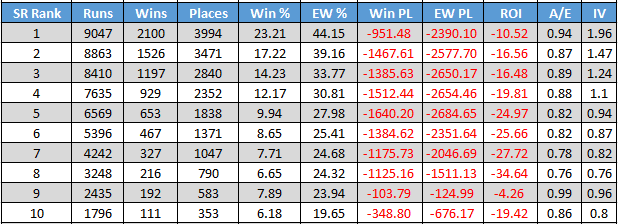

During that time, the top rated won 23% of all races and lost around 10.5% of stakes. Not bad but not great either. Notice the strong linearity in the win and e/w strike rates as we get further away from the top-rated.
Let's now look at the top three rated by race code - SR only covers hurdle and chase races, so no National Hunt Flat:


Win strike rates are similar (though average hurdle field size is greater, note the larger number in the IV column), and ROI is slightly better for chases - though again, not something to get stoked for. Nor either was there anything of direct value in terms of going, distance, class, or handicap/non-handicap.
One interesting angle is combining the race favourite with SR top 3 rated. Favourites in UK NH hurdles and chases in the sample period have won 35% of the time for an SP loss of just 4.7% - which is a lot of fun for negligible damage if that's the way you roll... but only betting those jollies which were also top 3 on SR reduced starting price losses to 3% at a winning clip of 39%. That's going to be a reasonable profit at BSP or BOG, albeit with the important caveat that we don't know the SP favourite in advance.
*In fact, and this is cherry-picking, using the top 4 SR rated and SP favourite reduces losses to a mere 2.78%
Another element unknowable in advance but, like market rank, at least somewhat predictable is run style. Regular readers will be aware of the enormous general importance of run style and, particularly, of a forward position. This next table shows the top 3 rated SR horses by run style, where 4 is led, 3 prominent, 2 midfield, and 1 held up:

It's worth labouring the point because that top row is so alluring: we cannot know the race leader in advance of the race. But Dave Renham has done plenty of work to show how predictive recent run style is, i.e. if a horse led in its recent races it is notably more likely to lead today.
To close, let's overlay three components: SR rank, market rank, and run style. We know that the top 3 (or 4) SR's combined with the SP favourite have performed well; and we know that those top 3 SR rated racing on the lead have fared extremely well, so let's combine these angles to give us SP favourites in the top 3 SR which led:


![]()

Because we cannot predict the SP favourite or which horse is going to lead, it's worth asking how much value the above actually offers. Well, I believe a fair amount. Even if we went with the first two in the betting, and those with a led or prominent run style, and the top 4 in SR, we'd still have effectively broken even over a three year period and 8000 bets. At SP.


These horses win, a lot, and there are ways to profitably incorporate them into your broader form reading - and ways to analyse the historical data using Query Tool to find further angles. So, yes, welcome back National Hunt SR!
Matt
p.s. you can of course do similar research for flat races within QT - and you might well find similarly attractive angles 😉