


Favourites in All-Weather (AW) Racing in 2026
Friends of mine who go racing once or twice a year often ring me up beforehand asking for some ‘tips’, writes Dave Renham.
My initial reply is always the same, “what exactly do you mean by tips?”
And their answer is invariably the same, “winners Dave, I want to back as many winners as possible!”
“Ah!”, I reply, “then that’s a simple one – just back all the favourites”.
After my opening gambit I go on to explain the rationale behind such an apparently facetious answer: that in order to give them the best chance of backing as many winners as possible on the day, backing favourites is the way forward.
Of course, for serious punters the question would be different, as making money over the longer term is about finding value, not winners. If it was as simple as backing winners, we would all be backing the favourite and making lots of money. Favourites are like any other market position in that they can offer value, but of course that does not apply to all market leaders.
All-Weather Favourites Overall
In this article my quest is to find the groups of favourites that have offered value in the past, or those that have offered poor value. Poor value favourites give us two options essentially; we can lay them on the exchanges, or we can look for a viable option from the remaining runners.
The data for this article relates to UK AW Racing from 2018 to 2025 inclusive. Profits have been calculated to Befair Starting Price (BSP) with returns adjusted for 2% commission. I am using Betfair Exchange favourites (clear favourites only) for this so let me start by showing the results for all such AW market leaders in the eight-year study period:
![]()

Losses are quite modest at just under 3 pence in the £, so there looks to be hope when it comes to finding a positive favourite angle or two. In terms of the betting returns on favourites, here are the annual splits:
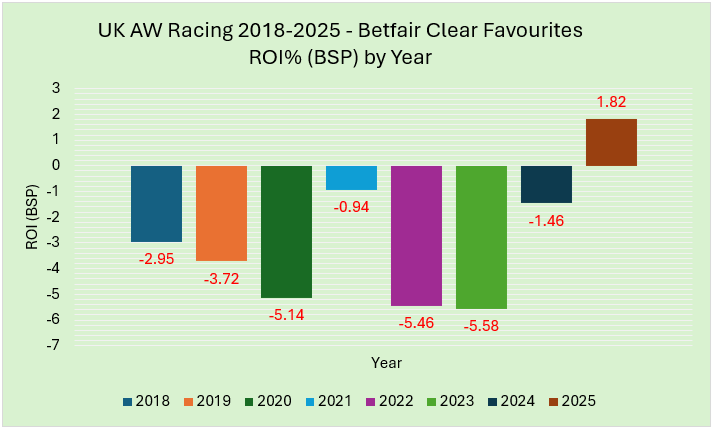

Last year actually would have turned a profit, but 2020, 2022 and 2023 all saw steeper losses of over 5p in £.
All-Weather Favourites by Race type
What about different race types? Firstly, let me share the handicap versus non-handicap figures for favs:


As we can see there have been slightly smaller losses in non-handicaps. Having said that non-handicap maiden favourites lost more than 5% due to 549 winners from 1267 (SR 43.3%) for a loss of £64.28 (ROI -5.1%). In fact, this is where my first two negative angles come in, namely 2yo only maidens and Class 2-4 maidens:

Once losses hit the 10%+ mark, I see that as a strong negative as far as favourites are concerned. Both these subsets siginificantly beyond that threshold; and, while on the 2yo maidens’ theme, 2yos making their career debuts that start favourite in all-weather maidens have done very poorly thanks to just 38 wins from 126 runners (SR 30.2%) for a loss of £34.66 (ROI -27.5%).
On a more positive note for 2yos, favourites in nursery handicaps have edged into overall profit thanks to 297 wins from 918 (SR 32.3%, +£28.44, ROI +3.2%). This could have been improved upon if we limit qualifiers to horses that had run at least once on the AW before. This cohort won 33.3% of time (232 wins from 697) for a profit of £51.04 (ROI +7.3%). We will of course have to wait for the summer to potentially exploit this in 2026.
One other race type to quickly mention is claiming races. Favourites have secured returns of over 11% in these races, but unfortunately such races on the sand are extremely rare these days. Last year (2025) for example saw just two such races. Hence, unless there is a change in policy it seems unlikely that we are going to get many claiming races to go at.
All-Weather Favourites by Course
Have favourites performed any better at some courses compared to others? Let’s see:
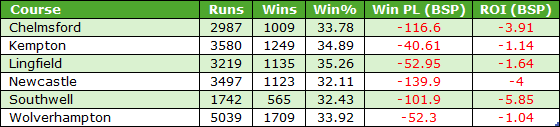

The Southwell stats are based on tapeta races, so only since the change of surface; it seemed to make no sense to combine the fibresand results with them as they are no longer relevant. Southwell’s stats are the worst for favourites with losses edging close to 6p in the £. Wolverhampton has been the happiest hunting ground for jollies closely followed by Kempton.
In terms of Wolverhampton favourites, a group that have performed well are those runners who won last time out on the AW but at a different track (e.g. at any of the other five UK AW tracks). This group recorded a £69.44 profit (ROI +12%) thanks to 239 winners from 581 (SR 28.9%).
All-Weather Favourites by Time of Year
I would like to talk about ‘time of year’ now and below are the win strike rates by quarter:
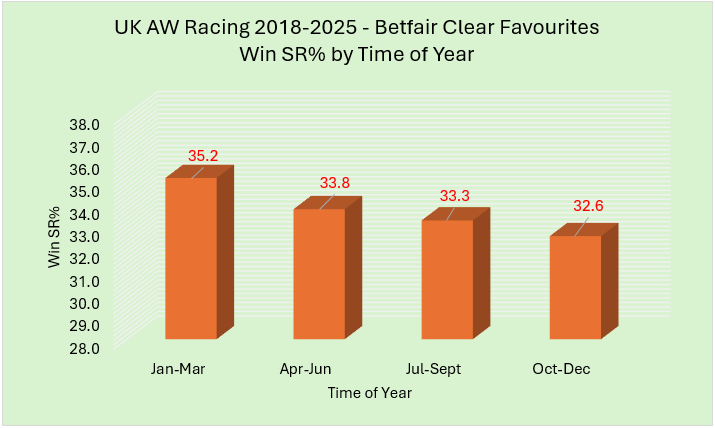

Favourites have had the best strike rate in the first three months of the year, and the remaining metrics correlate with that time being the best for favs:
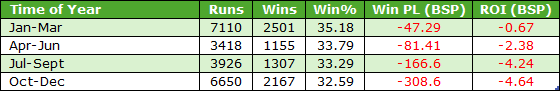

As we can see, January to March favourites would have lost us less than a penny in the £ across over 7000 selections. I am assuming this has been the case because at that time of year 91% of all favourites had raced on the AW last time out, whereas from July to December for example this figure has been less than 60%. Hence, by the start of the first quarter (January) the focus is solely the AW with it being nearly two months into the AW season, and horses are starting to run regularly on an artificial surface rather than potentially switching back and forth from the turf. That would also explain the poorer returns in the final quarter. That is simply a hypothesis but there is a definite logic behind it.
Sticking with that first quarter, we have already seen that Wolverhampton market leaders have returned the smallest losses. If we restrict Wolves favourites to January, February and March only we see the following – 586 winners from 1604 runners (SR 36.5%) for a profit of £96.53 (ROI +6%).
All-Weather Favourites by Class of Race
A look at Race Class now. The splits are shown below:
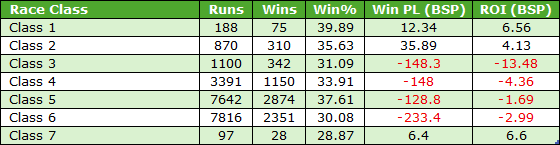

The highest two classes of race have proved profitable, but what is more interesting perhaps has been the very poor performance of favourites in Class 3 races. The losses have been significant at over 13p in the £. Most Class 3 events were handicaps, and handicaps actually produced losses close 15p in the £.
My initial theory for why favourites performed poorly in this class was that is may just be down to variance, but I back checked the 2010 to 2017 Class 3 results and noted that they produced similar overall losses (11p in the £). I cannot come up with a logical reason why favourites have struggled in these particular races, but the long-term stats suggest that this has been the case.
All-Weather Favourites by Days since last run
Moving on to how long it has been since the horse last ran, and there have been a couple of timeframes that have proved profitable over the past eight years:

Hence favourites having a very recent run, or one coming back off a break of 5 months or more have performed above the norm.
All-Weather Favourites by Headgear
Personally I am a little sceptical when it comes to fancied runners wearing headgear and favourites have had a poor record wearing blinkers over this period. They scored 27.2% of the time (382 wins from 1405) for losses of £168.40 (ROI -12%). This performance was worse if we focus on handicaps only – 305 wins from 1203 runners for a loss of £164.90 (ROI -13.7%).
All-Weather Favourites by Draw
I wondered how well favourites fared from the poorest draws, although I knew that data for specific course and distance combinations was going to be limited. What I wanted to know is how favourites fared when berthed in one of the three widest draws at Kempton over 6f, Wolves over 5f and Chelmsford over 5f. I currently perceive these three track/trip combos to offer the strongest AW biases - and, from a positive perspective, to inside draws, I should add. I looked at handicaps only as they offer the most robust results as far as draw data is concerned.
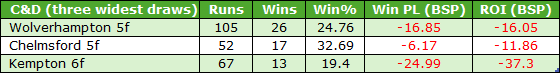

We're dealing with small samples here as I had anticipated, but all three confirm that favourites really struggled.


One other draw bias which I looked at was Kempton over 7f, but my reading of that bias is that horses need to be drawn very wide (in double figure stalls) to be really disadvantaged there. Hence, I looked at the performance of favourites from the three widest draws over 7f at Kempton with the caveat that the draw must be a double figure one. With such restrictions there were only 30 horses that were favourite under those circumstances, but they did struggle with only 5 winning and losses were steep at 46p in the £.
All-Weather Favourites by Trainer
Finally I wanted to see which trainers have done well with favourites and which ones have not. Firstly, let me share a chart of the trainers whose A/E index (based on BSP) is 1.15 or higher. This type of figure suggests their favourites have been very good value. To qualify, a trainer must have had at least 75 horses that started as favourite.
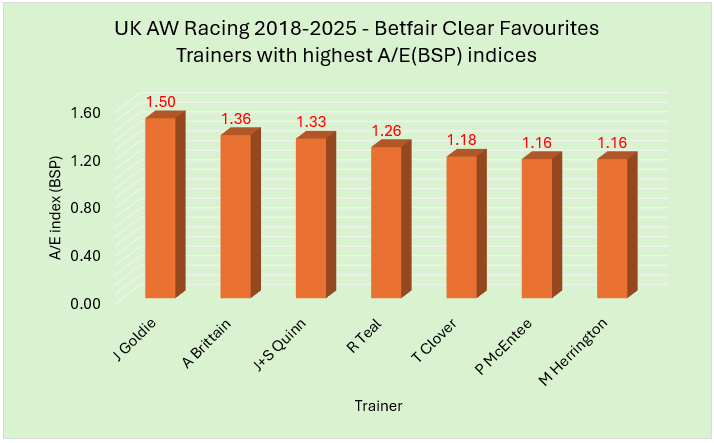

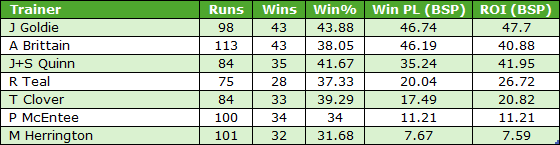
It is nice to see some different trainers appearing and indeed it makes sense that less familiar names would show up when looking in such an obvious place as market leaders. Jim Goldie tops the chart with an outstanding 1.50 A/E index and all seven on the chart have unsurprisingly been blindly profitable as the table below shows:
Not all trainers have done well when saddling the market leader, though. The table below shows the handlers that had recorded losses of more than 25p in the £ (again 75 runs minimum to qualify).
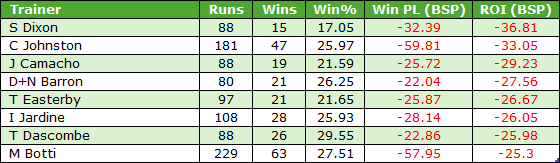

The most interesting name in the list for me is Charlie Johnston; his father Mark had a very good record with favourites at the start of this time frame. From 2018 to when he retired at the end of 2022 his record with favourites read an impressive 144 winners from 331 (SR 43.5%) for a profit of £54.25 (ROI +16.4%), A/E(BSP) 1.13. There has been a clear change in success for favourites since Charlie took over, perhaps as a result of a different focus or training modus operandi.
Conclusion
This article has highlighted plenty of positives and negatives. I have put the main ones in the table below as a type of ‘ready reckoner’. I have excluded the trainers as their tables are nearby and easy to access.
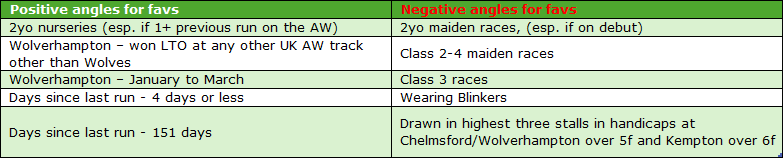

I hope this article will prove useful over the rest of the AW season as well as the remainder of 2026 as a whole. Obviously, we cannot always tell who is going to be favourite, especially in very competitive races. However, if we are able to back as close to the off as possible then we should know the favourite pre-race around 95% of the time.
- DR