Jockey Profiles: Blackmore, Kennedy, Townend
This is the third article in a series looking at the performance of some of the top National Hunt jockeys. Parts 1 and 2 can be read here and here. For this piece I will be heading over the water to examine the stats of three of the top Irish jockeys - Paul Townend, Jack Kennedy and Rachael Blackmore.
I have analysed NH data for racing from 1st Jan 2016 to 31st Oct 2023 with the primary focus being their respective records in Ireland. However, at the end of each jockey’s section I have shared a selection of their UK stats.
As with the first two articles the Geegeez Query Tool has been my ‘go to’ for data collection, and I have sourced further insights from the Geegeez Profiler to help with certain parts. Profits and losses have been calculated to Industry SP, but I quote Betfair SP where appropriate. All tables include A/E indices, and when any data has been pulled from the Geegeez Profiler Tool, I also share the PRB figures (Percentage of Rivals Beaten).
Let’s start with Paul Townend.
Paul Townend Overall Record
Below is Paul Townend’s Irish record across all runners during the study period:
![]()
A strike rate of better than one in four is comfortably the best we have seen so far in this series. The PRB of 0.66 is very high and the A/E index of 0.93 is comfortably above the average figure for all jockeys which stands at 0.87. Losses of nearly 16p in the £ to SP are a note of caution, however; to BSP this loss is reduced to just under 3p in the £.
Of course, Townend's overall win rate is so good because he rides primarily for the behemoth Willie Mullins yard – just over 65% of his total Irish rides have been for Mullins during this time frame. Below is his record with Mullins compared to all other trainers combined:

As we can see it is a staggering 34.2% strike rate when riding for Mullins in Ireland compared with 12.1% for all other trainers.
Paul Townend Record by Year
Yearly stats are my next port of call. Here is a breakdown by both win, and win/placed (Each Way) percentage / Strike Rate (SR%):

This graph is unlike any graph we have seen to date in this series. However, this is because in 2016 and 2017 Townend rode 239 times for Mullins but 534 times for other trainers. Since 2018 he has ridden 1443 times for Mullins and only 356 times for other trainers. Indeed, in 2022 and 2023 he has had 488 rides in total of which 475 have been for Mullins: just 13 for other trainers. As we have already seen, more rides for Mullins means better strike rates.
Paul Townend Record by Betting Odds / Price (SP)
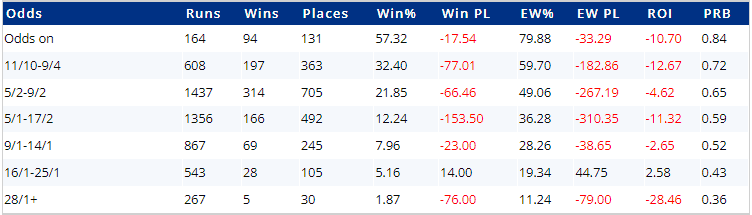
A look next at his results by splitting them into different price bands:

The prices to concentrate on seem to be the shorter priced ones. Townend has almost broken even to SP with horses priced 13/8 or shorter. To BSP these runners would have made a small £21.10 profit (ROI +2.8%). Horses at the other end of the scale (16/1 or bigger) should be avoided if these past results are anything to go by.
Paul Townend Record by Race type
It is time to see if Townend’s record is better in chase or hurdle races:

He has ridden in far more hurdle races than chases, but his chase record looks slightly superior. When riding a clear favourite in a chase he has secured a strike rate of 54.3% (182 wins from 335) for an SP profit of £31.25 (ROI +9.3%). To BSP this increases a little to +£47.17 (ROI +14.1%).
Paul Townend Record by Racecourse
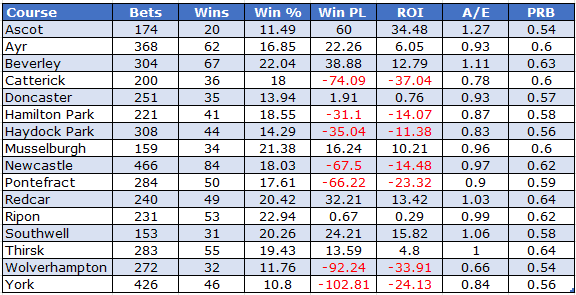
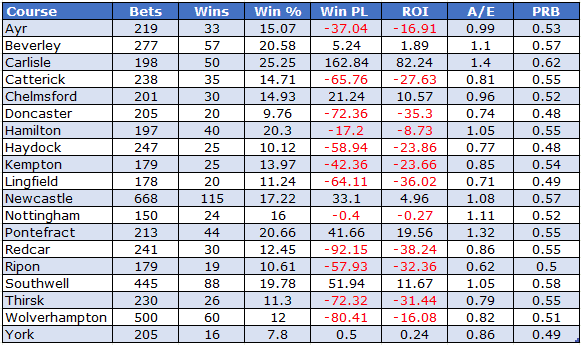
I am now going to look at all courses where Townend has had at least 100 rides. The courses are listed alphabetically:

His strike rate at Navan is modest by Townend's own standards but, thanks to a few double figure priced winners, he has edged into profit there. At Galway his stats are relatively poor, but Galway does stage highly competitive racing which could at least partially explain the figures. In contrast, the Tramore data are exceptional, hitting close to 40% of winners and showing excellent profits and a huge PRB figure of 0.75. For the record, in 2020 he won 8 of his 12 rides at the track and in 2022 won 8 out of 10.
Paul Townend Record by Run style
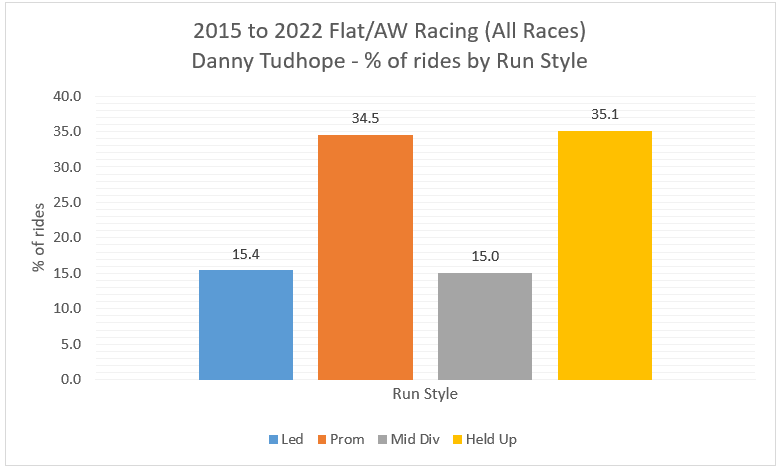
Time to look at an area that is still undervalued by some punters namely run style. Here is a breakdown of Paul Townend's run style performance in terms of win strike rate across ALL races:

This breakdown shows one of the strongest front running biases I have seen. A strike rate of 44% is mind-blowing. If you had been able to predict pre-race which of his horses went into an early lead you would have secured an SP profit of £40.60 (ROI +7.6%). Contrast that with the returns on all hold up horses, which would have produced significant losses of £197.00 (ROI -30.3%).
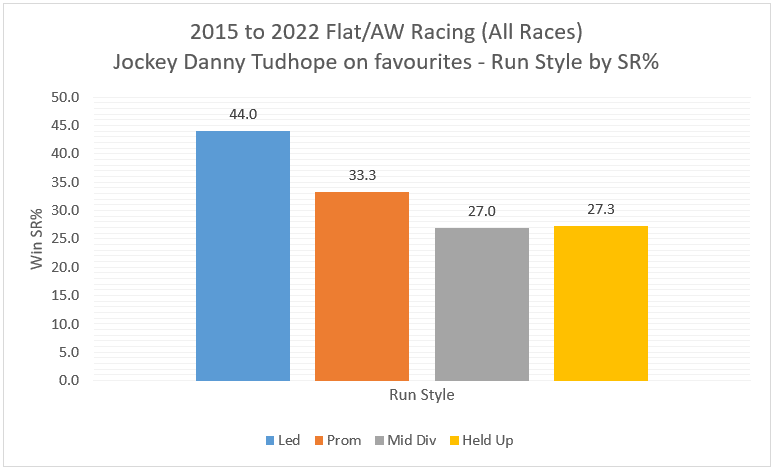
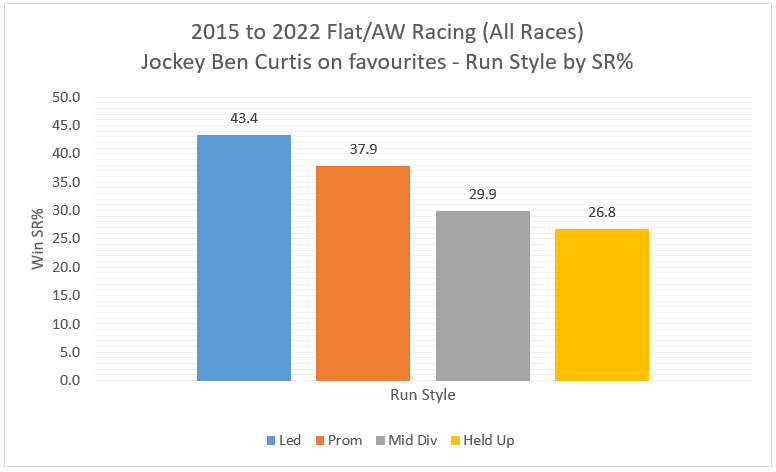
Let me also share his run style record when riding the favourite:

Front running favourites have produced outstanding results with prominent-racing favourites outperforming the other two groups.
Paul Townend UK data
Before moving on to our next jockey, let me take a quick look at Townend’s record in the UK. Overall, he has had 221 rides of which 38 have been successful meaning his strike rate has been 17.2%. (179 of his 221 rides have been for Mullins). His strike rate is lower here compared to Ireland as two thirds of his rides have come at Cheltenham with the majority of those being at the Festival. His Cheltenham strike rate is exactly 17% and you would have made a 10.7% profit if backing all his rides at the track. He is a rare visitor to tracks away from Aintree and Cheltenham, but at Perth he is 4 from 9 (SR 44.4%) for a profit of £5.50 (ROI +61.1%).
Possibly the most interesting UK stats are related to market position. Backing Townend on favourites would have lost you nearly 22p in the £; backing him on second favourites this worsens to losses of over 64p in the £. However, if backing runners from outside the top two in the betting you would have made an SP profit of £49.00 (ROI +41.5%).
*
Jack Kennedy Overall Record
Jack Kennedy’s record across all Irish races is as follows:
![]()
Kennedy is close to hitting 17% in terms of win rate, with a slightly above average A/E index and a decent PRB figure. Losses have been around 20p in the £ to SP which is still some way below the average. To Betfair SP you would have turned that loss into a small profit of £112.36 (ROI +4.2%). However, one big-priced Betfair winner (168.49) is responsible for that.
My next port of call is looking at his yearly figures.
Jack Kennedy Record by Year
Below we see the yearly breakdown by strike rate - both win, and win/placed (Each Way):

In general, we have seen an uptick in the past four years with 2020, 2022 and 2023 seeing win percentages more than 20%. 2021 looks disappointing from a win perspective but the each way figure suggests he was perhaps a little unlucky that year. This was also the year when his main trainer, Gordon Elliott, was suspended for six months, which is surely a contributory factor.
While discussing each way stats they have also been much stronger since the start of 2020.
Jack Kennedy Record by Betting Odds / Price (SP)
I would like to look at the market now and I am splitting results up by the same Starting Price bands as earlier:

The shortest price band (Evens or shorter) have actually nudged into a miniscule profit. Horses priced 4/1 or shorter have completely outperformed those 9/2 or bigger when looking at returns and A/E indices. To BSP, horses priced 4/1 or shorter have made a small profit to £1 level stakes of £30.21 (ROI +3.2%). Overall, it looks worth avoiding bigger priced runners ridden by Kennedy.
Jack Kennedy Record by Race type
Under the microscope next comes Jack's record in hurdle races and chases.

We have a very similar set of figures for both race types. However, it is worth splitting the hurdle stats into handicap versus non-handicaps. In non-handicaps his strike rate has been 21% with SP losses of 11p in the £; in handicaps the strike rate drops to under 10% (9.1%) with losses of 40p in the £. To BSP non-handicaps have made a profit of £214.60 (ROI +18.1%), handicaps have still made a significant loss of £187.96 (ROI -28.1%).
Jack Kennedy Record by Racecourse
It is course data next for Kennedy. As earlier, 100 runs at a track is the cut off point for the table:

Kennedy has crept into profit at just Down Royal thanks mainly to an excellent strike rate of over 28%. He has a very good record on favourites at this track winning on 20 of the 31 of them. Not only that, of the other 11 he has finished placed on nine. Backing all Kennedy-ridden favourites at Down Royal would have yielded an SP profit of £10.45 (ROI +33.7%). To BSP this nudges up slightly to £11.69 (ROI +37.7%).
Jack Kennedy Record by Trainer
Nearly 80% of his rides have been for Gordon Elliott and their record together is much stronger than when we combine Kennedy with all the other trainers he has ridden for. Here are those splits:

It is interesting when we revisit the Down Royal stats in terms of trainers. When teaming up with Elliott, Kennedy is 35 from 96 (SR 36.5%), all other trainers have provided just one win from 20.
Jack Kennedy Record by Run Style
Let me look at the run style splits next starting with win percentages:

His front running record is excellent and if you had been able to predict pre-race which of his horses went into an early lead you would have secured an SP profit of £61.57 (ROI +21.5%). Conversely, backing all hold up horses would have seen huge losses of £314.42 (ROI -51.3%).
Let me also share his run style record when riding the favourite:

It is the same powerful message that we have seen numerous times before. It is remarkable to think that front-running favourites have been twice as successful as held up favourites in terms of win percentage.
Jack Kennedy UK data
Before moving onto Rachael Blackmore, a quick look at Kennedy's UK stats. He is not a regular visitor and comes primarily for the big two festivals at Cheltenham and Aintree. His overall UK record reads 17 wins from 123 (SR 13.8%) for an SP profit of £45.31 (ROI +38.8%). He has had three winners priced between 20/1 and 25/1 which skew the profit figure somewhat. At Cheltenham he has had 11 wins from 76 (SR 14.5%), while at Aintree he has won 4 races from 25 rides (SR 16%).
*
Rachael Blackmore Overall Record
Rachael Blackmore burst to prominence in 2021 when she not only won the Champion Hurdle at Cheltenham but she also became leading jockey at the Festival, a month before being the first female jockey to win the Grand National, on Minella Times. A year later she repeated her win in the Champion hurdle and followed it up with success in the Gold Cup: it is quite a CV she is building. I will look at her UK stats at the end of this section, but let me start with Irish data and her overall record there:
![]()
Her overall figures look moderate, especially when comparing them to the other jockeys we have looked at to date in this series. However, to BSP losses have been massively reduced to just 3p in the £ rather than 23p. We do need to examine her yearly stats as they will paint a clearer picture.
Rachael Blackmore Record by Year
Below we see her yearly breakdown by strike rate - both win, and win/placed (Each Way):

As you can see, she started from a very low base in 2016 winning less than 7% of the time. Compare that with the improved record from 2018 which coincides with getting more rides for trainer Henry de Bromhead. 2021 was her best year in terms of both win and each way strike rates.
Rachael Blackmore Record by Betting Odds / Price (SP)
Time to examine different price bands to see if any patterns emerge:

We see a similar trend here to both Townend and Kennedy, where shorter priced runners have been better value. Horses sent off at evens or shorter have made a profit, albeit only just. Once the prices hit 9/2 or bigger the results are relatively modest.
Rachael Blackmore Record by Race type
It is chases versus hurdles next:

The returns on investment (ROI) for each group are within 1% of each other. She has a better SR% in chases, but this is more down to field size than anything else (average field size in hurdle races is bigger than in chases).
Rachael Blackmore Record by Racecourse
Splitting Rachael's results up by course next. 100+ rides again to qualify:

Just one course has seen a strike rate higher than 20% which is Naas, standing at 23.8%. Blackmore has made decent profits there, too, and her A/E index of 1.31 is also excellent. She has had winners at 25/1 and 22/1 at Naas, but she has made a solid profit with shorter priced runners, too. Indeed, focusing on Naas runners from the top two in the betting, you would have been rewarded with 22 winners from 50 (SR 44%) for an SP profit of £16.98 (ROI +34%). Tipperary has edged into profit, and she has a good record on favourites there (13 wins from 28) returning 19p in the £ to SP. Her overall record at Downpatrick has been poor in comparison, although there have been better signs in the past two years with 4 wins from 24 (SR 16.7%).
Rachael Blackmore Record by Trainer
Henry de Bromhead has provided just under half of Blackmore’s rides during the period of study, but that figure is around 70% when we focus in on this year 2023. There are three other trainers that she has had at least 75 rides for and has ridden for them this year - they are also in the table below:

Her strike rate when teaming up with de Bromhead is good and the partnership would have made a blind profit to BSP, although those profits were accrued over 2018 and 2019. At Naas Blackmore and de Bromhead have combined to win 23 of their 71 starts (SR 32.4%) for a healthy SP profit of £76.04 (ROI +107.1%).
Rachael Blackmore Record by Run Style
The final main Irish section focuses on Blackmore and her run style stats.

Front runners would have yielded excellent returns of 28p in the £ if you had predicted their run style pre-race. Compare that with losses for both mid-division runners and hold up horses who both would have lost a whopping 46p in the £. Front runners for de Bromhead have won just over 30% of the time when Blackmore has been on board.
Now favourites split by run style:

As with the ‘all runners’ stats, front-running favourites would have proved profitable while hold up/midfield favourites would have lost 37p and 42p in the £ respectively.
Rachael Blackmore UK data
Earlier I mentioned some of Rachael's successes in the biggest UK races so let us look at her overall record in this country:
![]()
These are very solid figures considering 45% of her UK rides have come at the Cheltenham Festival. Her Festival record is similar to her overall UK record with a 16.1% SR% and positive returns of almost 15p for every £1 staked. However, it should be noted that a Festival winner in 2019 was priced at 50/1 and this skews the overall figures somewhat.
When Blackmore has been on a favourite in the UK her record reads an impressive 11 wins from 25 (SR 44%) for a profit to SP of £10.88 (ROI +43.5%). Indeed, when riding second favourites her record has also been positive – 10 wins from 32 runners (SR 31.3%) for a profit of £8.33 (ROI +26%). At the Cheltenham Festival she is 12 from 26 (SR 46.2%) when combining her rides on horses first or second in the betting for an SP profit of £15.16 (ROI +58.3%).
20 of her 30 winners have come for de Bromhead, while her rare trips to Huntingdon have seen three winners and a second from four rides. Finally, her record in Grade 1 events has been excellent, hitting 20% success rate thanks to 14 winners from 70.
Main Takeaways
Paul Townend (Irish racing)
- He has an excellent 34% strike rate for Willie Mullins.
- Horses priced 13/8 or shorter have provided the best value.
- Townend has a strong record when riding a favourite in a chase.
- He has a good record at Tramore but has struggled a little at Galway.
- Townend has an exceptional 44%-win rate on front runners.
Paul Townend (UK racing)
- Runners outside the top two in the betting have provided by far the best value.
- He is a rare visitor to Perth, but he has a good record from his handful of rides.
Jack Kennedy (Irish racing)
- Horses priced 4/1 or shorter have provided the best value, especially those priced Evens or shorter.
- Kennedy has a good record in non handicap hurdle races. Conversely his record poor in handicap hurdle contests.
- Kennedy has a good record at Down Royal on all price bands. This includes favs where his record is very strong.
- As with Townend he has very strong record when riding front runners.
- His record on favourites that are held up early in a race is poor.
Rachael Blackmore (Irish racing)
- Horses priced Evens or shorter has edged into profit. Horses priced 9/2 or bigger have proved to be relatively poor value.
- Blackmore has a very good record at Naas, especially when the horse comes from top two of the betting. Also, when riding for De Bromhead her record at Naas has been excellent.
- She has done extremely well at Tipperary when riding the favourite.
- She is a solid record on front runners both when favourite and when not favourite.
- Favourites that race mid division or further back early in the race have a very poor record (when comparing them to all favs).
Rachael Blackmore (UK racing)
- Has an excellent record on favourites.
- At the Cheltenham festival she has an outstanding record on either favs or second favs.
- She has a strike rate of 20% in Grade 1 events which is roughly double the average figure for all jockeys.
-------------
So, there you go! Our trip over the Irish sea is completed. Next time, it’s back to the UK.
- DR