Jon Shenton: Heading Further Leftfield
This is the second of a two part article. In the first piece, which can be found here, I highlighted a number of training operations worthy of a second glance if their horses ran well enough last time to finish in a placed position.
This follow-up will explore the other side of the equation: trying to find those trainers whose horses perform well after a moderate or disappointing run, specifically having finished unplaced last time out (LTO).
The Leftfielders
You may recall I named this group of trainers the “leftfielders” for what are obvious reasons, hopefully. In basic terms, these yards appear to deliver a winner seemingly irrespective of whether the horses ran well last time out or not. In the same format as that last article, the table below covers National Hunt handicap runs from 1st Jan 2012 where horses have had a starting price of 20/1 or shorter.

The data is split by trainer, showing performance by horses that placed last time out (left hand block) and horses that were unplaced LTO (right hand block). This table of leftfielders is sorted by the variance in performance between the two separate datasets. In this case it’s showing the yards who are exceeding market expectation with their runners who were unplaced in their last race.
And here is the same info represented graphically (using A/E).

I find some of this data striking. All these yards outperform market expectation with runners that had a moderate/unplaced last run. That’s certainly interesting, however, the real insight for me is the variance in comparison with their in-form runners.
Perhaps it’s labouring the point but if we take Joanne Foster’s data, the A/E of her placed LTO animals is 0.55 (based on market evaluation of 8 wins from 86 runs) and the A/E of her unplaced equivalent is 1.48 (based on 26 wins from 157). That's a variance of 0.93 in A/E performance between the two datasets. The graph shows the scale in difference with the Keevil, Stronge, Coltherd, Dalgleish and Spearing yards all showing notable deltas between their placed & unplaced performers.
Another way of appraising the data is by analysing strike rate. The graph below illustrates the same dataset but by winning percentage across the placed/not placed variants.

Here we can see that not only do these trainers beat the market with their unplaced last time entries, but their strike rates are at least comparable with their more in-form (as measured by last day placing) charges. In other words, last time out finishing position is less relevant for these yards. Taking the Foster yard again, a horse placing LTO prevails in its next race 9.3% of the time, compared to 16.56% for those unplaced last time. Whichever way you look at it, that’s a big difference and should be ripe for punting angles.
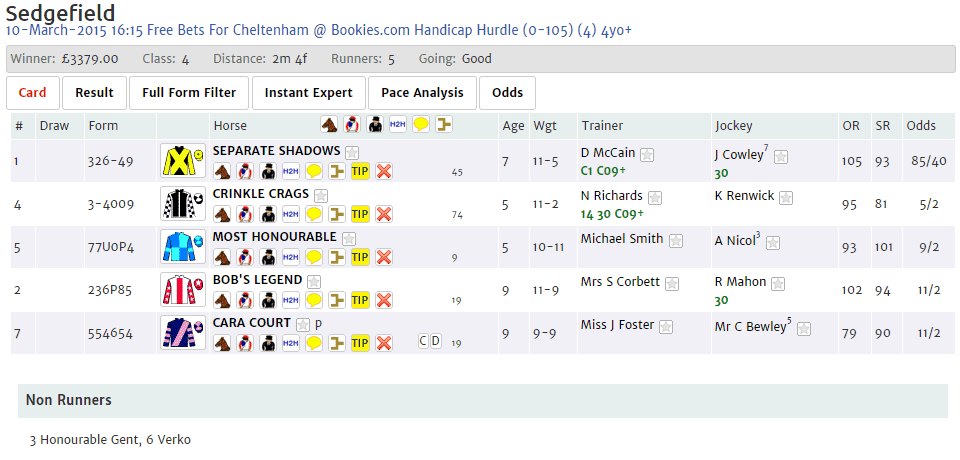
Let’s zoom in on the Joanne Foster data as a case study. The Yorkshire-based stable is another small, focused outfit. Exactly the sort of yard that I like to follow. Having had a total of 39 winners from 407 runs in National Hunt racing (since January 2012) the ability to track the stable runners and performance closely should be attainable. Incidentally, nearly a quarter of the yard's runs have been at Sedgefield (15 wins from 97 with a ROI of 0.1% at starting price) so entries at that track from Foster should always be noted.
Returning to the placed/not placed data, there are three aspects of the Foster yard that I think can be drilled down upon to make the healthy starting point of her overall unplaced LTO data (27 wins from 156, A.E 1.48, ROI 33% to SP) potentially even more profitable. They are starting price, going and days since last run.
There are three data tables below showing the splits:


The reason that I’ve shown the three separately with the same data (the 27 wins from 146 runs) is that if we'd gone through sequentially it could seem like a heavily back-fitted approach. By keeping the larger data set and analysing the variables against that broader info we can be slightly more confident that the data is indicative of a general trend in performance.
The numbers outlined by the red border in the tables show moderate performance, which I’m happy enough to remove from the equation. Horses returned at an SP of 17/2 or greater have a 5-from-90 record losing 19% of funds overall; while horses running on “non-winter ground” have a 5-from-56 record, and those having had more than 45 days off the track are a wretched 1-from-32. All of these 'chuck outs' are rational and explainable too.
Removing the red border runners gives us:

A very small micro angle – but a high strike rate (39%), A/E at 2.53 and 166% ROI. One of the reasons I’ve laid out the components is that the angle is probably strong enough for you to choose which elements or not you’re comfortable including or excluding. For me, I’m going for it, this is in my systems portfolio until further notice!
Back Joanne Foster runners at 8/1 or less, on Good to Soft or softer where the horse has run within the last 45 days
I could go into more detail on any of the trainers on the master table at the start of the article hunting for micro angles! After all, there are some massive names on there (Gordon Elliott, and Anthony Honeyball of this parish, to name but two). However, the key message is that all these yards have a propensity to deliver irrespective of a low-key last run by one of their charges.
When trying to unpick a handicap race we all like the comfort blanket of a nice recent run for our potential wagering proposition. But over the past year or so my mentality is changing / has changed and I take my comfort from data such as this instead.
Finding a horse from one of these yards that I like and which bombed LTO gives a ripple of excitement, after all I think I know something that the punting masses generally don’t. Naturally, it doesn’t always work and clearly an unplaced run LTO can be a symptom of a horse with limitations or being out of form rather than an off day. Nobody said it was easy!
Like Shelling P's
As I’ve been writing this, looking out of the window on another frosty Leicestershire morning, something else has occurred to me. As an extension of the theme I’ve been wondering if there are some of the training establishments whose horses bounce back specifically from being pulled up in their last run.
My hypothesis would be that some trainers could offer instructions to the jockey to pull up more readily than others (it could of course be the jockey too), or that they are more inclined still to run a horse when the weather conditions have gone against the horse, or, well, for any number of other reasons. Regardless of reason or theory, it’s worth a quick look.

Now isn’t that interesting? The table shows trainers where a horse was sent off at an SP of 20/1 or less and had pulled up in its previous run. To qualify for the table an A/E of greater than 1.00 is required.
There are some National Hunt behemoths on here: Nicholls, Henderson, Tizzard and Hobbs for example. It does make sense to an extent. They generally house animals with greater talent so you’d expect them to be more capable of bouncing back after a bad run in comparison to other stables. It does appear, though, that the market might not always fully factor that in. That’s perhaps understandable; after all backing a horse with a P as its latest entry on the form-line requires a degree of bravery. However, in general terms there will be value plays where these trainers listed in the table are in the game.
The clear leader here is David Pipe so let's have a look at his data in more detail.
31 wins from 161 runs, A/E 1.75 and ROI of 62%.
We could leave it there, that’s strong! But let’s check a bit closer anyway.
Here is the distribution by starting price.

A bias towards the shorter end of prices here, it appears as though we are on relatively safe territory ignoring all runners at 12/1 or greater, where a combined record of 3-from-65 and a £20 loss to a £1 level stake is persuasive enough for me. That leaves the following consistent performance over several years (notwithstanding the solitary runner in 2019 so far).

And Just like that another micro is added into my portfolio:
Back David Pipe runners sent off at 11/1 or less and which were pulled up in their previous run
Sometimes it can be that easy finding angles, other times I can sit for hours searching high and low for snippets worth exploring. I like this one though and am looking forward to seeing how it pans out over the coming weeks, months and maybe years!
That just about wraps up this edition. A final word, though. If you have any theories or hypotheses that you think might be worthwhile looking into please drop me a line, either via the comments below or on twitter
I can’t promise I’ll investigate everything but I’m sure there is some gold worth panning for in the collective minds of geegeez.co.uk subscribers / readers.
Speak soon!
- Jon Shenton
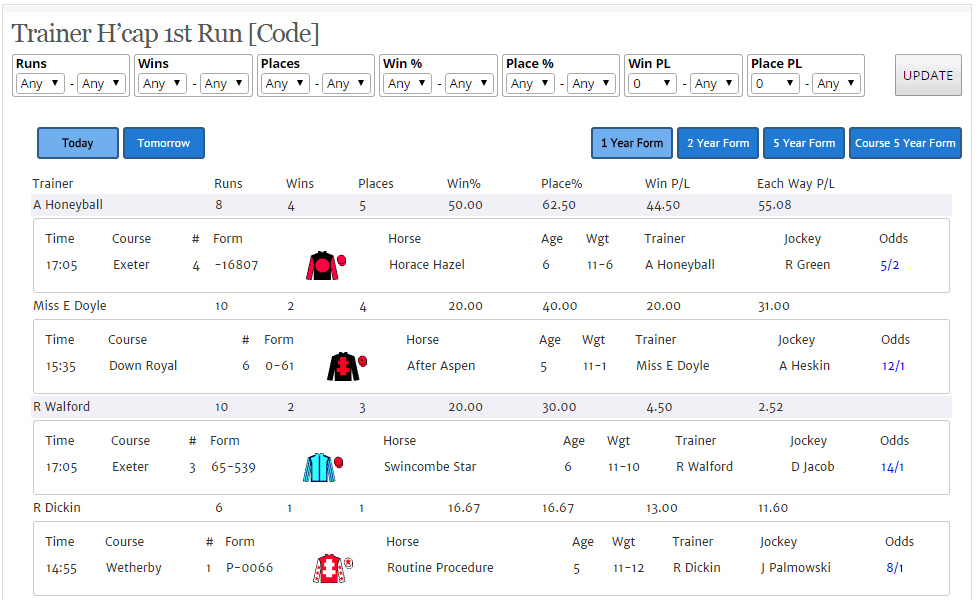
 Introducing the rather unsexy-sounding 'Trainer H'cap 1st Run [Code]' report. This report, found towards the bottom of your reports dropdown , shows all horses running in a handicap of that code (flat, hurdles, chase) for the first time today by the trainer's record with such types.