
Is there a way to profit from runners up?
I would be interested to know what punters look at first when analysing a race in order to potentially place a bet, writes Dave Renham. Clearly there are many different options. The first thing I look at is run style / pace to see if the course and distance has a bias or not. I am guessing I am one of a tiny percentage of punters that look at this aspect first.
However, I am fairly confident that a much higher percentage will look at recent form first, especially string of numbers (and letters) next to a horse's name, and more especially the finishing position last time out (LTO). Hence, in this article I will focus on LTO position. Now, I have written a few articles in the past on last time out winners, so I thought it would be interesting to look at last time out runners up.
Introduction
The focus for this piece is flat races, both turf and all-weather (AW). There is one further stipulation: that the LTO run when finishing second was also on turf / AW. I have analysed UK racing data from the beginning of 2021 to the end of July 2026 and profits / losses have been calculated to Betfair Starting Price (BSP) less 2% commission on winning bets.
Let me start by looking at ALL qualifiers, so every horse that finished second on their most recent start.
| Runs | Wins | Win% | BSP P/L | BSP ROI |
| 34634 | 6185 | 17.86 | -2090.43 | -6.04 |

We see a win percentage of close to 18% so a winner on average every five to six races. Blind losses backing all 34,000-plus qualifiers equated to around 6 pence for every £1 staked. To give some comparison, during the same time frame LTO winners lost around 3.3p in the £, while those that were third LTO lost 2.2p in the £. Based on these findings, it potentially looks like LTO runners up as a whole group have been overbet.
It's time to dig into these LTO runners up in more detail, starting with the betting market.
Market Factors
Below I am sharing the splits for different market rank positions based on BSP. The table shows the individual figures for Exchange favourites down to fourth in the betting, and then I have grouped those fifth or bigger together.
| Market Rank (BSP) | Runs | Wins | Win% | BSP P/L | BSP ROI |
| Favourite | 8597 | 2995 | 34.84 | -345.91 | -4.02 |
| 2nd fav | 6764 | 1420 | 20.99 | -214.49 | -3.17 |
| 3rd fav | 5104 | 743 | 14.56 | -200.32 | -3.92 |
| 4th in betting | 3968 | 451 | 11.37 | -65.11 | -1.64 |
| 5th+ in betting | 10201 | 576 | 5.65 | -1264.61 | -12.41 |
We see very similar returns for horses in the top three betting market slots, with those ranked fourth actually doing a little better. Once we get to fifth or bigger, losses start to increase considerably hitting over 12 pence in the £.
I now what to split the results into two BSP price bands – one from 1.01 to 20.0 and the other 20.01 to 1000. Here are my findings:
| BSP Price band | Runs | Wins | Win% | BSP P/L | BSP ROI |
| BSP 1.01 to 20 | 30543 | 6081 | 19.91 | -1187.11 | -3.89 |
| BSP 20.01+ | 4076 | 103 | 2.53 | -903.33 | -22.16 |
As we would expect, the vast majority of runners have been in the price bracket of 1.01 to 20.0. Based on the above, it makes sense to focus on this group as they have lost the least in terms of returns, and by some margin. Also, as regular readers will know, in my articles I usually put a price cap in place ignoring very big prices to avoid rogue winners that could skew smaller sample sizes. Hence, for the remainder of this piece, all LTO runner up stats shared will be based on those runners that started BSP 20.0 or less.
Handicap vs Non-handicaps
How about the race type of the current race? Handicap versus non-handicap? Here are the splits:
| Race type | Runs | Wins | Win% | BSP P/L | BSP ROI |
| Non-Handicap | 7765 | 2121 | 27.31 | -359.03 | -4.62 |
| Handicap | 22778 | 3960 | 17.39 | -828.08 | -3.64 |
There was a higher win rate for runners up in non-handicaps which is to be expected. In terms of returns with horses priced BSP 20.0 or less, however, there is roughly one penny between the two - but in favour of the handicappers.
Let me now look to see whether the LTO race type makes a difference. I am going to combine LTO handicaps / non-handicaps with the current race type. Hence, we have four combinations to analyse:
| Race type | Race type LTO | Runs | Wins | Win% | BSP P/L | BSP ROI |
| Handicap | Handicap | 20731 | 3631 | 17.51 | -612.38 | -2.95 |
| Handicap | Non-Handicap | 2047 | 329 | 16.07 | -215.7 | -10.54 |
| Non-Handicap | Non-Handicap | 6942 | 1910 | 27.51 | -439.35 | -6.33 |
| Non-Handicap | Handicap | 823 | 211 | 25.64 | 80.32 | 9.76 |
This table does make interesting reading. Around two thirds of all qualifiers have raced in a handicap having raced in a handicap last time out. Their figures are fairly solid looking at just less than 3p in the £ loss.
Runners in handicaps switching from a non-handicap LTO have done relatively poorly losing around 10.5p in the £. However, the most eye-catching stat is the horses racing in a non-handicap that raced in a handicap LTO. These runners have scored over 25% of the time for a profit that has returned close to 10 pence in the £. They also secured five winning years out of six and offered good value overall. If we look at the yearly A/E indices based on BSP, we can see that those five years produced value indices above 1.00.
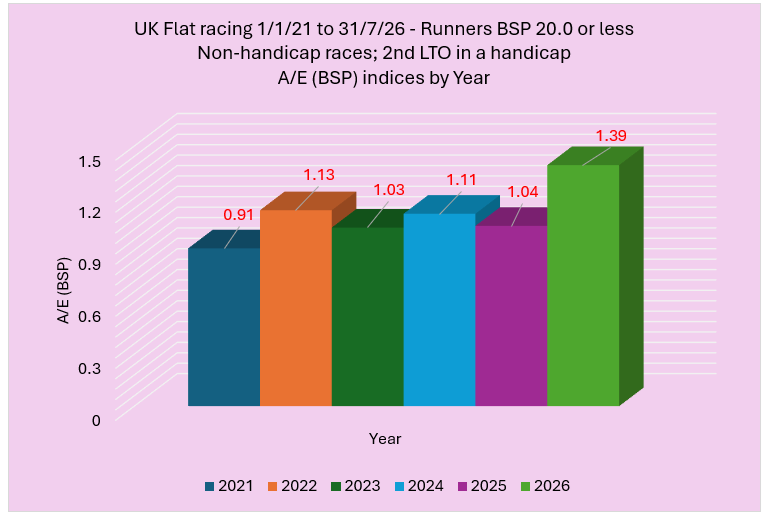
The evidence suggests therefore that runners up making the handicap to non-handicap switch require close scrutiny in the future.
I have one additional negative stat to share regarding the LTO race type, that being that those horses that ran second in a Group race LTO (Groups 1, 2 and 3 combined) lost over 12p in the £. Their full stats read 140 wins from 696 (SR 20.1%) for a loss of £85.51 (ROI -12.3%).
Race code
I want to look at race code in a similar way to how I split the handicap/non-handicap results by combining LTO race code (Turf/AW) with the current race code. Hence, once again we have four combinations to look at:
| Race code | Race code LTO | Runs | Wins | Win% | BSP P/L | BSP ROI |
| Flat Turf | Flat Turf | 14840 | 3001 | 20.22 | -675.6 | -4.55 |
| Flat Turf | AW | 3064 | 555 | 18.11 | -83.48 | -2.72 |
| AW | AW | 9972 | 1915 | 19.2 | -646.36 | -6.48 |
| AW | Flat Turf | 2667 | 610 | 22.87 | 218.33 | 8.19 |
We see that horses that came second on turf LTO did very well when switching next time to the AW. They produced very solid profits across over 2500 qualifiers. In fact, each individual AW course posted a profit / positive return over the period of study as the graph below shows:
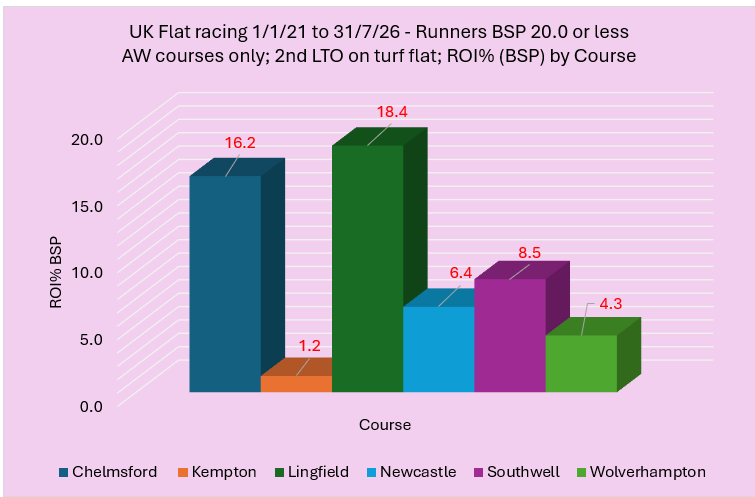
Whether we get racing again at Chelmsford any time soon is unknown, but with profits at all other courses hopefully this angle will continue to offer us an interesting avenue in the future. Before I move on, it is worth sharing that female runners switching from turf to the AW when second LTO outperformed their male counterparts.
| Sex of horse | Runs | Wins | Win% | BSP P/L | BSP ROI |
| Male | 1762 | 401 | 22.76 | 41.73 | 2.37 |
| Female | 905 | 209 | 23.09 | 176.6 | 19.51 |
When we look at the A/E (BSP) indices we see females have been far better value hitting 1.12 compared to 1.03.
LTO number of runners
I wondered if a second place finish in a very big field LTO would effectively be a ‘better’ effort than the same finishing position in a smaller field. It makes sense logically as the bigger the last time out field the bigger the PRB (Percentage of Rivals Beaten) figure for beating all bar one of the runners. The table below shows different LTO number of runner splits:
| Runners LTO | Runs | Wins | Win% | BSP P/L | BSP ROI |
| 2 to 6 | 5996 | 1165 | 19.43 | -314.61 | -5.25 |
| 7 to 10 | 15762 | 3120 | 19.79 | -630.02 | -4 |
| 11 to 14 | 7851 | 1592 | 20.28 | -294.07 | -3.75 |
| 15+ | 934 | 204 | 21.84 | 51.6 | 5.52 |
As the number of runners last time out increases, we see positive correlation with the strike rates and returns whereby both metrics improve with greater field size. As the table shows, races with 15 or more runners LTO have provided a small profit across the 934 races.
Distance beaten LTO
A look now at whether the margin of defeat LTO made a difference. If we look first at horses that were beaten by less than a length LTO when priced BSP 20.0 or less, we can see that the results are slightly better than the overall ones:
| Runs | Wins | Win% | BSP P/L | BSP ROI |
| 14494 | 3011 | 20.77 | -389.64 | -2.69 |
We see a small improvement in both strike rate and returns, although the differences are still fairly negligible. However, it is interesting when we split these ‘beaten less than 1 length LTO’ results by LTO race distance. I want to compare the results for races that were sprint races last time (5-6f) with those of 1m 3f or more:
| Distance LTO
(bt < 1 length) |
Runs | Wins | Win% | BSP P/L | BSP ROI |
| 5 to 6f | 5101 | 988 | 19.37 | -334.38 | -6.56 |
| 1m3f+ | 2081 | 449 | 21.58 | 33.9 | 1.63 |
I guess this is what might have been expected with it being easier to finish closer in races that are shorter, meaning a close second in a longer race would arguably be a ‘better’ effort. All in all, the numbers are suggesting that a close second LTO in races of 1m3f or more can be upgraded a little.
Age of horse
On to the ages of runners now to see if that provides any useful findings. Let me first share the returns (ROI%) for each of the different ages of runner.
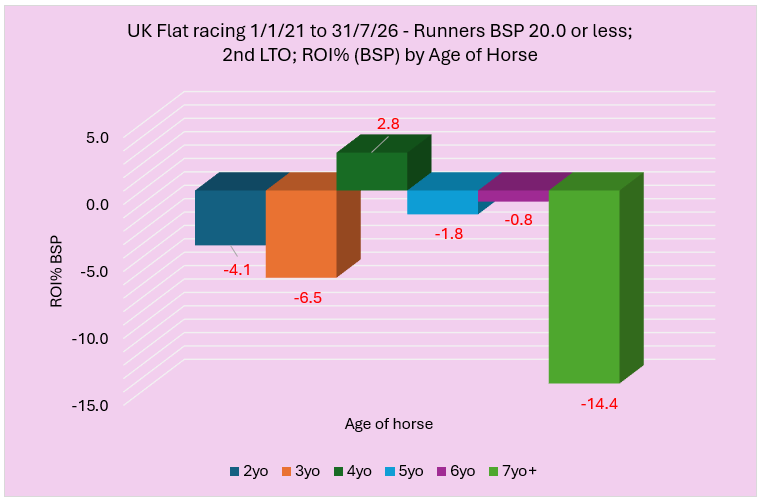
Four-year-olds snuck into profit, and 4yos to 6yos did fairly well; and combining all of these aged runners would have made a small overall profit. The most important thing to note, however, is the poor returns for runners aged seven-plus: losses of over 14p in the £.
In addition, 7yos+ when priced in the right BSP bracket have scored only 14% of the time, which equates to roughly one win in every seven.
The table below shows the complete set of metrics:
| Age | Runs | Wins | Win% | BSP P/L | BSP ROI |
| 2 | 4022 | 1009 | 25.09 | -164.99 | -4.1 |
| 3 | 10533 | 2272 | 21.57 | -685.37 | -6.51 |
| 4 | 6531 | 1270 | 19.45 | 184.89 | 2.83 |
| 5 | 4040 | 703 | 17.4 | -72.07 | -1.78 |
| 6 | 2438 | 403 | 16.53 | -20.3 | -0.83 |
| 7yo+ | 2979 | 424 | 14.23 | -429.26 | -14.41 |
Before moving away from age, 2yos who were second on their debut have performed relatively poorly next time out scoring 28.7% of the time (311 runs from 1085) for a loss of £109.45 (ROI -10.1%). Also, if that debut race was a novice race, then losses have extended further to -13.2% or 13p in the £.
Trainer Angles
What about trainers? Are some trainers more adept at getting a runner up to go one better next time? That does seem to be the case. Below is a graph showing the trainers with the best returns for runners priced BSP 20.0 or less. All trainers in the graph saddled at least 100 qualifying runners over this timeframe.
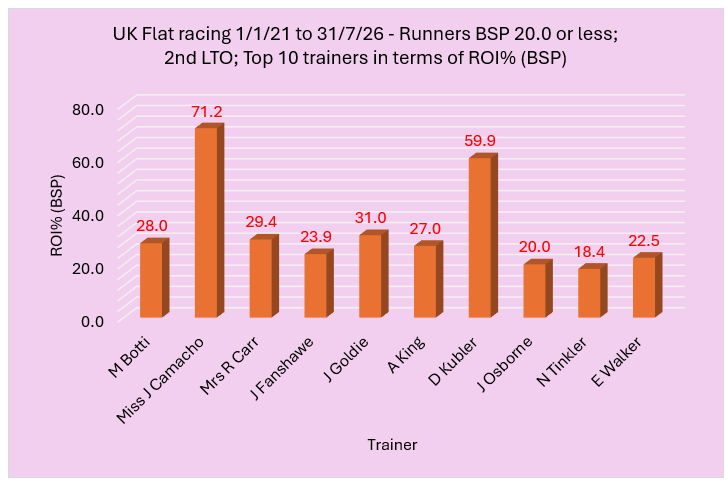
It is always good to see a mix of trainers in any top ten and especially when there are no real big guns either. Their full stats with runs, bets etc is shown below, along with the records of another 15 trainers. These 25 trainers in total have produced the best returns with these price qualifying runners-up. They are ordered by surname alphabetically.

| Trainer | Runs | Wins | Win% | BSP P/L | BSP ROI |
| M Botti | 212 | 52 | 24.53 | 59.28 | 27.96 |
| G Boughey | 446 | 119 | 26.68 | 29.71 | 6.66 |
| K Burke | 492 | 121 | 24.59 | 80.18 | 16.3 |
| Miss J Camacho | 144 | 36 | 25 | 102.51 | 71.19 |
| Mrs R Carr | 210 | 40 | 19.05 | 61.65 | 29.36 |
| J Channon | 143 | 37 | 25.87 | 12.12 | 8.48 |
| S+E Crisford | 296 | 78 | 26.35 | 32.32 | 10.92 |
| J Fanshawe | 234 | 70 | 29.91 | 55.82 | 23.86 |
| J Ferguson | 142 | 38 | 26.76 | 25.94 | 18.27 |
| J Goldie | 272 | 67 | 24.63 | 84.28 | 30.98 |
| W Haggas | 514 | 188 | 36.58 | 49.77 | 9.68 |
| R Hannon | 579 | 129 | 22.28 | 68.71 | 11.87 |
| M Herrington | 128 | 22 | 17.19 | 16.19 | 12.65 |
| R Hughes | 273 | 65 | 23.81 | 35.49 | 13 |
| A King | 126 | 30 | 23.81 | 33.97 | 26.96 |
| D Kubler | 121 | 31 | 25.62 | 72.5 | 59.92 |
| B Millman | 207 | 46 | 22.22 | 32.42 | 15.66 |
| W Muir + C Grassick | 119 | 21 | 17.65 | 18.07 | 15.19 |
| A O'Brien | 110 | 25 | 22.73 | 9.09 | 8.26 |
| J Osborne | 158 | 30 | 18.99 | 31.6 | 20 |
| K Ryan | 295 | 62 | 21.02 | 34.3 | 11.63 |
| Miss K Scott | 107 | 18 | 16.82 | 16.43 | 15.35 |
| R Teal | 125 | 25 | 20 | 19.56 | 15.65 |
| N Tinkler | 170 | 33 | 19.41 | 31.19 | 18.35 |
| E Walker | 260 | 71 | 27.31 | 58.5 | 22.5 |
Some good numbers there and here are a few additional stats to share:
- Marco Botti did best with his handicappers. They secured a return of over 52p in the £. Indeed, Botti had a higher strike rate in handicaps than non-handicaps with his qualifiers. An even better stat is that, focusing on his turf runners only, these won 31 of 98 races (SR 31.6%) for a massive profit of £84.32 (ROI +86%).
- Julie Camacho runners performed extremely well at distances of 5f to 7f. They won 28.1% of their races (29 wis from 103) for a profit of £94.18 (ROI +91.4%). She did equally well on turf as on the AW with returns on the turf standing at 71% and on the AW 72%.
- Daniel Kubler secured a profit in each of the six years. Also, his female runners performed brilliantly scoring 15 times from 41 (SR 36.6%) for a huge profit of £71.79 (ROI +175.1%).
- James Fanshawe enjoyed a very good record with horses that were just beaten LTO. Specifically, horses that were beaten by a neck or shorter (includes nose, short head, head and neck). This cohort went on next time to win 20 races from 53 (SR 37.7%) for a healthy profit of £31.46 (ROI +59.4%).
- Richard Hannon had an excellent record with horses aged five or older that were beaten into second LTO. These runners scored 34.1% of the time (15 wins from 58) for a huge profit of £55.08 (ROI +95%).
- William Haggas did well when his LTO runners up were in the top three of the Exchange market next time. Backing all 441 qualifiers would have yielded a profit of £71.09 (ROI +16.1%) thanks to 182 of them winning.
On the flip side we have a selection of trainers who fared poorly next time out with their runners-up. These are listed in the table below, again alphabetically. Trainers qualified for the table if their losses exceeded 20p in £ (ROI -20%).
| Trainer | Runs | Wins | Win% | BSP P/L | BSP ROI |
| R Beckett | 431 | 106 | 24.59 | -88.49 | -20.53 |
| Michael Bell | 217 | 43 | 19.82 | -49.27 | -22.7 |
| A Carroll | 539 | 81 | 15.03 | -126.71 | -23.51 |
| T Dascombe | 100 | 17 | 17 | -25.02 | -25.02 |
| M Dods | 296 | 45 | 15.2 | -66.75 | -22.55 |
| M+D Easterby | 223 | 28 | 12.56 | -54.96 | -24.64 |
| H Eustace | 107 | 16 | 14.95 | -50.03 | -46.75 |
| FR Fell + S Murray | 193 | 27 | 13.99 | -56.71 | -29.38 |
| C Fellowes | 162 | 28 | 17.28 | -37.51 | -23.15 |
| K Frost | 109 | 11 | 10.09 | -39.46 | -36.21 |
| I Jardine | 247 | 36 | 14.57 | -66.52 | -26.93 |
| C Johnston | 416 | 73 | 17.55 | -126.52 | -30.41 |
| W Knight | 144 | 23 | 15.97 | -33.41 | -23.2 |
| David Loughnane | 173 | 29 | 16.76 | -40.07 | -23.16 |
| M Attwater | 116 | 11 | 9.48 | -57.27 | -49.37 |
| P Midgley | 193 | 21 | 10.88 | -75.48 | -39.11 |
| H Morrison | 133 | 23 | 17.29 | -39.59 | -29.76 |
| J Portman | 172 | 27 | 15.7 | -43.97 | -25.57 |
| B Smart | 118 | 17 | 14.41 | -37.59 | -31.86 |
| M Usher | 115 | 16 | 13.91 | -24.87 | -21.63 |
| S Woods | 119 | 24 | 20.17 | -25.21 | -21.19 |
It is interesting to see such a contrast between certain trainers when it comes to horses that finished second LTO. The six trainers with the poorest ROI%s have been Attwater, Eustace, Midgley, Frost, Smart and Johnston
*
Summary: Positives and Negatives
Before I finish let me share the main positive and negative findings from the article in a table.
| Positives | Negatives |
| Non-handicap race; LTO 2nd in handicap
All weather race; LTO 2nd in turf race (especially female runners) 2nd LTO in race of 15+ runners 2nd LTO in race of 1m3f+ when beaten less than 1 length 2nd LTO when trained by Miss J Camacho, D Kubler, J Goldie, Mrs R Carr, M Botti, A King, J Fanshawe, E Walker, J Osborne |
Fifth or bigger in the Exchange market
BSP prices 20.01 or bigger Horses aged 7 or older 2yo runners; 2nd LTO when contesting a novice race on debut 2nd LTO when trained by M Attwater, H Eustace, P Midgley, K Frost, B Smart, C Johnston
|
That's all for this week. We have seen that last time out runners up can offer value in certain situations and, as usual, there are a few negative angles too, which hopefully will steer us away from some poor value bets.
Until next time...
- DR
Other Recent Posts by This Author:
- Ebor Festival 2026: A Statistical Overview
- Billy Loughnane: ‘The Kid’ in Numbers
- Course Topography: Uphill Finishes
- The Impact of Last Time Out Run Style
- Combining Pace and SR Ratings, Part 2





Leave a Reply
Want to join the discussion?Feel free to contribute!