
As 2025 ticked into 2026, somewhat without fanfare we filled the gaps in our UK sectional data coverage by incorporating the British RMG (Racing TV) tracks. Thus, going forwards as well as two years backwards, we have a full picture of all completed UK runs for each horse. [That is to say, we do not publish sectional data for runs in Ireland or where a horse failed to finish for any reason].
In support of this, I'm keen to bring greater utility to the dataset: put simply, and in line with other elements of the site like Instant Expert, I want you to be able to see 'the headlines' at a glance.
Being completely candid, I don't think we're there yet... though I do think this first iteration of the visualised data is a step forward. It is likely there will be changes to the current layout, and we'll certainly be adding a bit more oomph to the full result view as well. But, rather than damn it before I've even shared it, let me introduce you to a new block - live right now on site - within Full Form (Gold subscribers only, I'm afraid).
It's called, brilliantly innovatively, 'SECTIONALS', and it sits right underneath the current 'RACE FORM' section:


There it is, highlighted in the yellow box.
How Things Were...
Previously, we had a 'show sectionals' checkbox at the top of the RACE FORM block which spliced some traditional race data with some sectional data. Because I wanted to publish more of the latter, I've given it a home of its own. The CARD tab horse form retains the 'show sectionals' checkbox, for now at least.
Let's take a look at the new SECTIONALS block:

There's a fair bit to unpack here (awful phrase, that, isn't it? I'll never use it again... until the next time I forget), so let's get to it.
The left hand block, up to and including 'Race Speed vs Par / FS%' is consistent with the previous 'show sectionals' view within RACE FORM. In my opinion, there's a lot to be discerned from the running lines - a five chunk breakdown of a horse's position in the race and distance behind the leader (or in front if leading) - and I feel this is a vastly underused component of our profiling. It may be unfamiliar to UK form students but this is the de facto layout in North America for presenting past performance.
We can see for example from this horse's four consecutive wins (or, actually, first past the posts because he was disqualified and placed fourth in one of them) that he has some gate speed but is largely unhurried and makes his move late in the race; indeed, he hit the front only in the final split (from the furlong pole to the finish line in those five furlong races). The table below shows the furlong markers in the race, by distance, that each 'point of call'/ running line entry aligns with. The fifth and final point of call / running line entry is always the finish line.

As with anything new, it takes a bit of getting used to. Having spent plenty of time in the US form book across myriad Breeders' Cups, I find this layout a whole lot quicker to consume, and more accurate, than the (generally very good, but often subjective) in-running comments traditionally presented this side of the pond.
So far so yesterday. What exactly is new here?
Race / Runner Speed vs Par
The central block from the image above, 'Race Speed vs Par / FS%', is the pivot point. It's both old world and new, as we've given users the option of a text 'speed band' label (e.g. Q FAST) or a percentage quicker or slower than par (where par is our algorithm's projection of what a truly run race looks like in terms of energy distribution). Here's the more technical and granular 'Percentage' view of finishing speed - note the buttons above the table where you can switch from one to the other.

And here is the simpler version, itself very handy for at a glance analysis:

I deliberately left the final call point (finishing positiondistance beaten) of the running lines in the images - left hand side - so we could compare this horse's winning performances with the losing ones from a 'way the races were run' perspective.
There's a clear contrast here: his wins were achieved when the race speed (left hand trios of boxes) was even, and the defeats came off faster early tempos. We can see also, from the right hand trios of boxes, that this runner won when generally just even pacing his way through to the finish.
That is the most efficient way to run in any kind of race, be it a horse race (over five furlongs or in the Grand National), a 1500m track and field race, or in a Formula 1 Grand Prix (the latter pair in terms of lap times: humans, horses and cars go slower on bends than on straight bits; and faster downhill than uphill).
So, having found the suggestion of a pattern, the question is, "how will today's race be run?"
I'm not trying to tip a winner here, so that's academic for the purposes of this article; but our example horse is drawn wide today against a projected lone front runner and with a fair bit of inside pressure for the leader. That's a verbose way of saying that I'm not sure how exactly it will be run and/or whether it will suit our protagonist: on balance, I suspect not.
But he's a horse that could easily be added to a tracker on the basis of a perceived pattern of performance, and with a note saying something like "worth a bet when the pace looks even". For completeness, the horse in question is Hint Of Humour and the race (5.30 Wolv, 9th February) will have been run by the time this is published.
Sectional Times
Let's see what else has been added to the SECTIONALS view. We've added some time data, and some user configuration around that. Specifically, you can look at the race leader's times at each of three sections in the race, or the horse in question's times - and you can view either the time for each section or the incremental (i.e. total) time to that point.
In the example below, Hint Of Humour again, I have filtered for his Wolverhampton 5f form.

Look at how consistent his times have been. In the four races prior to his Boxing Day spin he completed the first quarter mile within a tenth of a second either side of 26.2 seconds; he then had slightly more variation in his middle furlong of five - but still only 0.4 seconds from quickest to slowest; and his closing two furlong splits ranged between 22.8 and 23.1 seconds: incredibly consistent speeds over an unvarying track/trip combination.
On that most recent run he went faster than ideal early, and was subsequently slower in the middle and closing furlongs. As it turned out he was only beaten half a length but that was having led at the furlong pole before tiring.
FS% Diff and UP
Moving a little further right, we have two more columns: FS% Diff and UP.
FS% Diff is the finishing speed difference for the closing section, in percentage terms, between the race leader and the runner in question. And, for completeness, finishing speed percentage is how fast a horse ran the last part of a race in comparison to how fast it ran the full race. You don't really need to know the formulas.

Concentrating on the image below now, hovering over the 0.76 figure in the view displays the Race (leader's) finishing speed percentage (97.62%) and that of this runner (98.36%).
98.36 / 97.62 = 1.00758 (or 0.76% FSP Diff).
Again, the calculations are merely for the curious. The implication of a positive number is that the runner in question finished more strongly than the leader at the start of the closing section; and, naturally, a negative number (none in this example) means the runner in question was slower to the finish than the leader at the start of the closing section.
All you need to know is:
Positive FS% Diff = quicker to the finish
Negative FS% Diff = slower to the finish

Finally, and with its title unhelpfully obscured, on the right hand side we have the UP column: it's the one with the numbers 4, 0, 1, 1, 3 in it.
UP is Upgrade, and it's our attempt to elevate the performance of some horses in some races based on how inefficiently they were ridden. The least efficient rides tend to get the biggest upgrades, the suggestion being that on another day that horse may be capable of better.
NOTE: an inefficient ride is not always a bad one. Consider the horse that makes all at a very fast pace and which scrambles home in front; its jockey has simply made the other runners (and their riders) even more inefficient. Everything is relative. It doesn't take the most efficient ride necessarily, sometimes it only takes the least inefficient one.
Again, the confusion is added by me. All you need to know is that there is the suggestion a horse could offer more another day when the UP number is bigger than 0. In the example above, we've already talked about how the top form line was achieved off a notably quicker early - and commensurately slower late - tempo. Our algo reckons that effort should be marked up.
Summary
So that's an introduction to the new SECTIONALS block on FULL FORM. It can help contextualise race performances and shine a light on horses that might have more to offer than meets the eye. In all cases when considering a horse with attractive upgrade figures or an apparent pattern to their better efforts consider the likely tempo of today's race against those prior positive spins; if the setup looks similar, you might have unearthed a value play. But keep in mind that context is critical with this stuff.
One other closing thought: no approach to the past performance data should be used in isolation. Sectional times are just one more weapon in your form reading armoury. There will be races where it's not especially helpful, and others where it might be the kingmaker. Just like any other angle.
The beauty of sectional data is that its lack of familiarity is a barrier to entry for many; that means some of its lightly coded messages are there for you and not many others. We don't need only to look for the horse that might step forward, but in the same way we can identify runners that might be overbet based on a flattering recent win or close up run. We're working on some content for the RESULT tab that might make this more apparent. More on that another day...
Matt
Other Recent Posts by This Author:
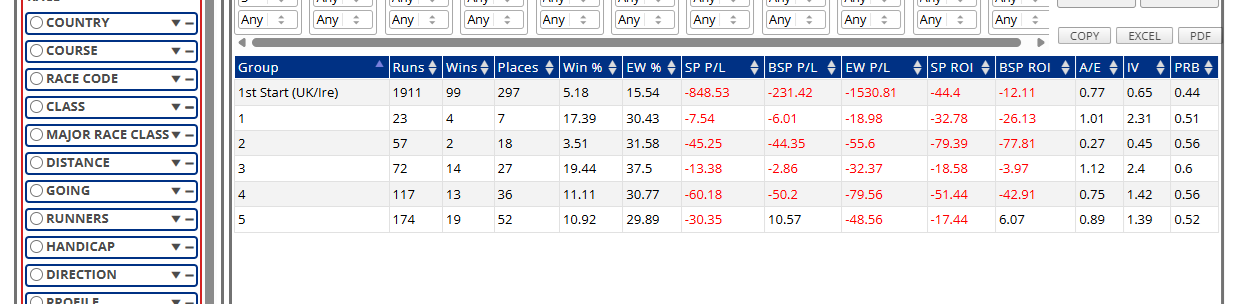
- Two New Features in Query Tool
- Taking A Flyer on the 2027 Cheltenham Festival
- My Cheltenham Festival 2026 P&L
- Cheltenham Festival 2026: Day Four Preview, Tips
- Cheltenham Festival 2026: Day 3 Preview, Trends, Tips


As presented, looks extremely positive. Can I assume ‘your par time table(s)’ have been developed by “course, race distance, race type, class and track conditions”, over a significant number of years/races? I am not asking for proprietary information, nor algorithmic detail. Only for a definitive definition of basis regarding ‘par’ times or data. I look forward to your continuous additions and improvements. Congratulation to you and your staff. dch 02/11 01:12.31..31 (EST)
Hi Dexter,
Thanks for your question. Par is defined on page 76 of the user guide, available here:
https://www.geegeez.co.uk/geegeez-gold-user-guide/
The size of the sample is listed on the charts accessible from the CHART button on FULL RESULT tabs.
Best,
Matt
Can we look forward to your dulcet tones on this subject in the near future on how to get the best out of this upgrade ?
Leave a Reply
Want to join the discussion?Feel free to contribute!