
Course Topography: Uphill Finishes
Horses racing at a course with an uphill finish – is a good run at a similar course LTO a positive?
Almost all American tracks are flat, left-handed (anticlockwise) ovals, whereas in the UK the courses differ considerably, writes Dave Renham. Before I get to the meat and bones of my latest research let me outline some of these differences:
- Track Layout & Shape
UK flat tracks vary dramatically in geometry, and this can be a factor in terms of affecting how races play out.
- Galloping tracks - (e.g., Newmarket Rowley Mile, Doncaster). They usually have long straights and sweeping bends tend to favour long‑striding horses who build rhythm.
- Sharp tracks - (e.g., Chester, Catterick). Sharp tracks have tight turns and often short straights, and this usually rewards early speed and handy positioning.
- Left‑handed versus right‑handed - Some horses show clear preferences depending on the direction of turns.
- Topography & Gradients
Courses vary greatly because they are not all totally flat. Here are three types worth noting:
- Severely undulating: Brighton is the classic example — rolling cambers and slopes test balance and agility.
- Unique gradients: Epsom is famously challenging, with steep climbs and descents, plus a cambered straight.
- Perfectly flat tracks: Some courses (e.g., Nottingham) offer more ‘level’ racing with fewer balance challenges.
These differences mean course specialists can emerge.
- Surface Type
Not only does the UK have turf and AW racing, but the turf conditions vary due to the weather conditions, the amount of watering used when it has been hot/dry, the make-up of the soil (clay, chalk), and so on.
Indeed, it has been quite eye-opening looking at each individual course over the past five full years (2021 to 2025) in terms of the percentages of races that were run on ground good or firmer. I had assumed that the Southern courses would have the highest percentages and the Northern courses the lowest, based on rudimentary knowledge of UK weather patterns. However, things did not pan out entirely in that way. Firstly, let me share the course with the top ten percentages of fast ground prevalence:
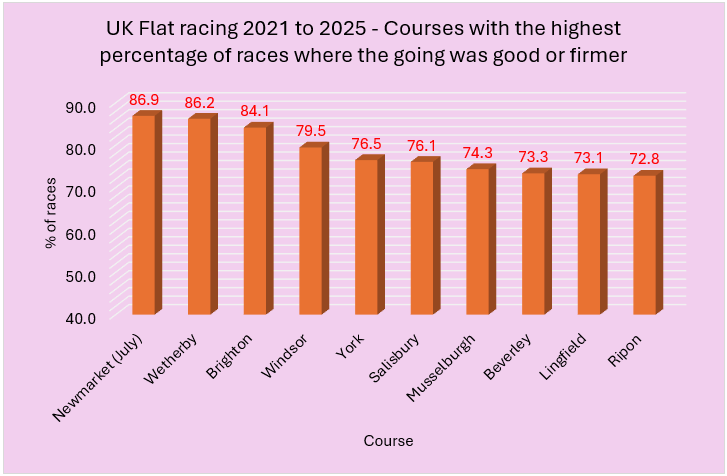
As we can see, half of the ten courses hail from the north of the country namely Wetherby, York, Musselburgh, Beverley and Ripon. So, what about the ten courses with the lowest percentages? The next graph highlights these courses:
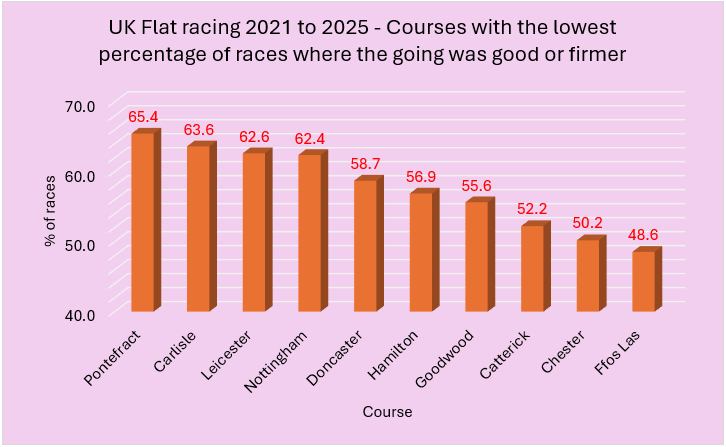
This is a more Northern-dominated perspective although it is a surprise perhaps to see Goodwood appear given that the track is on the South Downs which lies on chalk. I am assuming they water the course much more than most.
- Course Configuration & Distance Options
Different tracks offer different combinations of:
- Straight courses (e.g., Newmarket’s straight mile)
- Round courses with multiple turns (e.g. Chester)
- Short run‑ins versus long finishing straights
- Courses with multiple configurations (e.g. Goodwood has two loops as does Kempton)
These variations can influence draw bias, and suitability for certain running styles.
In summary then, UK flat racecourses differ in shape, surface, topography, direction, distance configuration and run style/draw bias. These differences create distinct racing challenges and can strongly influence which horses thrive at which venues.
Now I have given some background and set the scene, let me share my recent research.
I have been looking at the performance of horses on the flat that ran well on a course with an uphill finish last time (LTO), when racing at a track next time out that also had an uphill finish.
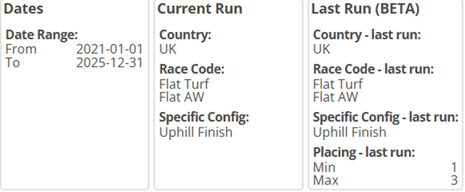
To count as 'running well', I deemed this to be a finish in the first three. To be included, a course had to be one of those categorised as having an uphill finish in the Geegeez Query Tool ‘Specific Config’ variable. On the flat in the UK this includes eight courses – Beverley, Carlisle, Chepstow, Hamilton, Leicester, Newmarket, Pontefract and Sandown. The data has been taken from flat racing at these courses spanning five full years from 2021 to 2025, and the filters I selected in QT are shown below:
All profits and losses quoted have been calculated to Betfair Starting Price (BSP) less 2% on winning bets.
The first set of stats to share therefore is for all qualifying horses – in other words those who raced at one of the eight courses with uphill finishes having finished in the first three at one of the same eight courses LTO. I was hoping that the results would be relatively positive suggesting that these horses maybe perhaps suited to uphill finishes. Here are the numbers:
| Runs | Wins | Win% | BSP P/L | BSP ROI |
| 4445 | 872 | 19.62 | 237.63 | 5.35 |
If we had backed all qualifiers ‘blind’ we would have secured a return of a smidge above 5 pence in the £. This is a very promising starting point. For the record, the PRB (Percentage of Rivals Beaten) stands at a very healthy 0.61.
From here, let me share the yearly splits to see how consistent, or not, these qualifiers have been:
| Year | Runs | Wins | Win% | BSP P/L | BSP ROI |
| 2021 | 875 | 171 | 19.54 | 50.33 | 5.75 |
| 2022 | 935 | 198 | 21.18 | 67.88 | 7.26 |
| 2023 | 910 | 166 | 18.24 | 56.32 | 6.19 |
| 2024 | 858 | 155 | 18.07 | -85.85 | -10.01 |
| 2025 | 867 | 182 | 20.99 | 148.96 | 17.18 |
Only 2024 saw a reverse, while the other four years produced solid results and profits. Indeed, when we look at the yearly PRBs we see excellent correlation and consistency:
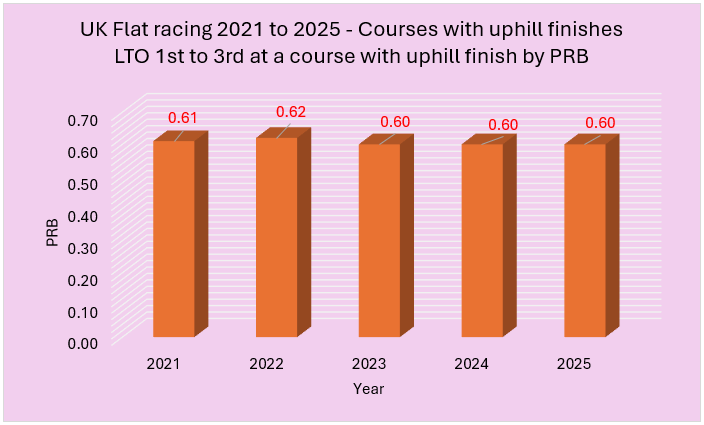
As we can see the figures range from a low of 0.60 to a high of 0.62.
Time to split the results by LTO position to see if there was much difference between those finishing either first last time, second or third.
| LTO position | Runs | Wins | Win% | BSP P/L | BSP ROI |
| 1st | 1615 | 341 | 21.11 | 74.77 | 4.63 |
| 2nd | 1504 | 303 | 20.15 | 99.72 | 6.63 |
| 3rd | 1326 | 228 | 17.19 | 63.13 | 4.76 |
We see comparable strike rates for the qualifiers finishing first or second last time out, with a small drop off to those finishing third. In terms of profits/returns we see positive similar outcomes meaning the results have not been skewed by the performance of one specific LTO position.
Let me now share the results when the horse has returned to the same track as last time – so Newmarket last time to Newmarket this time, etc. How has each individual course with an uphill finish fared in terms of these qualifiers? Below shows a graph of the ROI percentages for each.
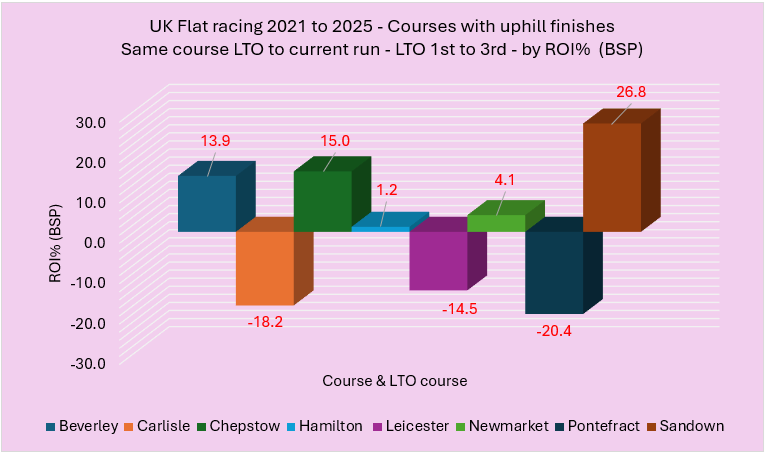
Five of the eight produced overall blind profits, while three - Carlisle, Leicester and Pontefract - produced losses. Below is a table showing a full breakdown for each:
| Course | LTO course | Runs | Wins | Win% | BSP P/L | BSP ROI |
| Beverley | Beverley | 287 | 60 | 20.91 | 39.74 | 13.85 |
| Carlisle | Carlisle | 135 | 22 | 16.3 | -24.63 | -18.24 |
| Chepstow | Chepstow | 250 | 48 | 19.2 | 37.47 | 14.99 |
| Hamilton | Hamilton | 339 | 69 | 20.35 | 4.21 | 1.24 |
| Leicester | Leicester | 116 | 24 | 20.69 | -16.82 | -14.5 |
| Newmarket | Newmarket | 757 | 154 | 20.34 | 31.35 | 4.14 |
| Pontefract | Pontefract | 161 | 26 | 16.15 | -32.8 | -20.37 |
| Sandown | Sandown | 140 | 28 | 20 | 37.56 | 26.83 |
The two with the lowest strike rates, Carlisle and Pontefract, have shown the poorest returns but, overall, when combining all eight together we get the following totals:
| Runs | Wins | Win% | BSP P/L | BSP ROI |
| 2185 | 431 | 19.73 | 76.08 | 3.48 |
Hence, a top three finish LTO when returning to the same course as last time has produced a small overall profit.
What about a different course LTO to course this time? Below are all those combinations where we have had at least 75 qualifiers. They have been ordered by strike rate / win%:
| Course | LTO course | Runs | Wins | Win% | BSP P/L | BSP ROI |
| Hamilton | Beverley | 79 | 22 | 27.85 | 59.93 | 75.86 |
| Hamilton | Carlisle | 107 | 24 | 22.43 | 24.47 | 22.87 |
| Sandown | Newmarket | 122 | 27 | 22.13 | 6.83 | 5.6 |
| Newmarket | Sandown | 138 | 27 | 19.57 | -23.21 | -16.82 |
| Carlisle | Hamilton | 101 | 19 | 18.81 | 19.76 | 19.56 |
| Newmarket | Leicester | 131 | 23 | 17.56 | 73.05 | 55.76 |
| Beverley | Carlisle | 81 | 14 | 17.28 | -0.47 | -0.58 |
| Carlisle | Beverley | 75 | 12 | 16 | 5.41 | 7.21 |
| Newmarket | Pontefract | 89 | 13 | 14.61 | -6.52 | -7.33 |
| Pontefract | Beverley | 89 | 13 | 14.61 | 30.55 | 34.33 |
There are plenty of positive combinations here with Beverley LTO to Hamilton, and Leicester LTO and Newmarket faring extremely well from a profits/returns perspective. Horses going from Sandown to Newmarket performed the poorest out of this group in terms of profits/returns.
Now, I mention all the time that with any data we need to be careful it is not skewed significantly by big priced winners. So let me share the results for all qualifiers that started at a BSP of 16.0 or lower. Here are those numbers:
| Runs | Wins | Win% | BSP P/L | BSP ROI |
| 4124 | 866 | 21 | 369.62 | 8.96 |
As can be seen, the returns are better than those when including qualifiers at any price. We have hit nearly 9p in the £ compared to the original figure of 5.35p in the £. This is always something I like to see.
What about handicaps versus non-handicaps? I wasn’t sure what I would find other than I assumed there would be far more handicap qualifiers than non-handicap ones and that the non-handicap strike rate would be higher. Here are the splits:
| Race type | Runs | Wins | Win% | BSP P/L | BSP ROI |
| Non-Handicap | 1091 | 258 | 23.65 | 62.67 | 5.74 |
| Handicap | 3354 | 614 | 18.31 | 174.96 | 5.22 |
Both my assumptions proved correct and, interestingly, the returns for each group have been remarkably similar, both between 5 and 6p in the £.
There are three more points I would like to share before winding this piece up. Firstly, let me show the differences in results for horses aged six or younger versus those seven or older:
| Age | Runs | Wins | Win% | BSP P/L | BSP ROI |
| 2yo to 6yo | 3976 | 811 | 20.4 | 321.52 | 8.09 |
| 7yo+ | 469 | 61 | 13.01 | -83.88 | -17.88 |
These results have been extremely enlightening, showing that it would have been best to avoid qualifying runners aged seven or older.
Secondly, if we restrict qualifiers to horses that had won just once previously at the course we get the following: 242 wins from 1008 runners (SR 24.01%) for a BSP profit of £229.25 (ROI +22.8%). Not only that, if we look at the start of this year 2026, up to 23rd July, when I penned this piece, this cohort had secured a profit of close to £120 to £1 level stakes with an ROI of over 82%!
Thirdly and finally, I want to discuss whether there have been any significant differences in results when comparing horses running over the same distance to LTO with those going up or down in distance. When I say the same distance, I am allowing half a furlong either way. This makes sense as at some courses specific distances, for example Beverley’s 7f and 1m trips, are actually run over 7½f and 1m ½f respectively. It also allows flexibility in the results for courses that move their rails to increase or decrease the distance by half a furlong or less.
Below is a graph showing the PRBs for distance change across all qualifiers:
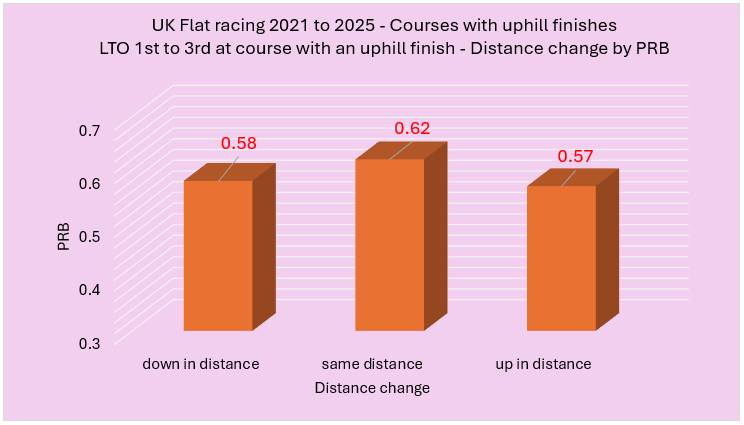
As the graph highlights, horses running over the same trip as last time have comfortably outperformed horses which switched in distance by a furlong or more. Also, if we compare strike rates, profits, returns and BSP A/E indices we see the ‘same distance’ coming out well on top across the board:
| Distance change | Win% | BSP P/L | BSP ROI | A/E (BSP) |
| Down in distance | 16 | -74.29 | -14.15 | 0.93 |
| Same distance | 20.75 | 395.08 | 13.62 | 1.08 |
| Up in distance | 18.4 | -60.24 | -5.87 | 1.03 |
Clearly, a run LTO over the same distance or within half a furlong has been a strong positive when returning to a track with a similar uphill finish having finished that previous race in the first three.
Based on the evidence uncovered in this piece, a finish in the first three LTO at a course with an uphill finish should be seen to be a positive if the horse returns to a similar track or the same one next time.
- DR