
Looking Ahead to Autumn on the Flat
Autumn on the flat: A Study
Introduction
The days are getting shorter, the nights are starting to get a little cooler as we move inexorably into autumn, writes Dave Renham. So, does the change in season affect flat racing in any way? Well, the obvious fact is that generally in these later months we will start to see easier (softer) ground.
This is highlighted neatly by the graph below, which shows the percentage of races run on good to soft or softer comparing June to August with September to November.
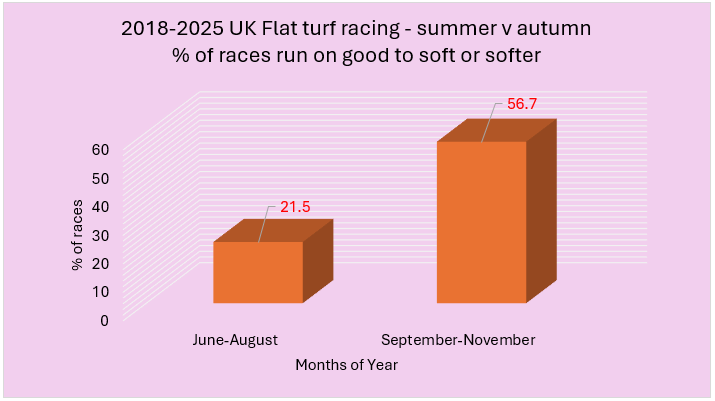
As we can see, there is a huge difference between the two. Hence, one thing we need to be slightly wary of is summer firmer ground form as we move into the autumn. We often hear about horses that come into their own in the autumn and generally I would imagine much of this is ground related.
In this article I am going to examine flat data from 2018 to 2025 focusing on the months of September, October and November. This will include all-weather (AW) data, too. Profits / losses have been calculated to Betfair Starting Price (BSP) less 2% commission on winning bets. Overall, roughly half of the races were on the turf and half on the AW, although the split in September and October is roughly 60-40 in favour of turf races. In November there is usually just a week of turf racing after which AW dominates.
For the number crunching in this article I have used the Geegeez Query Tool and let me start by looking at market factors.
Market Rank
I want to look at position in the betting market, and I am using Industry SP positions as these are the ones used in Query Tool. All groups include ‘joint’ market position so as an example the favourite group includes clear favourites, joint favourites and co-favourites.
| Market Rank (ISP) | Runs | Wins | Win% | BSP P/L | BSP ROI |
| Favourite | 13838 | 4359 | 31.5 | -139.49 | -1.01 |
| 2nd fav | 13232 | 2583 | 19.52 | -32.26 | -0.24 |
| 3rd fav | 12833 | 1719 | 13.4 | -188.96 | -1.47 |
| 4th in betting | 12902 | 1280 | 9.92 | -387.48 | -3 |
| 5th+ in betting | 72337 | 2877 | 3.98 | -4074.24 | -5.63 |
As we can see, favourites and second favourites have both gone close to breaking even to BSP, implying the market has been a good guide in the autumn over the past eight years.
Sticking with favourites below are the splits between turf and AW market leaders:
| Race code | Runs | Wins | Win% | BSP P/L | BSP ROI |
| Fav turf | 7059 | 2185 | 30.95 | 22.61 | 0.32 |
| Fav AW | 6779 | 2174 | 32.07 | -162.1 | -2.39 |
Turf jollies snuck into profit and offered punters better value over the period of study. Indeed, the softer the going the better as the graph below shows:
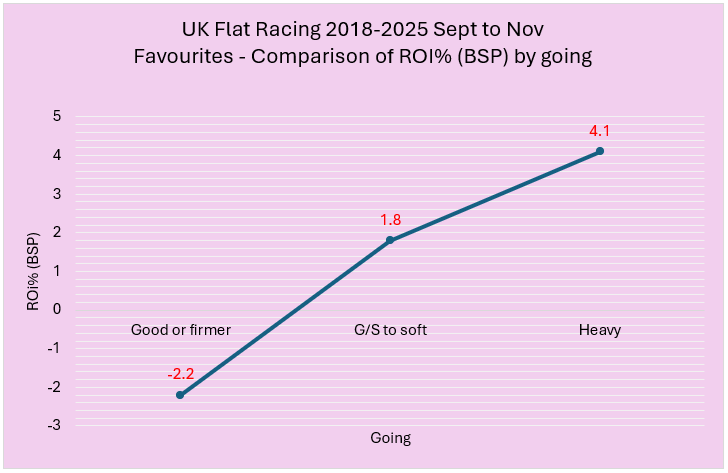
On heavy ground favourites returned just over 4 pence in the £ over the period of study, with those racing on good to soft or softer also being profitable. Favourites on good ground or firmer also performed OK but lost just over 2p in the £. Returning to favourites on heavy ground, if we concentrated on those which had previously won on heavy, we would have seen 49 winners from 140 qualifiers (SR 35%) for a profit of £34.92 (ROI +24.9%). 140 runners is a smallish sample and therefore potential yearly qualifiers will be thin on the ground, but when one does appear it will require close scrutiny.
It should also be noted that favourites racing on soft ground during this time frame having been previous soft ground winners also nudged into profit from a bigger sample. There were 613 qualifiers of which 181 have won (SR 29.5%) for a small profit to BSP of £41.86 (ROI +6.8%). It seems therefore that a previous win on soft or heavy ground when encountering the same surface in the autumn has been a positive for runners that started favourite.
Let me split favourites now by class of race to see if anything worthwhile can be found.
| Race Class | Runs | Wins | Win% | BSP P/L | BSP ROI |
| 1 | 684 | 242 | 35.38 | 22.3 | 3.26 |
| 2 | 1086 | 318 | 29.28 | 24.08 | 2.22 |
| 3 | 1032 | 312 | 30.23 | -67.89 | -6.58 |
| 4 | 2906 | 931 | 32.04 | -49.53 | -1.7 |
| 5 | 4461 | 1551 | 34.77 | -12.7 | -0.28 |
| 6 | 3643 | 998 | 27.4 | -65.48 | -1.8 |
| 7 | 26 | 7 | 26.92 | 9.71 | 37.35 |
Favourites fared best in better classes of race (Class 1 and 2). They generated a profit in Class 7 events, too, but these are no longer run. Going back to the better class of races, if we look at favourites at the highest level, those in Group 1 contests, they produced returns of over 25p in the £ thanks to 44 wins from 103 (SR 42.7%) for a profit of £26.22.
Finally in terms of favourites let me show the strike rates based on run style.
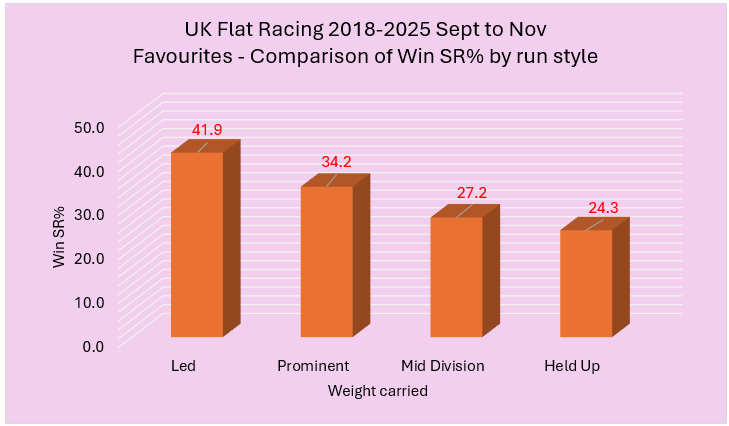
These figures are based on combining all distances together and we see that front runners when favourite have enjoyed a huge edge. This edge increases over shorter trips with market leaders over 5f and 6f winning more than 44.5% of the time. I have said before that being able to predict the front runner pre-race leads to huge profits. Clearly, this will never be possible but I continue to review means of deriving the best chance of achieving this.
Splitting results up by Starting Price is my next port of call and let me share the numbers for those horses priced 18/1 or shorter with those 20/1 or bigger.
| Race Class | Runs | Wins | Win% | BSP P/L | BSP ROI |
| 18/1 or less | 86394 | 12154 | 14.07 | -935.14 | -1.08 |
| 20/1+ | 38747 | 663 | 1.71 | -3891.28 | -10.04 |
I would have been slightly surprised by this if I had not seen the earlier statistics for favourites, because before the research for this article I expected later season results might throw up more upsets than normal. However, although there have been some shock results with big priced winners hitting the target, the ROI% for all horses 20/1 or bigger is actually poorer than for all months of the year combined.
Based on the above, it makes sense to focus on the 18/1 or shorter group as they lost the least in terms of returns by some margin. Also, as regular Geegeez readers will know, I tend to put a price cap in place ignoring very big prices to avoid those occasional big priced winners that could skew smaller sample sizes. Hence, for the remainder of this piece, the stats shared will only include horses that started 18/1 or shorter in the betting.
Sex of horse
Let's see how male and female runners performed in the autumn.
| Sex of horse | Runs | Wins | Win% | BSP P/L | BSP ROI |
| Female | 27030 | 3672 | 13.58 | -496.91 | -1.84 |
| Male | 59363 | 8481 | 14.29 | -440.28 | -0.74 |
There was nothing much in it really with a small edge in favour of males.
Position Last Time Out (LTO)
A look at where horses finished LTO now, with the 18/1 price cap in place. Horses that finished fifth or worse only include horses that finished the race (i.e. non-completions are excluded). For the record 203 horses failed to finish the race; they either slipped, fell or were pulled up.
| Race Class | Runs | Wins | Win% | BSP P/L | BSP ROI |
| 1st | 11395 | 2139 | 18.77 | -625.87 | -5.49 |
| 2nd | 11910 | 2184 | 18.34 | -156.04 | -1.31 |
| 3rd | 11175 | 1642 | 14.69 | -724.27 | -6.48 |
| 4th | 10135 | 1330 | 13.12 | -367.09 | -3.62 |
| 5th+ | 36953 | 4244 | 11.48 | 837.8 | 2.27 |
It is interesting to see the strike rate similarity between LTO winners and runners up. This helps explain why LTO winners lost over 4p in the £ more than LTO runners up. Horses that finished fifth or further down the field on their most recent start produced a small profit over a huge number of bets. Indeed, this LTO fifth or worse stat can be improved upon if we restrict qualifiers to those which finished fifth or worse on their penultimate start (two runs back) as well. This cohort would have given us 18296 qualifiers of which 5636 won (SR 10.6%) for a BSP profit of £1134.52 (ROI +6.2%). Why some of these horses have been value perhaps goes back to something I said earlier which was that summer form does not always translate to autumn form, coupled with the fact that some horses just seem to thrive more in the autumn.
Sticking with horses that finished fifth or worse in both of their last two runs, if we concentrate on horses that raced on soft or heavy going and which in their previous two races had run on good or firmer (i.e. a going switch today), we see a very impressive bottom line:
| Runs | Wins | Win% | BSP P/L | BSP ROI |
| 840 | 100 | 11.9 | 181.58 | 21.62 |
There would have been an extremely healthy return of over 21p in the £ backing such runners. For those interested, here is a screenshot of the filters I used in the Query Tool.
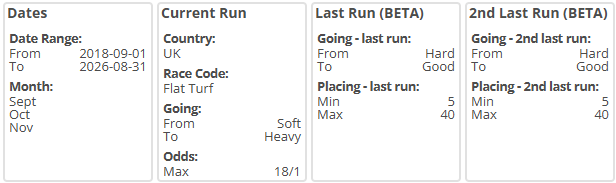
Now, we cannot be sure whether these positive figures can be maintained in the future, but as with all my articles I can only report on what has happened in the past and hope the majority of trends founds, be them positive or negative, continue to perform in a similar way.
Days since last run
The next area to look at is the number of days since each horse ran. The table below breaks it downn:
| Days Since Last Run | Runs | Wins | Win% | BSP P/L | BSP ROI |
| 1 to 4 | 1326 | 284 | 21.42 | 243.03 | 18.33 |
| 5 to 7 | 3838 | 601 | 15.66 | -1.78 | -0.05 |
| 8 to 14 | 17545 | 2458 | 14.01 | -256.91 | -1.46 |
| 15 to 28 | 33760 | 4736 | 14.03 | -1034.3 | -3.06 |
| 29 to 49 | 15839 | 2169 | 13.69 | -422.23 | -2.67 |
| 50 to 99 | 6266 | 857 | 13.68 | 221.03 | 3.53 |
| 100 or more | 3295 | 467 | 14.17 | 156.56 | 4.75 |
The eye is immediately drawn to those ‘quick returners’ which ran within four days of their prior start. They secured a strike rate in excess of one in five with returns hitting a notch above 18p in the £. Also, horses off the track for over seven weeks (50 days or more) proved profitable, albeit to a lesser degree.
Autumn Trainers
The final area I want to look at is trainer data. In the table below I have listed all trainers who saddled at least 400 runners in the autumn across the eight-year time frame and achieved a strike rate of at least 12% with runners priced 18/1 or less. They are listed alphabetically.
| Trainer | Runs | Wins | Win% | BSP P/L | BSP ROI |
| C Appleby | 753 | 224 | 29.75 | 81.18 | 10.78 |
| M Appleby | 1164 | 155 | 13.32 | -73.38 | -6.3 |
| A Balding | 1635 | 266 | 16.27 | 38.89 | 2.38 |
| R Beckett | 1374 | 288 | 20.96 | 264.53 | 19.25 |
| Michael Bell | 545 | 73 | 13.39 | -17.78 | -3.26 |
| M Botti | 591 | 90 | 15.23 | 55.66 | 9.42 |
| G Boughey | 834 | 154 | 18.47 | 20.55 | 2.46 |
| A Brittain | 442 | 59 | 13.35 | 38.96 | 8.81 |
| K Burke | 1197 | 195 | 16.29 | 14.99 | 1.25 |
| J Butler | 543 | 66 | 12.15 | -60.61 | -11.16 |
| J Camacho | 452 | 63 | 13.94 | 40.88 | 9.04 |
| A Carroll | 1007 | 132 | 13.11 | 27.95 | 2.78 |
| R Cowell | 416 | 58 | 13.94 | 56.4 | 13.56 |
| Clive Cox | 790 | 129 | 16.33 | 167.02 | 21.14 |
| S+E Crisford | 782 | 183 | 23.4 | 157.14 | 20.09 |
| T Dascombe | 491 | 73 | 14.87 | 18.98 | 3.87 |
| T Easterby | 2058 | 248 | 12.05 | 6.33 | 0.31 |
| P D Evans | 667 | 81 | 12.14 | -12.06 | -1.81 |
| R Fahey | 1993 | 242 | 12.14 | -79.74 | -4 |
| J Fanshawe | 629 | 109 | 17.33 | -54.59 | -8.68 |
| C Fellowes | 494 | 64 | 12.96 | -65.93 | -13.35 |
| J Goldie | 797 | 105 | 13.17 | 97.34 | 12.21 |
| J + T Gosden | 1511 | 354 | 23.43 | 108.49 | 7.18 |
| W Haggas | 1640 | 340 | 20.73 | 48.92 | 2.98 |
| R Hannon | 1720 | 214 | 12.44 | -89.63 | -5.21 |
| C Hills | 691 | 119 | 17.22 | 153.43 | 22.2 |
| Eve Johnson Houghton | 601 | 81 | 13.48 | -19.53 | -3.25 |
| R Hughes | 765 | 128 | 16.73 | 33.5 | 4.38 |
| I Jardine | 756 | 101 | 13.36 | 27.44 | 3.63 |
| C Johnston | 715 | 102 | 14.27 | -29.28 | -4.1 |
| D M Loughnane | 508 | 62 | 12.2 | 105.2 | 20.71 |
| H Morrison | 495 | 65 | 13.13 | -113.17 | -22.86 |
| D O'Meara | 1580 | 197 | 12.47 | -48 | -3.04 |
| J Osborne | 482 | 68 | 14.11 | 33.63 | 6.98 |
| H Palmer | 852 | 140 | 16.43 | -17.37 | -2.04 |
| Sir M Prescott | 431 | 75 | 17.4 | -29.67 | -6.88 |
| J J Quinn | 475 | 60 | 12.63 | -68.11 | -14.34 |
| K A Ryan | 828 | 110 | 13.29 | 80.53 | 9.73 |
| D Simcock | 533 | 99 | 18.57 | 68.46 | 12.84 |
| S Bin Suroor | 569 | 123 | 21.62 | -49.84 | -8.76 |
| J Tate | 459 | 93 | 20.26 | 18.82 | 4.1 |
| R Varian | 1319 | 276 | 20.92 | -4.07 | -0.31 |
| E Walker | 876 | 139 | 15.87 | 3.35 | 0.38 |
| A Watson | 835 | 124 | 14.85 | -144.31 | -17.28 |
| I Williams | 688 | 97 | 14.1 | 55.97 | 8.14 |
| S C Williams | 609 | 91 | 14.94 | 63.6 | 10.44 |
A high proportion of these trainers (61%) secured a blind profit in the autumn with these 18/1 or shorter priced runners. Messrs Hills, Cox, Loughnane and the Crisford stable have produced the best returns, all returning better than 20 pence in the £. Below are a few trainers' records in more detail.
Charles Hills secured seven winning autumns out of eight although it should be noted that his losing year (2024) delivered very steep losses. Having said that, in 2024 his placed record was still decent, it was just the winners that dried up - so quite likely a nasty dose of the dreaded variance.
The table below highlights some of Hills' more positive areas:
| Variable | Runs | Wins | Win% | BSP P/L | BSP ROI |
| 2yo runners | 284 | 55 | 19.37 | 81.67 | 28.76 |
| 3yo runners | 266 | 46 | 17.29 | 92.95 | 34.94 |
| LTO finished 2nd | 107 | 26 | 24.3 | 38.33 | 35.82 |
| Soft/heavy going | 108 | 21 | 19.44 | 30.04 | 27.81 |
| Class 5 or lower | 271 | 59 | 21.77 | 126.33 | 46.62 |
As we can see, Hills did well with horses that finished second last time out as well as those racing on soft/heavy ground. His record in lower class races was excellent while younger horses (his two and three-years olds) produced very solid profits. However, horses aged five and older performed poorly with only five winning from 56, losing around 70p in the £.
The Crisford stable has done extremely well, with female runners scoring 26.4% of the time thanks to 74 winners from 280. Backing all of them blind would have yielded a healthy profit of £131.58 (ROI +47%). 3yo fillies fared especially well scoring 29.4% of the time (45 from 153) for a profit of £85.57 (ROI +55.9%). The stable also saw excellent results when their horses started second or third in the betting winning 82 races from 325 (SR 25.2%) for a decent profit of £153.39 (ROI +47.2%). Crisford runners excelled at Lingfield where they won close to 40% of their races (17 from 43) for a profit of £36.60 (ROI +85.1%).
Clive Cox has a good record with 2yos when racing on the turf in the autumn. Such entries won 44 races from 212 runners (SR 20.8%) for a very healthy profit of £97.25 (ROI +45.9%). He also did well when using claiming jockeys. These less experienced riders secured 13 wins from 53 (SR 24.5%) for a bumper profit of £98.76 (ROI +186.3%).
Ralph Beckett’s runners in the autumn when racing at Kempton secured 43 wins from 195 (SR 22.1%) for a profit of £76.18 (ROI +39.1%). Meanwhile, on the turf when the going rode officially soft or heavy his record was an impressive 100 wins from 474 (SR 21.1%) for a profit of £145.82 (ROI +30.8%). Overall, he had six winning years out of the eight.
John and Thady Gosden, like Beckett, secured six winning autumns out of the last eight. Their 2yos when making their debut won 57 of their 308 starts (SR 18.5%) for a highly creditable profit of £139.73 (ROI +45.4%). Male runners outperformed their female counterparts, with females actually making a small loss. In terms of race type, it was the non-handicaps that provided the profits thanks to 291 from 1141 (SR 25.5%) for a profit of £157.54 (ROI +13.8%). Gosden handicappers would have lost us 13p in the £ if backing all of them.
Kevin Ryan has enjoyed a good record in backend handicaps scoring 69 times from 529 (SR 13%) for a profit of £113.69 (ROI +21.5%). He had a similar record on the turf and the AW in handicaps, returning 21.4% and 21.6% respectively. His 3yo handicappers provided a huge chunk of those profits thanks to 33 wins from 211 (SR 15.6%) for a profit of £105.96 (ROI +50.2%). Sticking with handicaps, when a runner finished in the first six LTO the stats improved further. That cohort won 16.8% of all handicaps (55 from 328) for a profit of £147.99 (ROI +45.1%).
*
Summary
There is still plenty of very good flat action to come this autumn and I hope some of the pointers in this article will lead to winners before the flat turf season ends.
Overall, it looks best to stick to those runners priced 18/1 or shorter and there should be some good opportunities to pinpoint value favourites or second favourites.
A run within the last four days has been a huge positive so keep an eye out for quick returners.
Also don’t be put off by a horse that finished fifth or worse on each of its last two starts. They have offered great value. This has been especially true when racing on soft or heavy ground having encountered good or firmer last time out.
Finally, there have been plenty of trainer angles that proved profitable in the past, with reasons to believe they will continue to pay forward.
Hopefully there has been something for everyone in this piece and good luck in the coming months.
- DR