The ‘Super Six’ NH Jockeys: What Happened Next?
As a horse racing researcher, there are good days and bad days, writes Dave Renham. On good days I research an idea and find that the data connected with it is interesting and robust enough to dissect and eventually use for an article. On bad days the idea or ideas I research seem to constantly hit a dead end, with the data crunched offering little or nothing of interest to me or potential readers of said research.
The second week in January was a week where I had a few bad days in a row. All my ideas were falling flat or at least after some digging offered up nothing of significant interest. However, just as I was binning yet another idea, I stumbled across some numbers that made me stop in my tracks. Had I eventually found something that had the potential for a worthwhile piece? About half an hour later after testing a few further theories, I felt I did, and hence I will be sharing my findings today.
Rationale
The data for this article has been taken from UK National Hunt racing covering the years 2019 to 2025. Any profits / losses quoted are calculated to Betfair Starting Price (BSP), with a 2% commission being applied on any winning bets.
For this article, I have been looking at the performance of horses that were ridden last time out by some of the top jockeys in the country. I have chosen the following – Nico de Boinville, Sean Bowen, Harry Cobden, Brian Hughes, Gavin Sheehan and Harry Skelton. These six have had some of the best win percentages of recent years as well as riding a decent number of horses each season, which means we have an excellent initial sample size from which to work.
My initial reasoning for why this angle might prove fruitful was that it is rare for any of these jockeys to ride a complete no-hoper and hence most horses they ride are expected to run well. Of course, there is no guarantee that the same jockey will be on board again next time, but whether they are or are not, one would assume if these horses were expected to run well once, they would be expected to run well next time too. I felt that my reasoning had some sound logic behind it; however, the proof is in the pudding and all that.
Overall: horses ridden by Super Six last time out (LTO)
So, first things first, here are the results for all horses ridden LTO by one of my six jockeys in terms of their very next course outing:
![]()
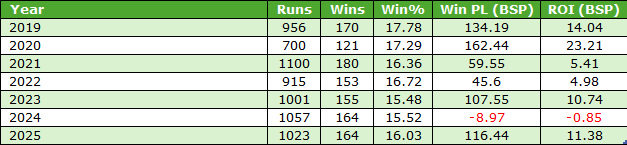
This was an extremely solid – indeed, astounding – starting point producing a sound win rate, with returns edging towards 8 pence in the £. Splitting the results by year produced the following:
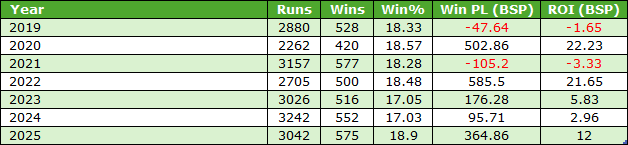
There have been five winning years out of seven, with the two losing years showing only smallish losses. Hence, this simple starting point has been fairly consistent.
Now these results include all possible BSP prices and as we know bottom lines can be massively skewed by big-priced winners. Unfortunately, this set of results does include such winners, with nine of the qualifying horses winning at a BSP of 100.0 or bigger. Backing all horses in triple figures over this timeframe would have yielded 60% of the initial £1572.30 profit figure. Hence, it made sense to ignore those bigger priced runners and focus on a subset of runners at shorter prices. Otherwise, one or more of those 100.0+ winners could be skewing some, or all, of the areas I wanted to explore. I decided therefore that a price limit of BSP 30.0 would be a much better and fairer option. Thus, the remainder of the article is restricted to horses that were priced BSP 30.0 or less.
Let me therefore look at the overall figures for this subset of runners with that BSP 30.0 price cap:
![]()
We have lost roughly 15% of the original qualifiers, but we are still left with a very good sample size, and although the returns are slightly less impressive, a blind profit of over 4p in the £ is still noteworthy.
From this starting point, I wanted to dig deeper, so I began by looking at the yearly A/E indices. The indices presented below are based on BSP rather than ISP, as the exchange prices are more accurate:
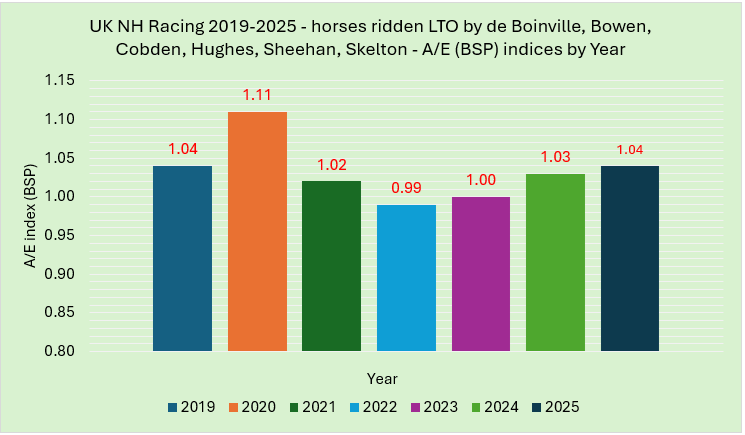
As the graph shows, these horses have offered ‘value’ (A/E 1.00 or bigger) in six of the seven years. Five of the seven years proved to be profitable with the worst year (2022) losing a smidge over 2.5p in the £ across all runners.
Handicap vs non-handicaps
A look now at race type; specifically handicaps versus non handicaps. The splits were thus:

A much higher strike rate has been achieved in non-handicaps, but this is the norm as they tend to be less competitive. All the profits, though, have come from handicap races.
An additional statistic to note is if we restrict the handicap results to horses that had raced in a handicap LTO as well. This specific handicap-to-handicap group produced 9707 qualifiers of which 1693 won (SR 17.4%) for an impressive profit of £974.15 (ROI +10%).
Race Class
Let me next examine the Class of Race to see if anything could be gleaned from it. The splits were as follows:
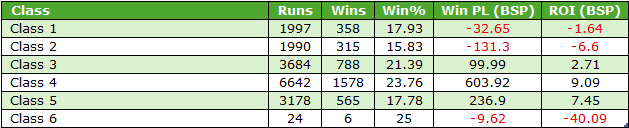
We can safely ignore the Class 6 findings as there were only 24 qualifiers, and the stats indicate that Classes 3 to 5 have offered up the best returns. The more competitive levels of Class 1 and 2 both showed losses to BSP.
Last time out race position
Onto position LTO now. Did that make a difference? Let’s take a look:
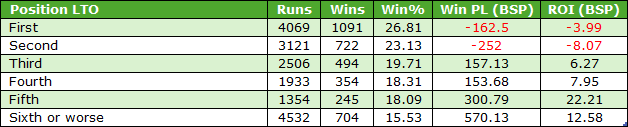
It is not surprising I guess that more than 7,000 of the c.17,500 qualifiers finished first or second LTO, as they were ridden by one of the ‘Super Six’; but a first or second finish last time was actually a negative when it came to next time out value. Conversely, horses that finished third or worse LTO combined to return over 11p in the £. It seems therefore, that this may be the group we should concentrate on in the future as those winners and almost winners last time are significantly over-bet.
Jockey change?
My next port of call was to examine the results where any of the six jockeys remained on the same horse next time out, compared with a jockey change which was not one of the six. Here were my findings:

The value lay clearly with horses ridden this time by a jockey who was not one of the six. Yes, the overall strike rate was lower but the bottom line was significantly better. Also, looking at the yearly splits for this cohort we see positive numbers in six of the seven years, and a negligible loss in the other one:
What I also found fascinating were the results when we examine the final possible jockey permutation – horses ridden by one of de Boinville, Bowen, Cobden, Hughes, Sheehan or Skelton last time and now ridden by a different jockey from the ‘Super Six’. In other words, a possible scenario being when Sean Bowen had ridden the horse last time, but Harry Cobden was on board this time; or Gavin Sheehan having been on board last time, being replaced by Brian Hughes this time, etc. Here are those findings:
![]()
These results have been extremely positive during the past seven years, so this looks like an avenue we could potentially explore in the future. One positive switch to mention is when Harry Cobden was riding a horse this time after being ridden by Sean Bowen LTO. This ‘combo’ saw 35 qualifiers of which 11 won (SR 31.4%) for a profit of £25.20 (ROI +72%).
[One such switch was when geegeez.co.uk syndicate horse Sure Touch won the 2024 Summer Plate under Cobden after Bowen was required to ride a horse for his father – Ed.]
Odds Last Time Out
Moving on, one area I always like to look at where possible is the LTO odds of the horses in question. Below is a graph showing the ROI% splits for different bands of LTO odds – I have used ISP for the LTO odds as the prices are tidier:
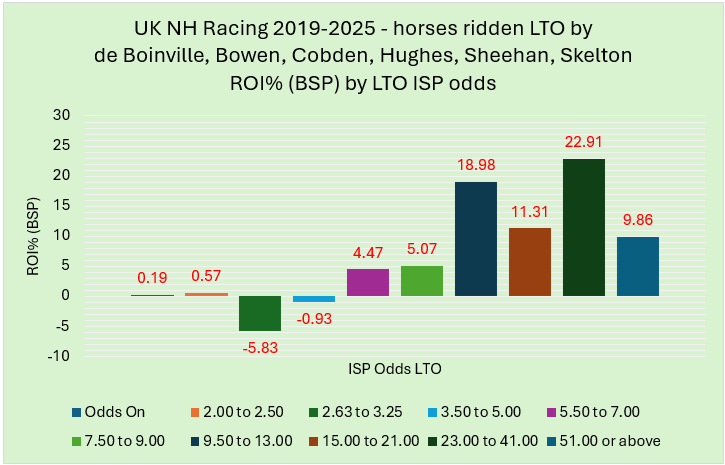
This graph gives us a clear cut steer, with runners LTO that were priced 9.50 (17/2) or higher producing much better returns on their very next start compared with prices LTO of 9.00 (8/1) or less. For the record, horses that were priced 5.0 (4/1) or lower LTO combined to produce blind losses.
Age of horse
Finally for this article, I am going to share the age of horse splits, and these are shown in the table below:
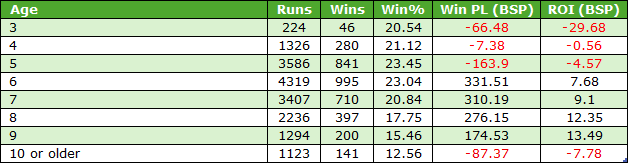
As can be seen, 3yos had a poor record. The double-digit generation also struggled a little when compared with the best range, those aged six to nine. Why this group has done best is probably because National Hunt horses are in their prime between six and nine. Suffice to say horses aged six to nine have clearly offered the best value in the past few years when ridden LTO by one of the Super Six.
**
I must admit that the data shared in this piece are far better than I had expected when I embarked upon the research. It will be interesting to see if these generally positive results are replicated in 2026 and beyond.
- DR