Tag Archive for: pace scores

Combining Pace and SR Ratings, Part 2

A four-week trial of combining Pace with SR Ratings, Part 2

This the second in a double header where I am sharing a very simple ‘system’ which I tested over a four-week period from May 1st 2026 to May 28th 2026, writes Dave Renham. Before reading on, it would make sense to read the first piece if not done already and that can be found here.

Not everyone is a fan of systems, but my racing journey was enriched by reading books and articles by the racing systems ‘king’, Nick Mordin. Hence, although I don’t tend to use rigid systems per se when selecting my bets, there are systematic elements that I do lean on within the whole process.

It should be noted that in order to find these system selections, a Geegeez Gold membership is required as that includes access to some of the key data needed.

To recap here are the ‘system’ rules:

  1. UK Handicap races only
  2. Race Distance 5f to 1m1f
  3. The Percentage of Rivals figure (PRB) for the ‘led’ group on the pace tab for the specific race conditions must be 0.60 or higher
  4. Horse must have one of the top three pace scores for the race
  5. Horse must have one of the top three SR ratings for the race

Note that if there were two joint third rated pace horses then both would potentially become a qualifier if either or both of their SR rating positions were also in the top three. If there were three or more joint thirds, then I would count the two with the highest most recent race pace scores. In terms of SR rating joint thirds, I need to include them all as I have no way of splitting them. Also, if a horse had only three previous pace race scores, I would use their pace average figure to compare with the four race averages that most horses have. In this case, the horses with the three highest averages across either three or four past races would count. I did not consider horses with one or two past scores.

I mentioned in the first article that I am only using handicap races, as they give us the most reliable results for this type of idea.

In that first part I shared the results for weeks one and two. Again, just to recap, these are below with profit/losses based on BSP (Betfair SP) less 2% commission.

Week 1

 

Table of betting statistics: Bets 29, Wins 6, Win% 20.69, P/L BSP 12, ROI BSP 41.38.


Week 2


Table of betting stats: Bets 20, Wins 4, Win% 20, P/L BSP 16.39, ROI BSP 81.95


First two weeks combined


Table of betting stats: Bets 49, Wins 10, Win% 20.41, P/L BSP 28.39, ROI BSP 57.94


So, all in all, the first fortnight delivered some positive early findings. Of course, the sample size at this juncture was still relatively small. However, a further positive after these 49 races was that there had been 11 second places as well.

Time to move into week 3.

Week 3

The results for the third week were as follows, with winners highlighted in red. There were four qualifiers where the PRB ‘led’ sample size was small and those horses have an asterisk next to their name:
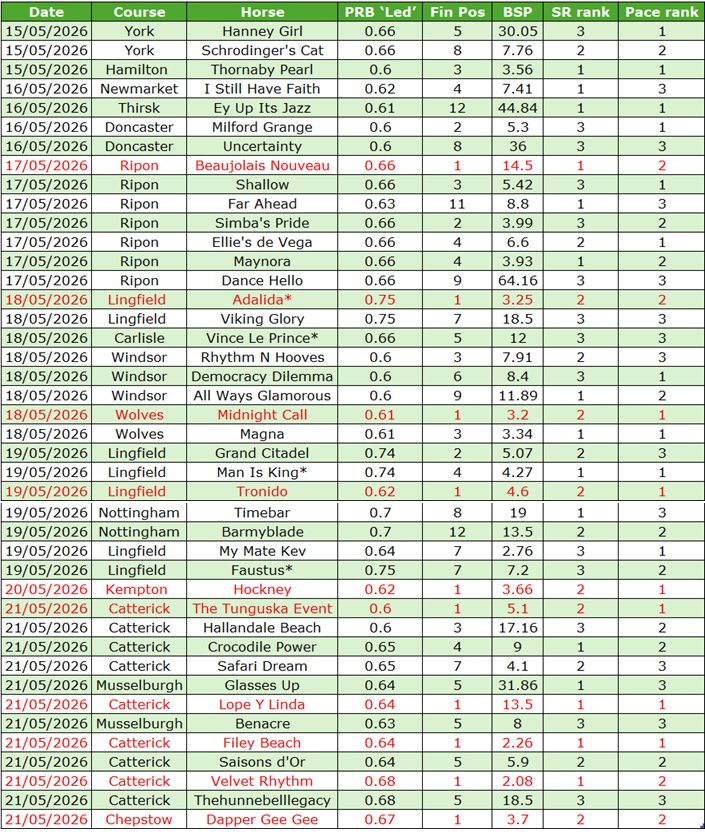
 

Informational table of race results spanning 15–21 May 2026, listing Date, Course, Horse, PRB 'Led', Fin Pos, BSP, SR rank, and Pace rank for each entry (courses include York, Ripon, Lingfield, etc.).


The last two days of the third week (20th and 21st) saw an excellent run of results with six wins from just 13 qualifiers. Previous to that there had been four winners from 29 showing a small loss of £3.88. The overall figures for the week ended up like this:

 

Table of betting stats: Bets 42, Wins 10, Win% 23.81, P/L BSP 12.93, ROI BSP 30.79


We saw the best weekly strike rate to date, but there were less near misses with only three second places (five thirds). Hence, there could be a valid argument that this week was a tad lucky, with so many winners. However, as we know it is better to be lucky than good. Although even better to be lucky and good!

I was three weeks in now and the overall results read as follows:

 

Table of betting statistics: Bets 91, Wins 20, Win% 21.98, P/L BSP 41.32, ROI BSP 45.41


All three weeks were consistent with win rates around the 20% mark and solid profits each time. Will we see a similar pattern in week four? Well, let’s find out.

Week 4

The results for the final week are shown in the table below with winners once more highlighted in red:
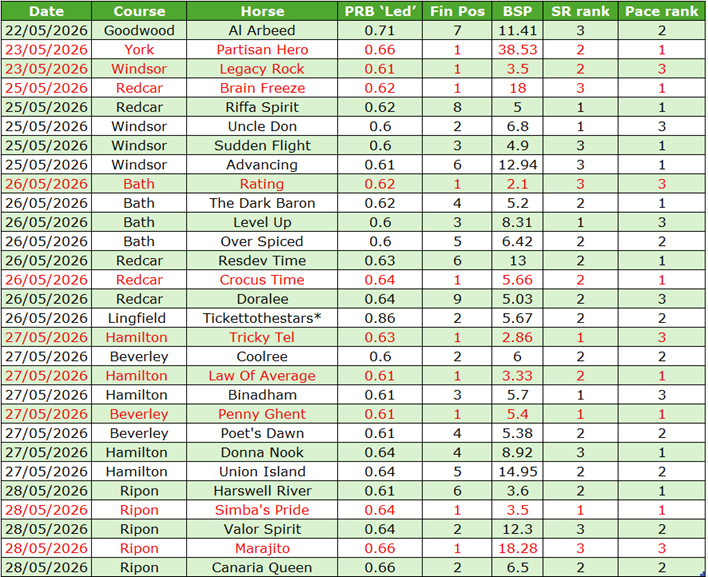
 

Table of 2026 racing results showing date, course, horse, PRB 'Led', final position, BSP, SR rank, and pace rank for races at Goodwood, York, Windsor, Redcar, Bath, Lingfield, Hamilton, Beverley, and Ripon (22–28 May 2026).


The final week of the four-week experiment went with a bang rather than a whimper with ten winners from 29 runners. There were five seconds, too, so over half of the qualifiers finished in the first two. The profit and loss figures are shown below:

 

Compact table of betting stats: Bets 29, Wins 10, Win% 34.48, P/L BSP 70.34, ROI BSP 242.55.


A huge profit and returns across the seven days of over 242 pence in the £. Yes, this bottom line was helped by a BSP winner priced 38.53 in Partisan Hero, but even if we take that winner out, after commission, profits still stood at +33.56.

With the four weeks up, I can now share the final totals:

 

Table showing betting stats: Bets 120, Wins 30, Win% 25, P/L BSP 111.65, ROI BSP 93.04.


This has been a pretty amazing run of results across the 28 days to create such figures. Of course, we cannot get too carried away, as 120 bets across four weeks is essentially a snapshot. However, it is a snapshot that makes me want to expand my research to other weeks and months and see what they bring.

So far, I have shared just the results without doing any additional digging into the underlying numbers; I'm sure there are some extras for us starting with the average PRB figures for the system qualifiers week by week. The graph below shows the splits:
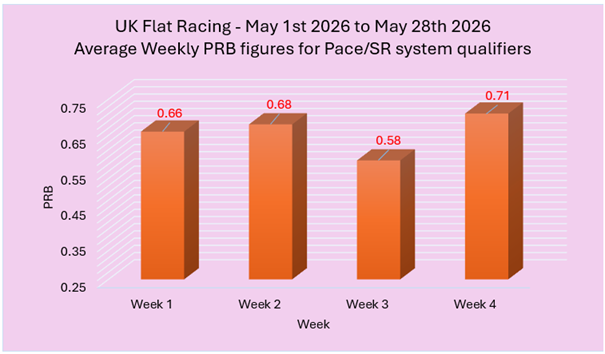
 

Bar chart of average weekly PRB figures (May 1–28, 2026): Week1 0.66, Week2 0.68, Week3 0.58, Week4 0.71 on pink background


When analysing PRBs we need to appreciate that the average figure for all runners in all races is 0.50. This is the benchmark to judge against. Anything above 0.55 is usually seen to be positive and once we get to 0.60 and above then we have a strong positive. Therefore, for three of the four weeks to have average figures for all qualifying horses of over 0.65 is exceptional. Even week 3’s figure of 0.58 is very decent. These findings give me much more confidence in the small four-week sample I have looked at.

PRBs are a useful metric because in many respects they expand sample size by considering all runners in each race. For the record the overall average PRB for qualifiers across all four weeks was a very strong 0.65.

I want to focus now on the 30 winners and see which run style they employed in the individual races where they came home in front. Being in the top three of the racecard pace figures for their specific races means I would have expected a led or prominent style in the race to be more likely than a mid-division or hold up one. The graph below shows the splits in terms of percentage of runners within each run style group:
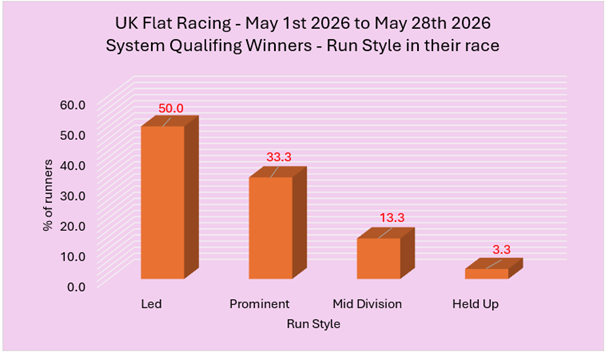
 

Bar chart of run styles among winners: Led 50%, Prominent 33.3%, Mid Division 13.3%, Held Up 3.3% (May 2026)


As predicted (and hoped), we see that most of the winning qualifiers had a led or prominent style; in fact, five from every six winners did. This helps cement further how effective the four racehorse pace figures in the Geegeez Racecard are in terms of helping to predict run style.

Finally, I wanted to look at the results based on their actual ranking within the SR rank and pace ranks. Hence top rated in both would count as a 1,1 in the table below.
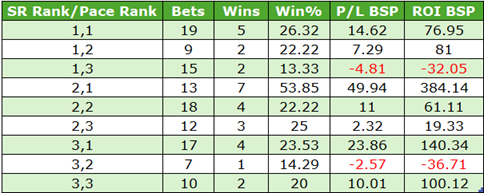
 

Betting performance table: SR Rank vs Pace Rank with Bets, Wins, Win% and P/L BSP (red for losses).


Of course, as we have nine combinations the sample sizes for each are very small. However, what was interesting was when I split the results up comparing those where at least one of the two rankings was top (e.g. 1/1, 1/2, 1/3, 2/1 and 3/1) compared with those that weren’t. Here are the splits:

 

Informational table: two rows of betting stats with bets, wins, and win rate; row1 73 bets, 20 wins, 27.4%; row2 47 bets, 10 wins, 21.28%.


Those with at least one top ranked position did much better. Again, the important caveat is that the samples are quite modest. However, there is a big difference between the PRBs for each group with the 'top ranked' group averaging 0.67 and the other at 0.59.


*


That's enough for this two-parter but I hope, if nothing else, the performance of this Geegeez Gold system, albeit over just four weeks, has provided food for thought. Personally, I will be doing more digging into this system, that is guaranteed!

Until next time...

- DR

More on Combining Pace and SR Ratings

A four-week trial of combining Pace with SR Ratings, Part 1

Back in May of 2025 I wrote a couple of articles looking at 5-furlong handicaps with the focus being the scores for each horse found in Geegeez Racecard pace tab, writes Dave Renham. In the second of those pieces, which can be read here, I looked at a set of results based on the top three horses ranked in terms of pace scores in their specific race, when they also appeared in the top three of Peter May’s SR ratings for said race.

The findings were extremely promising over the whole year for horses in the top three of both as the table below shows:


Table showing betting statistics: Bets 809, Wins 151, Win% 18.67, P/L BSP 82.04, ROI BSP 10.14.


Considering these results came from combining all UK courses, some of which do not strongly favour horses that race close to, or on the pace, I think the results were even more impressive.

In this article I will revisit that idea but before getting to the meat and bones, let me briefly discuss the pace tab and SR ratings, especially for new readers.

The pace tab shows the running styles of the horses for a maximum of their last four races. Each past running style is given a score of between four and one. The breakdown is as follows:

4 – Front runner / early leader

3 – Prominent racer

2 – Raced in midfield / mid division

1 – held up near or at the back early

Past number crunching has noted that early leaders / front runners have a strong advantage over other running styles at some of the shorter distances. This front running bias does not occur at every ‘shorter’ course and distance, but at a significant number.

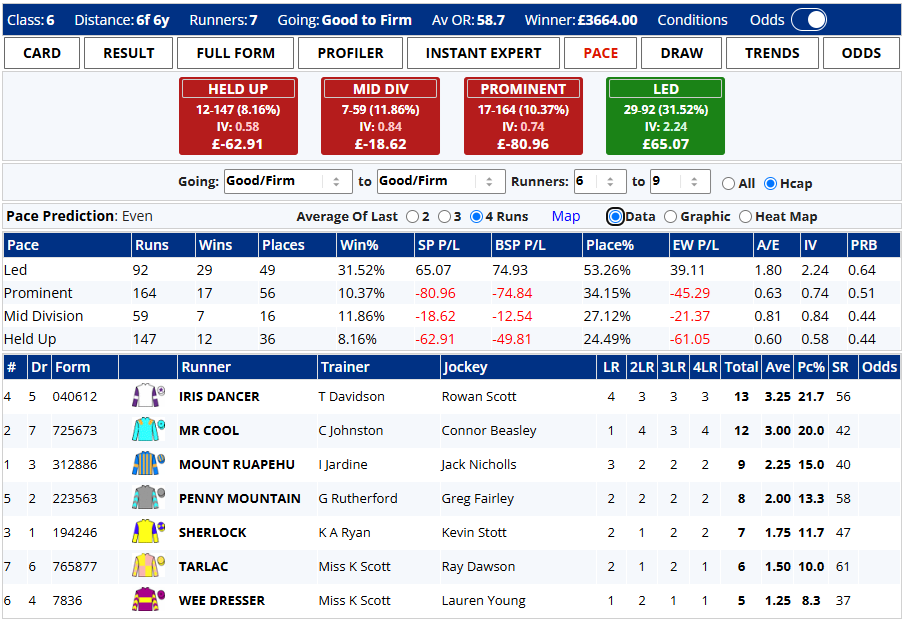
The one tool that should be able to help us is the Geegeez Gold pace tab. Logic dictates that the higher a horses’ pace score total, the more likely it is to lead and, if it leads, then over time such runners are at an advantage offering us punters good value. Let me share an example of a 5f handicap race run on 25th June of this year focusing first on the pre-race pace ratings:


Racing form dashboard showing pace categories Led, Prominent, Mid Division, Held Up with runners and trainer info.


The first point to note, before we look at the pace totals for each runner, is the performance of early leaders over this course and distance (C&D).

The most important number for me is the PRB figure of 0.64 for early leaders/front runners (the ‘Led’ group). That suggests front runners have had a significant edge over this C&D in the past. Hence, this is the type of race where, if we can predict the front runner and back it, we should make good money over time. I will come back and discuss the C&D PRBs later in the piece.

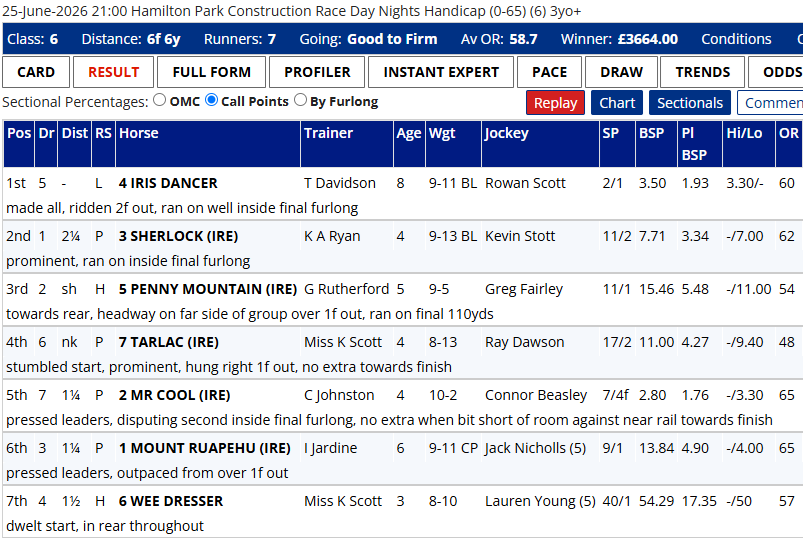
In the image above I have ordered the runners by their pace scores and we have two in double figures, namely Iris Dancer and Mr Cool. Pre-race it seemed likely that one of these two would lead. Here is how the race panned out:


Final standings table for the Hamilton Park 25-Jun-2026 handicapped race: 1 Iris Dancer, 2 Sherlock (IRE), 3 Penny Mountain (IRE) with trainers and jockeys listed.


Iris Dancer did indeed take an early lead and made all the running. Mr Cool was pressing the lead early but eventually finished fifth. The race followed the most likely pattern and the most likely result. Now, of course, there will be plenty of times when a race does not pan out like this, but the odds should generally be in our favour.

Just before I share my new research, I want to briefly talk SR ratings. These are derived from a neural network developed by Peter May. They are much more than a measure of speed; they include a number of form considerations making them a sort of composite of, in Racing Post terms, RPR (Racing Post Rating) and TS (Topspeed) - both of which we also publish in the daily racecards. Crucially, though, the SR figures are not published on every racecard in Christendom, and so fly under the radar considerably more.

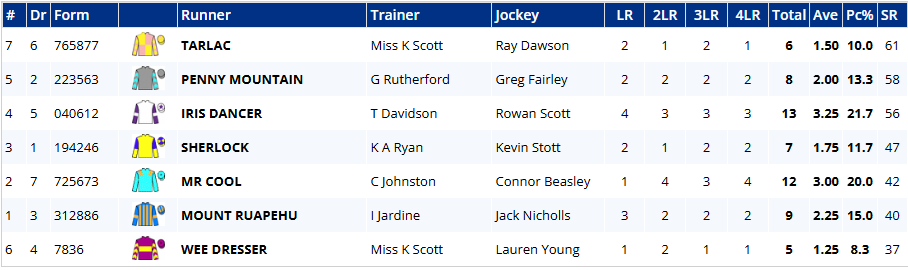
Now, going back to that previous race, let me change from ordering the horses by pace rank to SR Ratings:


Race card: seven runners with form, trainer, jockey, and recent figures for each horse in the table.


Here we see Tarlac top rated on 61, Penny Mountain second on 58 and Iris Dancer third on 56. Hence, based on my previous research article looking at horses being in the top three of both the pace rankings and the SR rankings, the winner Iris Dancer, was the only horse to appear in both top threes.

So, onto today's new research. I thought it would be interesting to come up with a very simple ‘system’ similar to what I did in that original article and test it over a recent four-week period. I chose the first four weeks of May of this year, 2026, to do the testing.

Here are the ‘system’ rules:

  1. UK Handicap races only
  2. Race Distance 5f to 1m1f
  3. The PRB figure for the ‘led’ group on the pace tab for the specific race conditions must be 0.60 or higher
  4. Horse must have one of the top three pace scores for the race
  5. Horse must have one of the top three SR ratings for the race

It should be noted that if there were two joint third-rated pace horses then both would potentially become a qualifier if either or both of their SR rating positions were also in the top three. If there were three or more joint-thirds, then I would count the two with the highest most recent race pace scores. In terms of SR rating joint-thirds, I need to include them all as I have no way of splitting them. Also, if a horse had only three previous pace race scores, I would use their pace average figure to compare with the four race averages that most horses have. In this case, the horses with the three highest averages across either three or four past races would count. I did not consider horses with one or two past scores.

As before I have stuck with handicap races as they give us the most reliable results for this type of idea, but I have expanded the distance consideration from 5f only to races of 5f up to and including 1m 1f. The other main difference is that I am only considering C&Ds where the past data indicates a significant front running bias (PRB of 0.60 or more). For the record, I have excluded any rare three-runner races as all three horses would always qualify in those races under these rules.

OK, let me share my findings. For the rest of this article, I will look at results across the first two weeks, and next week I will share weeks three and four, as well as some thoughts on the four-week trial as a whole.


Week 1

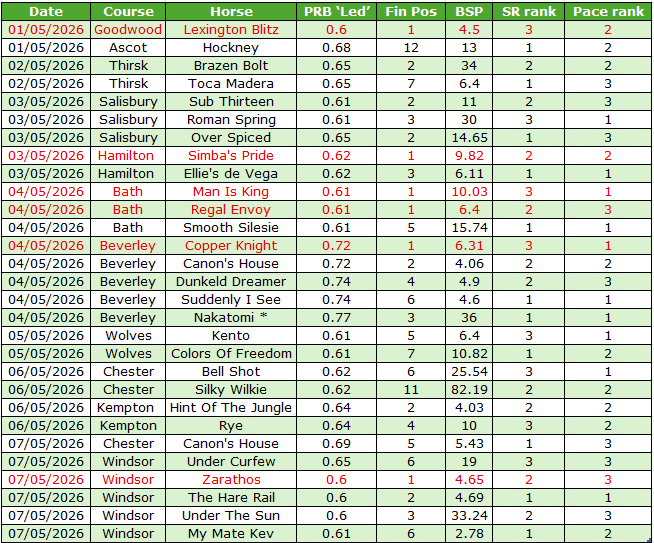
There were 29 qualifying horses in week one and the table below gives each individual result. In the table I have added eight columns – date, course and horse being the first three, then the fourth column gives the PRB figure for ‘Led’ runners under the race conditions for that C&D race (i.e. based on the going and number of runners grouping). Column five gives the finishing position of the horse, then their Betfair SP, SR rank of the horse, and its pace rank.

The results for this first week were as follows with winners highlighted in red:


Table of horse racing results for early May 2026 showing date, course, horse, PRB 'Led', final position, BSP, SR rank, and pace rank (color-coded rows indicate outcomes).


For the record, I have asterisked (*) Nakatomi simply because the sample size for the pace ‘led’ PRB figure came from a very small sample. Most of the PRB ‘Led’ samples came from a very decent number of horses which adds confidence to the overall findings.

Here is the summary for week 1:


Table showing betting stats: Bets 29, Wins 6, Win% 20.69, P/L BSP 12, ROI BSP 41.38.


A very positive start, although with the caveat that there were only 29 qualifiers. Having said that, there were six horses that finished second and a further four that finished third. Therefore, over half of the qualifiers finished in the first three.


Week 2

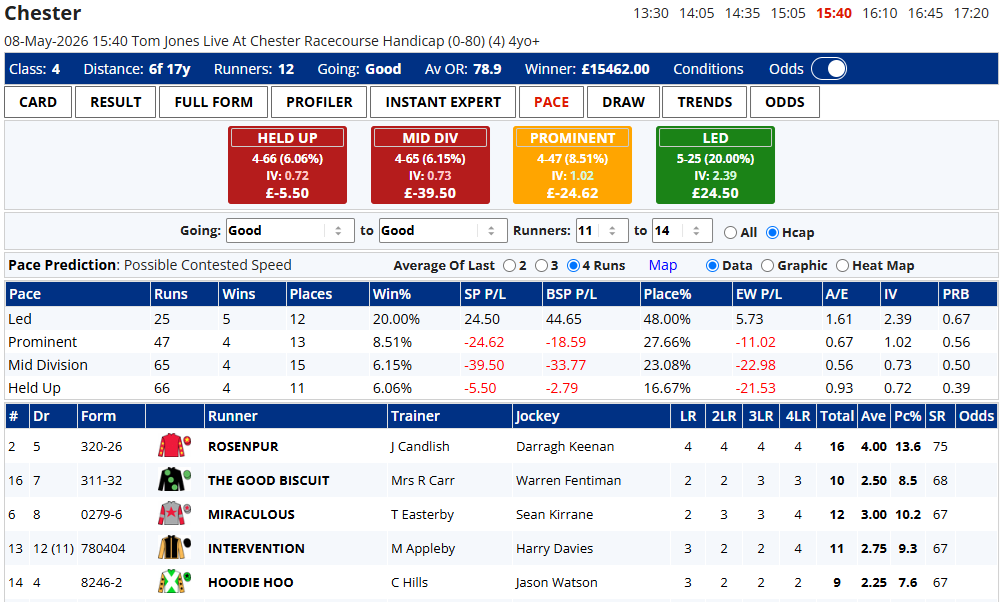
After a great start could the momentum be maintained in week two? The first race in week two where we had qualifiers was the 3.40 at Chester on 8th May. Note that the ‘Led’ PRB for these races conditions (6f, Good going; runners 11 to 14) stood at 0.67 so it comfortably matched system rule three.

I will share both top-rated runners using the SR ratings and then show top rated pace runners to help clarify the selection process. Ordered by SR ratings first:


Chester race card with pace bands, odds, and runner table for 08-May-2026 race.


We had three joint third SR ratings, which actually is extremely rare, but it did mean I had five potential horses that could become a qualifier. Onto the pace rankings now:


Race results table listing three horses—ROSENPUR, MANILA SCOUSE, MIRACULOUS—with their trainers and jockeys, and final scores.


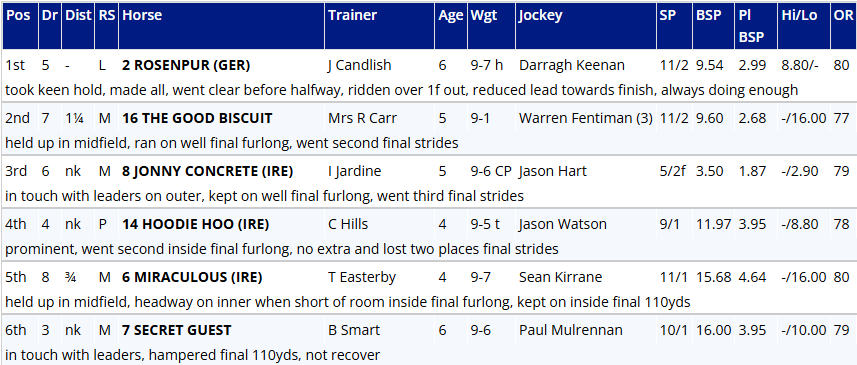
A clean top three here, with Rosenpur and Miraculous appearing in both lists, hence they were both qualifiers. The race result was thus:


Race standings table listing position, horse name, trainer, age, weight, jockey, and notes.


I haven’t given all the finishing positions as we were only concerned with Rosenpur (who won) and Miraculous who finished fifth. An excellent winning BSP for Rosenpur of 9.54 compared with the ISP of 6.5 (11/2). Also, we should note that Rosenpur led early and made all the running.

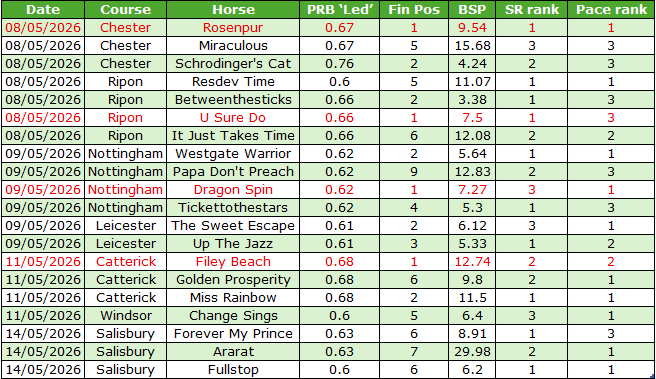
Week two had started on the best possible note and below is a table with all the results from that week including those two.


Table of horse race results with date, course, horse, PRB Led, final position, BSP, SR rank, and Pace rank.


A quieter week with 20 qualifiers and the weekly summary was as follows:


Performance summary table: 20 bets, 4 wins (20%), P/L BSP 16.39, ROI BSP 81.95%.


Four winners from 20 this time and, as with Rosenpur, the other three were good prices (BSP 7.5, 7.27, 12.74), hence the excellent profit figure and ROI%. There were also five more horses that finished second.

After two weeks therefore the overall figures read:


Table of betting stats: 49 bets, 10 wins, win% 20.41, P/L BSP 28.39, ROI BSP 57.94


We see a very impressive set of numbers here, but I do appreciate it's from only 49 qualifiers. Having said that, the winners do not seem to have come out of the blue because along with the ten winners, there were 11 second places, too.

This incredibly simple system, for which Geegeez Gold members are able to work out qualifiers on a daily basis, has started very positively. Will weeks three and four continue this trend? All will be revealed next time... until then...

- DR