Dave Renham: A Window into My World of Racing Research
INTRODUCTION
I am writing the introduction of this article at roughly the midpoint of my research. Hence the style of this piece will be slightly different to my usual framework as normally I have finished the research and number crunching before I start to pen. Regular readers of my articles on Geegeez will know that I often produce a series of articles on a particular topic, but this is a 'standalone' piece.
Now, I would love to have been given a pound for every hour of horse racing research I have done in my life. If totalled up, that money would run into thousands upon thousands of pounds. Fortunately my research has been very varied in terms of what I have researched as well as how I have researched it. That has clearly been a good thing, as using different approaches and/or studying different themes or ideas has helped me to stay curious and motivated. I know from experience that as soon as the research becomes a drag, the likely resulting article is not going to be one of my best.
My research has changed beyond recognition from the late 1990s when I started. Back then, virtually all of my racing work was connected with draw research and especially draw biases. I wrote, or co-wrote, four books in those early years, but it is more the manner of how one researches which has changed so much. In those days, the internet was in its infancy and racing programs were rare. Hence I spent many an hour pouring over my Superform Annuals gathering the draw data I required, initially using pen and paper and numerous exercise books before moving onto basic spreadsheets in Microsoft Excel.
Clearly going through race by race, page by page, then writing down the relevant data or inputting it to excel took time. A lot of time. I lost count of the occasions I was still working at two in the morning; how I was able to get up for work at around 6.30 am is beyond me – it would certainly be beyond me these days! However, there were (and still are) significant advantages to this slow data gathering process. Primarily, this is because you do get a real ‘feel’ for the data you are collating, rather than pressing a button and being presented with the raw stats breakdown.
The first ‘game changer’ for my (and many others') racing research was Racing System Builder (RSB) – this came in CD form and once installed on your PC you had a huge array of variables that you could test either in isolation or in combination. You could create systems and the like to your heart’s content. It was also so quick – a press of a button and several years’ worth of data was collated in seconds. Unfortunately, from my draw research perspective, it was far from ideal as it split the draw into quintiles (fifths). I split the draw into thirds. However, in terms of becoming familiar with other potential research options it was fantastic.
As the years passed racing programs became more widely available as well as websites offering online research options. These programs gave more scope to research different ideas, or combinations of ideas, and with most of my articles being stats based, I could test so many more theories and gather a wider variety of data. So I analysed weight in handicaps, sire data, the effect of the market and of recent form, days since last run, last time finishing position, trainers, jockeys etc, etc. Articles could be researched relatively quickly – all I needed was an idea and the correct filters on the racing program. From there I would collate the data, interpret it and transfer it into the pieces. Obviously they still needed a bit of text and context which I added around the ‘numbers’.
I still research the majority of my articles in this fashion, but for this offering I will be combining the ‘old’ with the new. In other words, I’ll be partly using online databases, but also going through individual races one by one to pull out additional data I require. Not only that, I am going to walk you through exactly how I did it and how I tried to interpret it. Because, who knows, you might like to try something similar yourself!
RESEARCH STARTING POINT
Let me explain my initial thinking in terms of what I wanted to research. As a fan of run style and the draw I wanted to include those components. I also wanted to examine some of the speed rating data Geegeez uses, as well as studying anything around potential market bias. Having decided upon those four key areas, I set about deciding which type of races I would examine. I figured it would be a good idea to stick to similar races so I chose the following rules:
- All weather races in UK
- Handicaps with exactly 8 runners
- Sprint races only (5 & 6f)
- Races run round a bend
The last rule meant that I could include four courses - Chelmsford, Kempton, Lingfield, and Wolverhampton. The only difference in those four to be aware of is that Kempton is the only right handed course. However, I did not perceive this to be a problem.
AIMS OF THE RESEARCH
The aim of my research was to try to find an edge of some kind, which is the same aspiration each time I embark on some new research. Unearthing a killer angle is not always going to happen and, as a researcher, you need to be able to deal with that. Even if I do not find anything ‘earth-shattering’, the chances are I will uncover some worthwhile angles even if they may not quite be the "holy grail" life-changing ones we all dream about.
GATHERING THE DATA
I mentioned earlier that my research would involve a combination of quick database-generated research and the slow 'old school' race by race approach. I decided to study four years of results going from January 1st 2019 to 31st December 2022. That gave me roughly 190 races to start with. 190 races felt like a manageable number as I was going to need to study each one individually as well as reviewing the database output.
In order to get the vast majority of the data I required, I set the necessary parameters on two databases, one being the Geegeez Query Tool, in order to get all the runners from each race into an excel spreadsheet. This gave me my starting point as, once done, I had several columns of key info for each runner such as date, price, finishing position, course, distance, etc. However, there were still three columns missing that I needed, these being some specific run style (pace) data, draw positions and some Speed Rating data.
Speed Ratings Data
The Speed Ratings I was to be using are the Peter May ratings. These can be found in the daily racecards (in the column 'SR') as well as being available to back check in the Query Tool. To gather this info I used the Query Tool to firstly find all the top rated runners, then the second top rated, and finally the third top rated. I then assigned these positions to the relevant horses in the spreadsheet.
Run Style / Pace Data
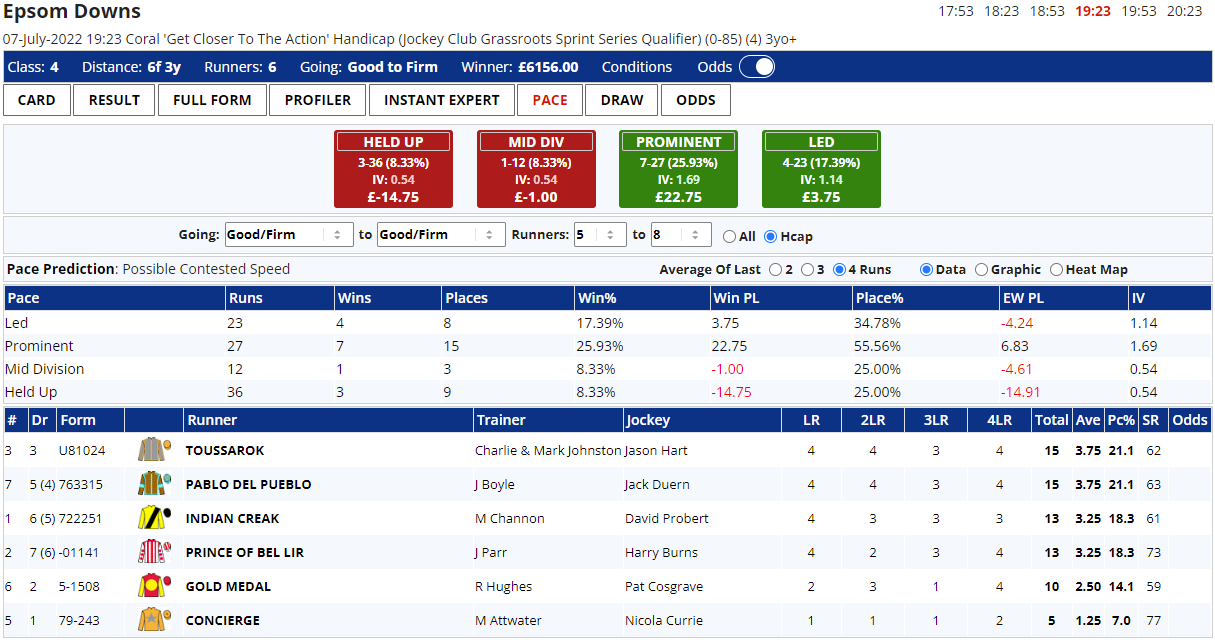
For the run style data I wanted to find the top three horses in terms of their pre-race run style/pace total from their previous four runs. To find what I needed I clicked on a race result, and once the result came up I then clicked on the ‘PACE’ tab. From there I ordered them with highest totals first – an example of what I mean is shown below looking at the 8:20 race at Kempton on 17th March 2021:
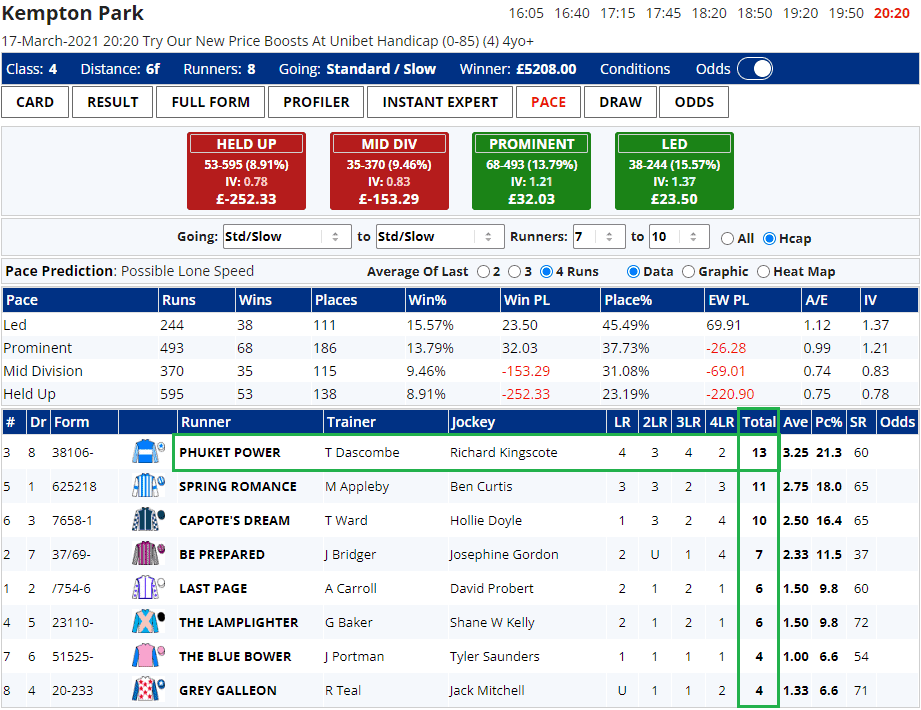
In this example, Phuket Power was top ‘pace’ rated with 13, Spring Romance second on 11 and Capote’s Dream third on 10; thus I labelled these three horses 1, 2, 3 respectively on my spreadsheet. Now, as you can see there were a couple of horses that had a ‘U’ figure. This occurs occasionally when it is unclear from the in-running comments what pace number should be assigned to a specific run. For these horses I double checked different sources, or even watched the start of the relevant race so that I could add the right figure. In this example, the two horses with ‘U’s did not gain enough extra points to move into the top three. You can also see the speed ratings column (SR) I mentioned earlier in the screenshot in the furthest column on the right.
There are times when you get horses with identical four race pace totals, which means it is potentially difficult to get a ‘top three’. An example of such a race is this one from Wolves run on the 5th January 2021:

As you can see, once ordered, four horses are tied in second with 13 pace points. My method to sort out which horse comes where is one I have always used. I compare the horses with the same score (in this case, four horses) starting with the last run (LR) as this is arguably the most relevant. In this example, Alsvinder and Bellevarde score 4, the other two score 3. Hence, Alsvinder and Bellevarde are the two horses that will fill the second and third pace spots as they score the highest on the most recent (and, for me, most important) run. To determine which way round these two came, I then looked at second last run (2LR) and compared their scores. Alsvinder scored 2, Bellevarde 3, so that meant Bellevarde was second rated and Alsvinder third. It is amazing how many races had joint firsts, seconds or thirds in the pace totals, so however you decide to split these 'same score' horses, you need to stick your method every time.
In terms of collating these pace/run style scores, I ignored any race where four or more runners did not have four recent pace figures such as the following race:

The four horses at the bottom, namely Bailey’s Afterparty, Anatiya, Night Narcissus, and Highest Ambition, did not have the required number of runs. Hence I did not add pace scores for this particular race to the spreadsheet and it was not included in any pace/run style calculations. This is simply my personal choice, but I think it makes sense to ignore this type of race at least from a pace and run style perspective.
Draw
For the speed ratings and the pace run style data I was simply interested in the top three – this was due to the vast amount of extra time it would have taken to add in all the remaining five individual hierarchy positions per race. As a researcher, I sometimes have to make sensible decisions in terms of how much time I am actually willing to spend researching something: input for output and all that. However, draw wise it did not take me too long to add the stall positions for each runner into the spreadsheet. I was able to do it in eight groups starting with draw 1 and moving up the draws to finish on draw 8. Essentially eight lots of copying and pasting draw data into a spreadsheet and just matching it up to the relevant race/horse. In terms of Excel, once I had all the draw data pasted in, it was merely using the ‘sort’ function to match each horse up to each draw. The beauty of Excel is that some of the basic functions are really useful from a research perspective; of course, I use more sophisticated functions and formulae as well, which makes it a package that ideally suits my research needs.
Market Data/Bias
For the market data I used the Betfair exchange starting prices (BSP) which I already had in the original starting spreadsheet. From here I sorted them and assigned a market position from 1 to 8 to each runner in each race. It made sense to use BSP because it typically avoids horses having the same price, as would be the case if using Industry SP. Market Rank is something that is easy to check on a database like the Query Tool, but I wanted to be able to combine 1sts, 2nds and 3rds and see whether there were any patterns that may help in pinpointing potential straight forecast and tricast type options. It would be unlikely as these types of exotic bet are clearly in the bookmaker’s favour, but as someone who has often used such wagers in draw-biased races in the past, I thought it was at least worthy of investigation. In fact, I wanted to check forecast and tricast results for all four of the key areas I was researching.
NUMBER CRUNCHING
With everything I needed now in the spreadsheet it was time to start crunching the numbers. When I get to this point I am obviously hoping to find some golden ‘nuggets’, but I am humble enough to realise that the percentages are not in my favour in terms of uncovering something with gilt-edged profit written all over it.
Draw
First stop was to look at the draw. Below are the win strike rates (blue) and the each way strikes (orange) for each draw/stall position. I have accounted for non-runners; so, for example, if the horse drawn 1 was a non-runner, then the horse drawn 2 would become draw 1, etc.

I have added two lines of best fit (the dotted ones) to show the trend. Horses drawn closer to the inside do have an advantage over those horses drawn wider. Now of course, this fluctuates from course to course and from distance to distance, but as a general rule, on turning sprint tracks a lower draw is preferable due to its position closer to the inside rail.
The BSP profit/losses and returns are shown in the table below:
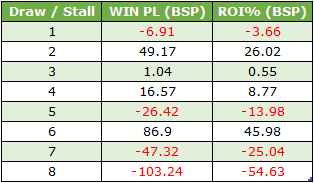
This table clearly illustrates that the two widest draws have delivered the poorest returns. It is perhaps only what one might expect to find as a researcher, but it is nice when the numbers match the theory. Horses drawn 2, 3 and 4 have all secured a small profit to BSP and, ultimately, the focus draw-wise in these races should probably be on the four lowest stalls. Clearly, horses drawn 6 have actually produced the biggest BSP profit but, with winners at 95.0, 44.0 and 36.0, these figures are skewed somewhat. Whenever you look at profit and loss, it is a good idea to check the prices of all the winners in each respective group.
Looking at the intra-race exotic bets now, I decided to check out forecasts (CSF) and exactas combining horses drawn 1, 2 and 3; for tricasts and trifectas I combined the horses drawn 1 to 4.
Both forecast and exacta options would have produced virtually identical losses – around £140 to a £1 stake if perming the three lowest draws in each race in a full cover permutation (six bets in total). This would equate to losses of roughly 12p for every £1 bet. As far as tricasts and trifectas were concerned there was a big difference in the overall bottom line as one race saw the following result:
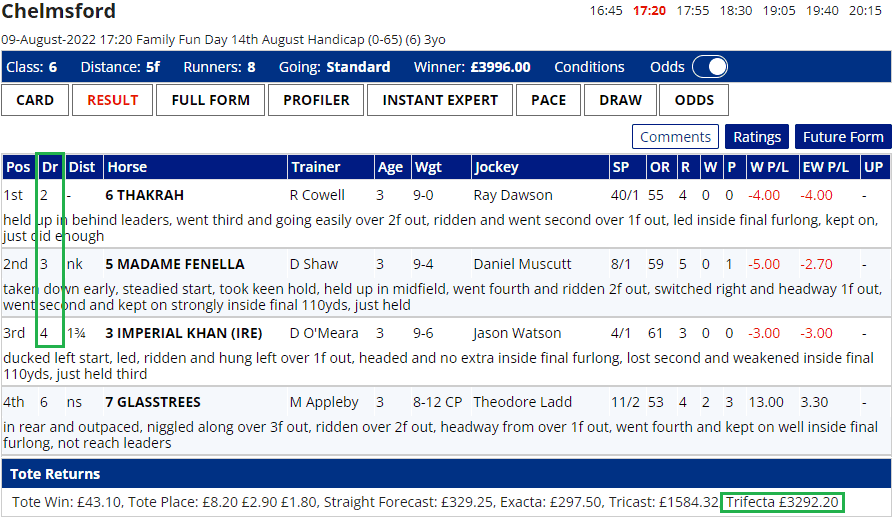
As you can see at the bottom of the screenshot the trifecta paid £3292.20, the tricast considerably lower at £1584.32. Overall, perming the lowest four draws in all 189 races in a full cover perm (24 bets) would have seen the trifecta in profit to the tune of 22p in the £ (ROI 22%); tricasts would have produced losses of 27%. This specific race with its trifecta payout perhaps illustrates why these types of bet can lure punters in. A huge payout is always a possibility and of course these types of bets can be wagered with relatively small stakes if you wish (eg. 10p a line would be an outlay of only £2.40 per race). My view is that in general they are a fun bet rather than a serious one, but having personally won £20k on a tricast back in 2004, these exotic bets are worth considering, especially if you feel you have a potential edge. However, you will almost certainly need a big win or two to make it pay over the longer term.
BSP Market Rank
Moving away from the draw, my next port of call was to look at BSP Market Rank. Here are the win percentages for each market position (1 = favourite, 2nd fav, etc):
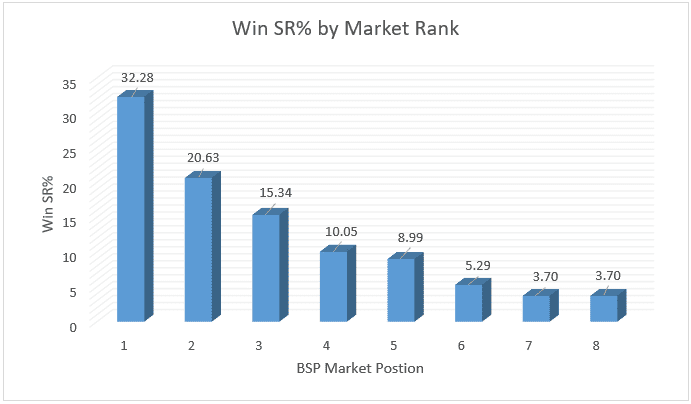
We can see a familiar sliding scale here, with favourites winning close to one in every three races. Of course, strike rates are all very well but punters need to see the bottom line; so here are the profit and loss figures at BSP:

The top three in the betting have combined to effectively break even. The outsiders of the field have proved the most profitable thanks in the main to a 61.08 BSP winner.
On the exotic bet front perming horses from the front end of the market is generally a route to the poor house. Perming the bigger priced runners requires the patience of a saint, coupled with the requisite good luck. Also, as I have mentioned in many previous articles, the problem with any market based bet is that we do not exactly know what their final prices are going to be. Obviously we can back as late as is humanly possible, but even then we may not be completely accurate in terms of what we are attempting to do. For the record, the three biggest priced runners filled the first three places in just one of the 189 races, which would have yielded a humongous profit, but more about that particular occasion a bit later...
Run style
Run style / pace is next on my agenda. I wanted to examine the performance of the top three pace scoring horses (as discussed earlier). We know that run style/pace is key, especially in sprints, but of course these pace scores are based on the last four runs, not the actual race in question. One would hope that if a horse has shown early pace in recent races then there is a good chance of that happening again, but of course horse racing is not an exact science, so this is not a ‘given’. Here are the records of the top three scoring horses from the pace tab:

A 95.0 winner was the main reason for the 2nd top rated profit, but what I did notice was that, as a group, the top three pace rated horses outperformed the horses pace ranked 4th to 8th. The average win percentage when combining the top three pace scoring horses was 14.7% (81 wins from 552 runners); the average win percentage for horses ranked 4th to 8th was 11.2% (103 wins from 920 runners).
Sticking with the top three pace rated runners from each race, I compared the 5f handicap results with those for 6f handicaps. My expectation / theory is that they should be slightly more successful at the shorter trip. Here are the stats:

The 5f runners have produced a better win strike rate which backs up my theory, but the 6f runners have produced a better profit. However, that 95.0 winner I mentioned previously was from the 6f group, so this perhaps validates another of my long held theories even more: 5f races offer the strongest run style/pace bias of all the flat distances.
In terms of forecasts, exactas and the like, perming the top three pace rated runners in straight forecasts would have seen you effectively break even. Perming the top two instead (known as a reverse exacta/forecast) would have seen a 22p in the £ profit for exactas, a small 2p in the £ loss if going the CSF route. Trifectas/tricasts when perming the top four pace rated runners would have shown big losses equating to roughly 45p in the £.
Peter May Ratings
The final area to look at is the Speed Ratings data/results. As with pace/run style my focus was the top three speed rated runners in each race. Here are the results:
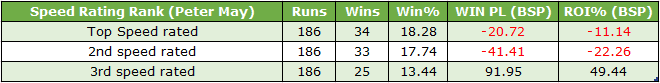
There are no prizes for guessing where that 95.0 priced winner popped up! Now, although the top two rated horses did not make a profit, on the plus side their strike rates were above the norm. With eight runners in a race, the average strike rate for each of the runners given a level playing field is 12.5% (12.5 x 8 = 100). So to have strike rate around the 18% mark is quite decent for all that the ROI is still in negative equity.
Perming the top three speed rated horses in forecasts made a small 5p in the £ profit over the 186 races that were rated; exactas though produced a loss of around 11p in the £. Tricast / trifecta perms of the top four speed rated produced a phenomenal overall profit across the four years of around 60p in the £ thanks mainly to this result:

This was the race I mentioned earlier regarding the three biggest BSP priced runners filling the first three places. As you can see, there was a massive payout for both the trifecta and the tricast of over £5,500 and, as the racecard below shows, these horses were not only in the top four of speed ratings, they were actually the top three speed rated:

This result is a second example of why some punters do like these types of bets. What is there not to like about getting £5,500 return from a £24 bet; or, to smaller stakes, a £550 return for a £2.40 stake?
The four key areas have now been studied but before winding my work up, I thought it might be interesting to combine certain factors together to see what would results they would have brought.
COMBINING TWO FACTORS/AREAS
Speed Rating / Pace
I wanted to check out what happened when a horse had both the highest speed rating in the race and the highest pace total from their last four runs. Unfortunately there were only 31 horses that matched this criteria. However, six did win creating a profit to BSP of £7.66 (ROI +24.7%). I decided to expand this to horses that had one of the highest two speed ratings coupled with one of the two highest four race pace totals. This gave me 108 qualifiers of which an impressive 28 won (SR 25.9%). To BSP they would have made you a profit of £26.15 to £1 level stakes (ROI +24.2%). This was highly satisfactory, especially considering there was only one double-figure priced winner (BSP 15.5). Also, a further 20 horses hit the post finishing second.
It is clear that 108 horses from 108 races is a relatively small sample, but it does offer some impetus to expand this idea by looking at other 5f and 6f handicaps on the turf as well.
After finding this interesting and potentially profitable idea, it seemed to make sense to combine the ‘top two’ from different areas from now on. Would any other combo get close to those impressive figures?
Speed Rating / Draw
Horses drawn 1 and 2 that were also one of the top two speed rated runners occurred in 111 races. Of these 23 won (SR 20.7%), but they produced a BSP loss of £13.55 (ROI -12.2%).
Speed Rating / Market Rank
Horses first or second in the betting that were also top two in the speed ratings produced the following numbers – 49 wins from 153 qualifiers (SR 32.0%) for a small BSP profit of £14.56 (ROI +9.5%). This is another area I want to investigate further.
Pace / Draw
What about combining draws 1 and 2 with the top two pace rated horses? This partnership produced 98 qualifiers of which 19 were successful (SR 19.4%). A small loss of £1.02 was made equating to 1p in the £.
Pace / Market Rank
Looking at the top two in the betting who were also in the top two of the four race pace ratings, these runners won 29 times from 103 starts (SR 28.2%) for a minute profit of £1.92 (ROI +1.9%).
Draw / Market Rank
Onto the last pairing now. Horses drawn 1 and 2 that were either favourite or second favourite combined to score 33 times from 122 runs (SR 27.0%) for a small loss of £7.34 (ROI -6.0%).
"Top four combo"
My final stat to share is when a horse was in the 'top two' of all four of the sections at the same time; that is, horses from the top two in the betting, drawn 1 or 2, first or second in the speed ratings and having the highest or second highest last four race pace totals. Not surprisingly I suppose, there were only a handful of qualifiers, 14 to be precise. But... eight of those 14 did win! Profits of £10.28 would have been achieved equating to returns of around 73p in the £. The chances of this type of strike rate and performance being maintained is unlikely to say the least, but it's worth keeping an eye on!
CONCLUDING THOUGHTS
Well, this has been quite a journey for me and a long one at that. Having to go through race by race is hard work, but ultimately I think the research uncovered some interesting findings. Not only that, it has inspired me to do some more digging around these themes, albeit it will no doubt be rather slow digging!
Before I finish I should mention that all BSP profits and losses have taken a 5% commission into account, as that gives the truest reflection of real life returns using that medium.
Until next time,
Dave Renham