Topspeed Ratings in UK National Hunt, Part 2
An analysis of Racing Post’s Topspeed (TS) in UK National Hunt Racing, Part 2
This is the second article of two looking at the performance of the Racing Post’s speed ratings, known as Topspeed, in National Hunt races in the UK, writes Dave Renham. In the first piece, which you can read here, I looked at a variety of Topspeed stats including win rates for different rating positions, percentages of rivals beaten (PRB), and some general stats for top-rated and second-rated runners.
Introduction
In this concluding half I will dig deeper into the performance of top-rated runners, looking first at non-handicaps and then at handicaps. As with the first article, for the most part when talking about the Topspeed Ratings I will use the abbreviation TS.
The next paragraph is basically a carbon copy of what I wrote in the first article, as it gives some background information regarding the TS ratings. Feel free to skip it if you have read the first one.
First and foremost, TS ratings are the Racing Post’s Speed Ratings. The raw TS figure is a measure of the speed a horse achieved in a particular race. It is amended slightly considering things like distance, weight carried, and the ground conditions. Essentially the TS is calculated by comparing a horse’s time with a standard time for the same course and distance. The TS figure we see in the Geegeez Racecard are known as adjusted TS ratings with the main adjustment made for weight carried in the current race. I believe the TS handicapper also tweaks this adjusted TS rating for the current race conditions. The adjusted TS figures we see in the Racecard are based on the best raw TS performance in the past 12 months. These performances must have occurred in the same ‘Race Code’, so for NH racing, past hurdle race TS raw ratings will be used for hurdle races only, while past chase TS ratings will be used for chases only.
My focus for this article, as stated earlier is UK National Hunt racing, and I have ignored hunter chases as many of these horses have been running in point to points; I am also excluding NH Flat races run on the AW. Data has been taken from January 1st 2019 to December 31st 2025, with the profit/loss figures calculated to Betfair SP (BSP) less 2% commission.
Non-Handicaps
By TS Rank
I want to begin by focusing on non-handicaps races and I will start in a similar way to last time by looking at the win percentages (strike rates) for different TS-ranked runners in non-handicap races.
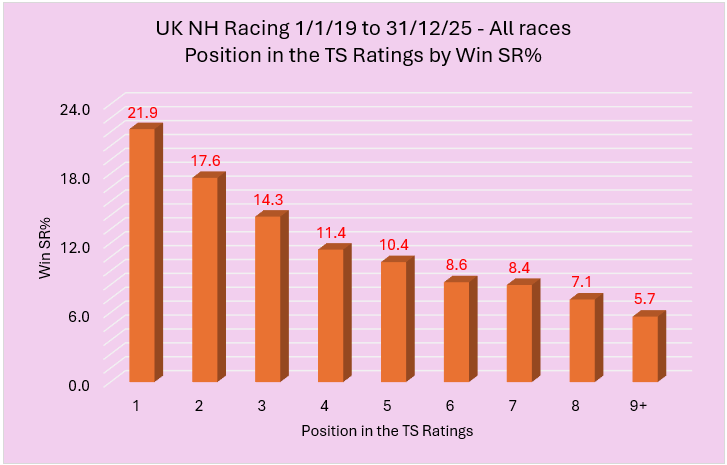
We saw in the first article that for the ‘all races’ data the graph showed strong correlation between rank position and strike rate. Let’s see if that has occurred when focusing on non-handicaps only. In terms of understanding the graph, the horizontal axis is labelled from 1 which stands for the top-rated runner, 2 is the second rated and so on:

The win strike rate for TS top-rated runners has been an impressive 31% in these non-handicaps with a significant gap to the second rated on 19.5%. Arguably more importantly, the win percentages have correlated positively once more with the TS ranked positions. We have the left to right sliding scale that is the ‘ideal’.
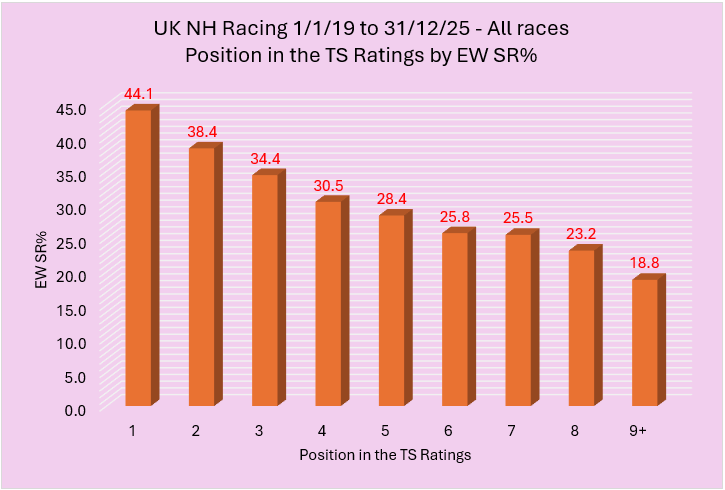
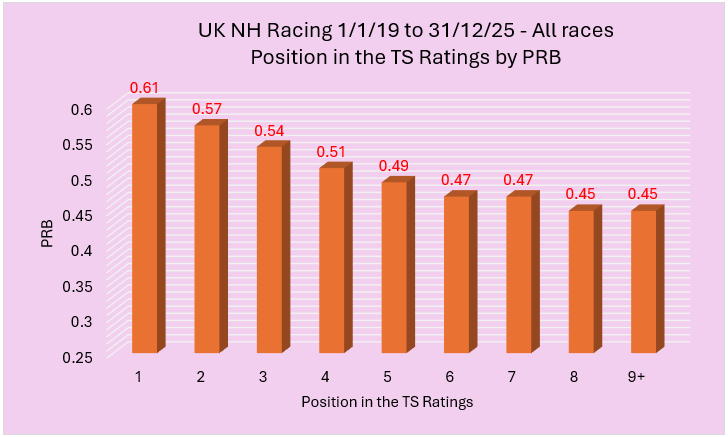
Each way strike rates for individual positions correlate also, showing the same sliding scale. For the record, the top-rated runners in non-handicaps have finished in a win or placed position over 56% of the time. Below are the PRBs (Percentage of Rivals Beaten) by TS rank:

We can see high PRBs for both the top-rated (0.70) and second top (0.61), whereas we get similar low figures from 6th downwards (0.43, 0.42 or 0.41).
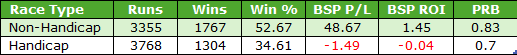
Here is the record of every TS top-rated runner in non-handicaps since 2019:
![]()
A small profit would have been achieved in non-handicaps backing all top-rated TS runners ‘blind’. Let’s now split this data into different areas or sections.
Race Type – TS top-rated runners
Firstly, in terms of non-handicaps, I am going to look at different race types to see if the TS top-rated runner fared any better in either hurdle races, chases or NH Flat races.

Despite having the lowest win percentage, NH Flat races provided the best returns for TS top-rated runners in non-handicaps. An ROI of a smidge above 12p in the £ was impressive. Top-rated chases also turned a small profit, and at a very healthy one in three strike rate, too.
Sticking with NH Flat races, the TS top-rated runners finished in the black in six of the last seven years. The annual returns (ROI) are displayed in the graph below:

2022 was the one losing year, but overall, the NH Flat results for top-rated runners have been good and consistent.
Race Class – TS top-rated runners
A look at race class next starting with a table:

The highest level of race (Class 1) endured the poorest results by some margin. These races delivered the lowest PRB of 0.60 and losses in excess of 13p in the £. All Class 1 races have shown similar levels of loss: Grade 1s were down around 11p in the £, Grade 2s around 13.5p and Listed races a whopping 16p in the £.
Conversely, Class 2 races enjoyed the best profits, although the bottom line was skewed somewhat by a BSP 90.0 winner. That said, shorter priced TS top-rated runners had a very good record in Class 2 non-handicaps. Those priced 2/1 or shorter won 69 races from 114 for an excellent strike rate of 60.5%, producing a profit of £28.64 (ROI +25.1%).
Class 3 contests were also kind to these 2/1 or shorter priced runners, hitting a 57% win rate and returns of over 10 pence in the £.
Market Rank – TS top-rated runners
In the first article I looked at market rank across all races. Here are the splits solely for non-handicaps when it comes to the TS top-rated runners:

There was no clear pattern here unfortunately in terms of profit / loss. I am slightly surprised at the relatively poor returns for second favourites especially considering that favourites were marginally profitable.
Age – TS top-rated runners
A look at the age splits now:

Three-year-olds performed well and returned a tidy profit although a few big priced winners helped. However, it should be noted that 3yo favourites also proved profitable thanks to 84 wins from 147 (SR 55.1%) for a surplus of £20.45 (ROI +13.9%). On the flip side, 8yos and up had a relatively poor record losing 12p in the £.
Run Style – TS top-rated runners
When we examine run style, the general pattern sees front runners score more often than prominent racers who in turn out perform mid-division runners, while hold up horses tend to have the lowest win rates. Below are the win strike rates by run style group for TS top-rated runners in non-handicaps:

The graph perfectly aligns to the stereotype: horses which led did best in terms of strike rate, and if we had been able to predict their run style pre-race we would have basked in returns of over 12p in the £. Compare this to top-rated runners which were held up - they collectively lost a massive 35p in the £.
Handicaps
By TS Rank
Time to switch to handicaps now and the performance of the TS top-rated runners in those races.
Before that, I want to share the win percentages (strike rates) for different ranked runners:

Top-rated runners again secured the best strike rate, but only just. In terms of each way strike rates the top-rated runners still came out top on 38.1%, with second rated next on 36.3%. The remaining positions in the ratings continued the usual sliding scale showing positive correlation with the win rates.
In terms of PRBs the splits were as follows:

The PRBs follow the same pattern as expected, although the top three rated positions were all within 0.02 of each other.
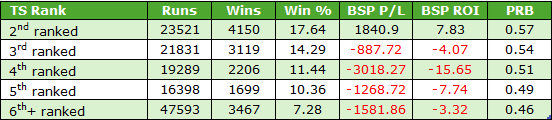
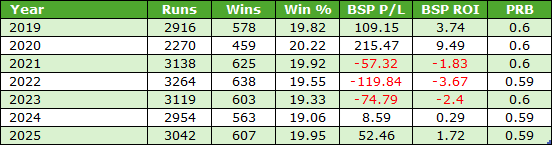
It is time now to look at the record of every single TS top-rated runner in handicaps since 2019. The figures make for positive reading:
![]()
We see a very small profit, but a profit nonetheless, from simply backing the top-rated Topspeed horse in all handicaps. I'm sure we'll be able to improve on that as we delve deeper.
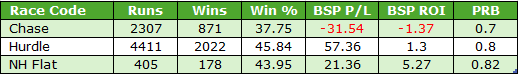
Race Type – TS top-rated runners

There was quite a difference in terms of profit and loss between race codes. Handicap chases saw TS top-rated runners do extremely well and, although they have had a sprinkling of big priced winners, their record at the shorter end of the market was impressive too. Focusing on TS top-rated runners priced 11/1 or shorter in handicap chases, the following totals emerge:
![]()
These are a very solid set of metrics, and it should be noted that for this specific cohort, five of the seven years would have turned a profit.
Race Class – TS top-rated runners
Race class is next up and the results from 2019 to 2025 were as follows:

Just as we saw with non-handicap races, top-rated runners in Class 1 handicaps struggled. In fact, their record was very poor with a win rate of less than 7% and losses of over 30p in the £. Listed races were the worst performers within this cohort with just two wins from 73 top-rated runners. I am not sure why Listed races came out that bad, particularly when Class 2 races again saw the best returns, mirroring what we saw with the non-handicap results. There were five winning years out of seven at this class level.
Market Rank – TS top-rated runners
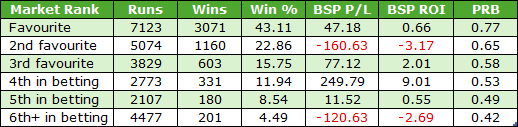
Here are the market rank splits for handicap races only when it comes to the TS top-rated runners:

Favourites effectively broke even with second favs producing a very small loss. The value seems to have been with those ranked third to fifth in the betting market, though the top five combined showed a handsome profit and a solid ROI. Once we hit sixth or higher, performance and returns have dipped somewhat.
Age – TS top-rated runners
Onto the age stats now. Here is how they have panned out across the time period (I have ignored 3yos this time as there were only 23 qualifiers):

This has been a bit of a mixed bag with no clear patterns other than the 9yo+ group having the lowest PRB figure by some way as well as the lowest win strike rate. It will be difficult to use these stats to our advantage so it may be best to ignore age with any top-rated runners we might be looking to back in the future.
Run Style – TS top-rated runners
As with the non-handicappers, let me share the win strike rates within their specific run style groups:

There are no surprises here with the bars dropping down as we go from led (left) to held up (right). If we had been able to predict pre-race the run style of every single TS top-rated runner in handicaps, we would be retired now! The splits looked like this:

This is just another example about the importance of position early in a race – even in NH races.
**
Well, that’s about all for now. In conclusion, I hope these two articles help to point you in the right direction when it comes to the TS ratings published on geegeez racecards. TS top-rated runners have an impressive record overall and, based on past results, there has been plenty of value to be had under various circumstances. Hats off to the TS team at the Post – they have been doing a very good job.
Once the flat turf season gets underway, I will aim to do some further digging and share TS stats for that code. The all-weather and jump racing results have surprised me a little, and in a good way. It will be interesting to see if we find similar performance on the level.
- DR