
A Comparison of Trifecta and Tricast Payouts in Horse Racing: Part Two
This is the second article in which I have compared two exotic bets - the tricast and the trifecta, writes Dave Renham. The trifecta was the better option in the first piece, which you can read here, considering all qualifying races. It paid out more than the tricast in roughly eight out of every ten races. In this follow up, I will share some more of my findings.
The data was taken from UK and Irish turf flat handicap races run in 2023, in which there were between 10 and 14 runners. As I mentioned last time, this amounts to just over 1000 races, and I have excluded any race where there was a dead heat in one of the first three positions as the payouts get split. I have also excluded races where there was no trifecta payout. This happens occasionally when the pool size is small, and the first three horses home were unfancied/decent prices.
The first piece examined general comparisons and then delved into individual course data. In this piece, I will revisit some course data and examine some Starting Price data.
Trifectas at Specific Racecourses
In the first article, I compared average course payouts for trifecta and tricast and how often the trifecta ‘beat’ the tricast in percentage terms. Here, I want to share some findings regarding how frequently one of the bets paid at least twice as much as the other.
Looking at all 1011 qualifying races, the trifecta paid at least double the tricast on 145 occasions, and the tricast paid at least double on only 20 occasions. Hence, 14.3% of all races saw a trifecta payout of at least double the tricast (2% of races for tricast at least double the trifecta). Below is an individual course breakdown showing the percentage of races where the trifecta paid at least twice the tricast dividend. They are listed with the biggest percentages at the top.

The top three are all Irish courses, which is interesting. The Curragh tops the list, with the trifecta being twice or bigger than the tricast in roughly three out of every ten races. For those who remember some stats from the first article, the Curragh had the highest percentage differential when comparing average payouts. Hence, seeing the course also tops this list is no real surprise.
Chester lies at the bottom of the table, and I wonder whether this is due to the well-known low draw bias, especially over shorter distances. I can imagine, for example, that horses drawn 1 and 2 would appear in punters’ trifecta bets more often than at most other courses. Therefore, with the trifecta bet being a pool bet, if either or both draws 1 or 2 finish in the first three, the returns will be lower because of the extra money placed on these draws. I cannot categorically prove this, but that is my theory.
While discussing draw bias, the draw can also affect the computer-generated calculation on tricast payouts when three horses drawn close together finish in the first three. I am unsure how the deduction is calculated, but a serious one can occur. Let me give you an example of such a situation. The 2022 Victoria Cup had the following result:
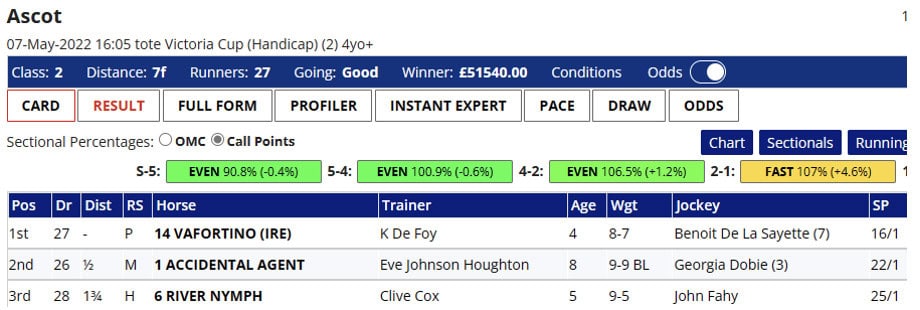
The first three finishers came from the three highest draws. Usually, with prices of 16/1, 22/1, and 25/1, I would estimate that the tricast would pay around £8700 to £9300. However, on this occasion, the tricast paid just £4377. This is a clear example of where a draw-biased race sees a much lower return.
I tried to find another big field handicap where the prices of the first three were the same, and there was no draw bias in play. The closest I could find was the result of the Ebor handicap at York in 2019.

Hence, the 1st and the 3rd prices were the same in both races, but the second was three points bigger at 25/1. The tricast, on this occasion, paid £9605. Given the slightly higher price for the second-placed runner, I would estimate the payout may be bigger by a few hundred quid. However, the York payout was over £5000 higher than the Ascot one, which helps demonstrate that draw bias tricasts can be severely compromised.
Impact of odds of horses in the first three
I would now like to share my findings related to the prices of the runners within the first three finishing spots. I will start by looking at the winner's price and see what effect that had on which of the two bets came out on top more often.

As the first line of the table highlights, when the winner was a short price, 2/1 or less, the trifecta win percentage dropped somewhat. The first article noted that the trifecta outperforms the tricast just over 80% of the time but drops to just over 70% here. However, the reverse was true when an outsider took the first spot with winners priced between 20/1 and 28/1, with the trifecta prevailing 85.4% of the time, and winners priced 33/1+ seeing that figure rise to 89.5%.
These figures suggest that trifecta bettors overbet short-priced runners, at least when placing them in first position in their 1-2-3 bet. In contrast, bigger-priced horses are underplayed in terms of being placed in the first position of trifecta bets. Placing runners priced 2/1 or shorter in the first position of your trifecta bet will yield more winning bets, but one could argue that the better value lies with bigger-priced runners placed in that first spot.
Now I will try a similar idea, investigating what percentage of races saw the trifecta beat the tricast based this time on the prices of the second-placed horses. The graph below shows the percentage of the races where the trifecta came out on top:

The graph illustrates that, in general terms, the trifecta’s edge over the tricast drops as the price of the second-placed runner increases. The two have no perfect correlation, but the trend is clearly downward.
These figures suggest that putting shorter-priced runners in the second spot in the trifecta is a good idea. This time, bigger-priced runners (20/1 plus) finishing second are not so ‘trifecta friendly’.
Time to share this type of data for horses that finished third:

We see a similar pattern to the second-placed results. Shorter prices in the third spot considerably improve the chances of the trifecta payout exceeding the tricast one. In contrast, horses finishing third and priced 20/1 or bigger see the trifecta edging closer to parity with the tricast.
The ‘price’ findings across all three finishing positions suggest that trifecta bettors can improve their chances even further of getting the bigger payout between the two 1-2-3 bets by considering prices in conjunction with the finishing position. Therefore, one would surmise that trifecta bettors could potentially increase their returns as well if adopting such considerations.
Of course, instead of a single-position price analysis, we should look at combinations of prices for the first three finishing positions. I have started to do this, but even using the price brackets from earlier, there are far too many potential combinations to crunch and analyse. Also, many such combinations would have occurred very rarely over these 1011 races, and hence, those findings would not be statistically significant. Consequently, I have looked at a few more ‘general’ cases.
General Case Studies
Case 1 – The top three finishers are all priced 11/2 or shorter
This scenario occurred in 60 races, so it has a good sample size. Here are the percentage splits for which of the two bets came out on top more often.
![]()
A resounding success for the trifecta was when all three runners were at or near the head of the market. Now, a look at the average payouts of the two bets when these prices occurred:

On average, the trifecta has paid £37 more than the tricast, which equates to a 50% edge. Therefore, when the prices of the runners in your proposed 1-2-3 bet are within these parameters, you should use the trifecta.
Case 2 – The top three finishers are all priced 17/2 or bigger
This time, the prices of all three finishers are much higher. Indeed, 97% of all horses priced 17/2 or bigger from these races were outside the top four of the betting. Hence, this is quite an unusual occurrence and as a result we have only 28 qualifying races. So, this is a smallish sample, but let’s see what the stats say, starting with the percentage splits for which of the two bets came out on top more often.
![]()
We see quite a different picture compared with the 11/2 or shorter results. The tricast came out on top more, albeit the difference equated to just one race (14 ‘wins’ to 13).
Onto the average payouts now:

A second win for the tricast averaging £377 more, giving the tricast close to a 13% edge per bet (on average).
However, I must share some extra information as two tricast payouts in this subset were unusually high. The first, at Newbury, saw the tricast pay £11,662, and the second, at Windsor, paid £16,900. The trifecta payouts, in comparison, were much lower - £6373 at Newbury and £5547 at Windsor. Taking those payouts away, the remaining 26 races where the first three were all priced 17/2 or bigger provided the following average payouts:
![]()
We are back to the usual picture painted in these two articles, where the trifecta averaged more than the tricast.
Ultimately, my two takeaways from races where the first three home were all priced 17/2 or bigger are:
a) trifecta payouts fluctuate much more, and b) the bigger the tricast, the more chance the tricast has of returning more than the trifecta.
The draw seems luckier for trifecta bettors within these price parameters. I guess smaller pool sizes may play a part in this, but I have not investigated this yet, so I cannot say for certain.
Case 3 – Top three finishers priced between 5/1 to 10/1
Ideally, I wanted to use prices that I hadn’t used in the previous two ‘case’ examples, but if I had used ‘the missing’ price bracket of 6/1 to 8/1 for all the top three finishers, there would have only been four qualifying races. Hence, I have extended the price boundaries on each side to give us a more ‘middling’ group of prices compared to the first two. That gave us a decent sample of 62 races. Once again, I will start with the percentage splits for which of the two bets came out on top more often.
![]()
This price spread amongst the first three horses has again favoured the trifecta. Now to the average payouts:

The trifecta has a significant edge here regarding average payouts, averaging £171 more per race than the tricast. This equates to 44%.
I have one additional stat that hopefully will be of interest. Focusing on this subset of results, 17 of them were run at Grade 1 courses (Ascot, Doncaster, Epsom, Goodwood, Newbury, Newmarket, Sandown, York), and the trifecta paid higher in 16 of the 17 (94%). At the same time, other races saw the same payouts (to the nearest £). I appreciate that this is a small sample but a worthwhile ‘share’.
**
Summary
Both articles contain quite a lot of data to digest but I hope they have helped those of you who dabble in these exotic bets to maximise your chances of getting better long-term returns than you may have previously.
Of course, not many of us will achieve long-term financial success from these bets. The edge the bookmakers or the Tote have to begin with puts punters at a significant disadvantage. However, these findingd should assist in taking a big chunk out of their advantage if nothing else.
From a personal perspective, when I have some time, I plan to dig further into combinations of prices for the first three finishers, as I feel I have only scratched the surface. I also plan to revisit the whole trifecta/tricast area from an article-writing perspective, as I would like to examine standalone National Hunt data and possibly all-weather data, too.
-DR


