
Horses racing in the same race that they contested last year
Back on January 2nd 2025, Geegeez incorporated an excellent addition to the racecard namely the TRENDS tab, writes Dave Renham.
Geegeez Trends
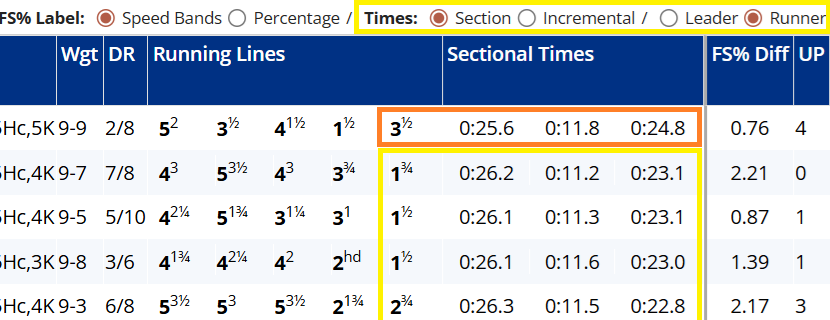
Before discussing my plan for this article, let;s take a look at the TRENDS tab in a little more detail. Clicking the TRENDS tab will take us to a screen like the one shown below:

These were the trends for a handicap race at York which occurred fairly recently, on the 25th July 2025. The left-hand half of the screen is focused on standard information, like winning horse, trainer, jockey and going. The middle to right-hand of the screen has further info including the weight the winner carried, the age it was, its SP, official rating, and so on.
Note the red font. Any jockey in red means they are riding in the race again this year. Hence past winning jockeys in this race Oisin Orr and Rowan Scott had rides again in this 2025 renewal. Likewise for trainers, Bailey, Fahey, Nicholls and Ellison had runners this year too. There was one horse highlighted in red namely Dicko The Legend, and this horse was trying to repeat its win in 2024. (As it turned out Dicko The Legend did win the race for the second year running).

When we click on the TRENDS tab for a particular race, if we click on any race date this takes us to the result of that race for the selected/clicked year.
In addition, all of the columns within the TRENDS tab are sortable, making it easy to see if a specific profile is emerging around any of the variables. Hence, some races can offer up some useful past trends that we might be able to use to our advantage. The point of past race trends is not really to pinpoint winners - after all, looking only at win trends is a narrow field of vision for such a thing - but, rather, to highlight potential positives and negatives for horses that you are considering in the round of their overall form profile. Geegeez also has regular articles written by Andy Newton which highlight key trends in certain big races.
As far this article is concerned, I want to examine the performance of horses that ran in the same race the previous year. How often do winners manage to double up? And what about horses that ran in the race last year but did not win? Well, let’s see...
I have looked at UK flat racing (turf & AW) between 1st Jan 2017 and 31st Dec 2024. Any profits and losses have been calculated to Betfair Starting Price (BSP) less 2% commission.
All Runners Returning to the Same Race A Year On
The first thing to say is that not all races can have repeat winners or indeed runners from previous years, such as those restricted to horses of a certain specific age group. However, there have been plenty that contested the same race as in the previous year so what do the stats show us?
The table below shows us ALL runners that came back a year later to contest the same race but split into those that won the race last year versus those that did not:

As we can see the previous year’s winners have won more often, but in terms of returns they would have lost us a bigger percentage of our bankroll. In fact, both ROI figures are disappointing in truth. I had hoped for and expected better.
Perhaps not the start we were hoping for then, but there is an early positive to share when looking at horses that finished runners up the previous year – they have turned a small profit:
![]()
The win rates for last year winners compared to runners up are similar, but have those past winners been overbet driving their average price down? If we compare the average prices for previous year winners compared to previous year runners up, we might get some pointers:
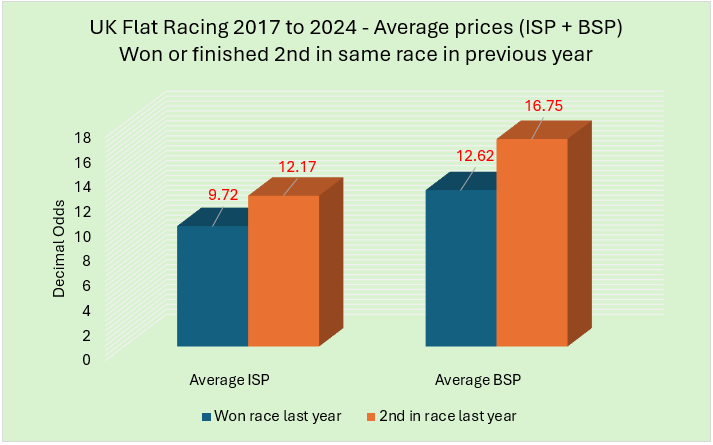
Both the average decimal odds for the Industry SP and Betfair SP show a lower figure for the horses that won the race the previous year. I tlooks like horses trying to repeat their win a year later have been overbet by the punting fraternity after all. I’ll come back to this later.
Horses that Won the race last year
Handicaps vs Non-Handicaps
Despite the overall results for horses that won the same race the previous year not being that positive, let me dig a bit further to see if any positives can be found. Or indeed any strong negatives. I’ll start with non-handicaps versus handicaps:

As might have been expected there are far more horses trying to repeat a win in the same handicap race than in non-handicap races. There is a higher strike rate in non-handicaps which is also to be expected, but returns have actually been worse.
Race Class
What about splitting the results up by class of race? I have not included Class 7 races as there were only five qualifiers (who all got beaten).
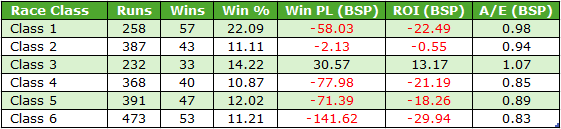
The strike rate in Class 1 events is decent but this is partly because all races were non-handicaps. If we exclude Class 1 races, there does seem a trend where the lower classes of race have offered last year’s winner less value.
When lumping together the results for horses that tried to repeat their win in Class 4, 5 and 6 races, losses amount to nearly 24 pence in the £, with a poor BSP A/E index of only 0.85. I would be steering clear of these runners unless I had a gilt-edged reason to convince me otherwise.
Class 2 and 3 races have produced the best returns, and an interesting stat is when we look at the results in 3yo+ handicaps across these two classes: winners of the same race the previous year have gone on to repeat their success 53 times from 395 runners (SR 13.4%) for a profit of £89.76 (ROI +22.7%). Also, if we restrict further to the most fancied runners, those priced BSP 4.5 or less, this cohort would have produced 18 winners from just 38 qualifiers (SR 47.4%) for a profit to Betfair SP of £23.22 (ROI +61.1%).
Turf vs All-Weather
I next wanted to compare turf races with all-weather (AW) ones. Would there be similar results? The answer is an emphatic no as the graph below comparing A/E indices shows:
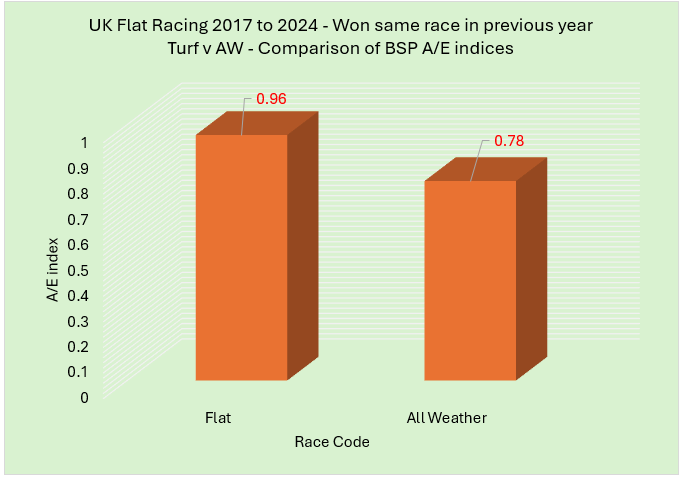
Horses that won the same race last year have proved far better value in turf races than AW ones as the numbers clearly show. Indeed, the other metrics back these A/E indices up:

There was a better win strike rate for turf performers and a very clear ‘win’ in terms of their respective returns. OK, turf runners have not proved to be profitable, but they have returned close to 30p more in the £ compared to AW runners.
Sticking with the AW for a minute, the worst time in the calendar for last year’s race to have been run has been during the winter AW season. From November to March the record reads a dismal 37 winners from 337 (SR 11%) for a loss to BSP of £154.55 (ROI -45.9%).
Courses
With turf racing producing the better stats, what about different courses? Has it been easier to repeat wins on certain courses compared to others? One slight issue is limited data for some courses, so let me start by grouping together the results on the ‘best’ tracks - those tracks that are considered Grade 1 tracks. These are Ascot, Doncaster, Epsom, Goodwood, Newbury, Newmarket, Sandown and York:
![]()
These have combined to edge us into blind profit which is pleasing to see. Splitting the results by individual track see the following four hit a profit:

There is one other course I would like to mention and that is Chester. The figures for horses trying to repeat their win the previous year is decent – 11 wins from 57 (SR 19.3%) for a profit of £23.41 (ROI +41.1%); A/E 1.35.
Trainers
A quick look at trainer performance next. Data again is limited and only a handful of trainers have had more than 30 qualifying runners. They are shown in the table below:

There are two trainers that stand out, namely Richard Fahey and David O’Meara. Both have strike rates above 20% and have returned good profits with excellent A/E indices. These two trainers are worth noting in the future with the previous year’s winner attempting a repeat.
Overall, it has been hard to find many positives for horses trying to repeat their last year’s win but I have uncovered a small handful.
For the second part of this piece I'll look at runners up from the race the previous year as they gave us a better starting baseline as we saw earlier.
Horses that were 2nd in the race last year
Handicaps vs Non-handicaps
I’ll start as before with non-handicap results versus handicaps:

We see the same type of difference in win percentage but this time non-handicaps have provided far better returns. Having said that, handicappers have still gone close to breaking even.
Race Class
Race class now and it will be interesting to see if the performance in the lower classes of 4 to 6 is poor as it was for the last year’s winners:
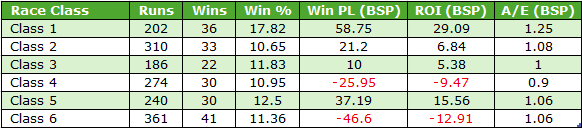

Class 4 and 6 have incurred losses once more although Class 5 results buck the earlier trend. Once again Class 6 results have proved to be the worst from a profit/loss/returns perspective. It is interesting to see the positive performance in Class 1 events with this cohort of runners. Their strike rate is 4.27% below that of the last year winners’ group shared earlier, but they have turned a 22p in the £ loss to a 29p in the £ profit. The reason for this is the same one discussed earlier when looking at each groups’ results as a whole; it comes down to the prices that have been on offer for each group and the averages prices in Class 1 races have been as follows:

Once again, we see that the average decimal odds for the Industry SP and Betfair SP are showing lower figures for the horses that won the race the previous year. The difference between the average prices for each group is much bigger than we saw for ALL runners. In these better class races it looks like race winners from the prior year are significantly overbet, while the runners up from a year ago were significantly under bet.
Turf vs All-Weather
Turf versus all-weather next. Will we see the same pattern as earlier with turf results outperforming AW ones by some margin?

Overall, the metrics as a whole are much closer, but the profit/loss and returns still show turf races to be comfortably the better option.
Courses
Onto courses now and a look at the performance of the Grade 1 tracks. They produced solid results earlier, how about now?
![]()
These are even better than we saw for the combined results of last year winners. Doncaster’s figures were strong once again, producing returns in excess of 90p in the £ thanks to a 20.8% strike rate (11 wins from 53).
Trainers
Trainers will be my final port of call, and as before data is limited. Only four trainers had over 30 qualifying runners:

Four familiar faces from before. Again, O’Meara’s stats are excellent, while Fahey’s are not as good as we saw earlier. Meanwhile, Tim Easterby has a poor record with these runners.
Conclusions
I have always been a fan of past race trends over a time frame of 10 or 15 years. This is especially true at the big meetings such as the Cheltenham Festival, Royal Ascot, Glorious Goodwood, etc. I feel better quality races tend to produce stronger profile patterns. We have seen in this piece, although we have only focused on horses that came first or second in a specific race a year prior, that better class races tend to produce the most positive results; likewise the higher profile courses do the same.
Other Key findings
- Horses looking to repeat a win in the same race the following year are generally over bet, while runners-up from last year’s race are generally under bet.
- Turf results have been far stronger than AW results for both winners / runners-up from last year’s race.
- David O’Meara has an excellent record with horses that were first or second last year and returning to run in the same race.
- Avoid Class 6 races in terms of both last year’s winner / runner-up.
That's all for this week. More racing data crunching next Wednesday. Until then...
- DR
Other Recent Posts by This Author:
- Uttoxeter 3m Handicap Chases: Deep Dive
- Miscellaneous Jump Racing Angles
- The ‘Super Six’ NH Jockeys: What Happened Next?
- A Look at Favourites in All-Weather Races
- Kempton 7f Handicaps: Deep Dive


![Constitution Hill and Nico De Boinville lead all the way to win the Betfair Fighting Fifth Hurdle at Newcastle from Epatante [right] and Not So Sleepy [left]. 26/11/2022 Pic Steve Davies/Racingfotos.com](https://www.geegeez.co.uk/wp-content/uploads/2022/11/ConstitutionHill_FightingFifth2022.jpg)


Hi Dave,
Great stuff.
I’m wondering what those same trends/stats would come with for any of the trainers horses who ran in the same race last year irrespective of whether it placed in first 4 or not as the case may be?
What I’m getting at is this…. for example; a horse runs well in this years race but maybe got hampered and was only managed 3rd, 4th or whatever. Over National Hunt Courses a horse could be running well and maybe unseat the jockey or get hampered by a faller. The is happy enough to have another go at the same race next year.
hope this better explains
Kindest regards
Liam McDonnell
Hi Liam
Your idea certainly makes sense. Whether I have the tools to check this trainer idea though is another matter. I will be doing the same type of horse based article for NH racing at some point in the next few months to see how it pans out in those races.
Hi Dave, Brilliant article yet again, thank you. I use another site as well as Ggz, and look under the Shortcuts section to see which horses are running today, that ran in the corresponding race last year. I will pay more attention to the runners up now.
I did some work on NH trainers taking a horse back to a specific track that they had won there before (I went back as far as 2016). All those below made a decent profit and ROI on Betfair at the time I did the work.
N Alexander – Kelso, Newcastle
P Bowen – Cartmel, Ffos Las, Stratford
A King – Wincanton
D Sayer – Cartmel Perth
Sue Smith – Newcastle
Jane Williams – Exeter
The latter was exceptional from her runners – (2021 -2025) 16/63 wins @ 25.4% s/r. Plus £55 @ starting price, £75.61 profit on Betfair with ROI +120.
Good to know Richard and thanks for positive comments about the article.
Dave
Leave a Reply
Want to join the discussion?Feel free to contribute!