
Horses aged three or older: analysing their first run in a flat handicap
In this article, as the title states, I will be looking horses having their first run in a handicap race on the flat, writes Dave Renham. Specifically, I am ignoring two-year-olds and focusing solely on horses aged three or older. Data have been taken from 2018 to 2025 in UK flat and AW handicaps with profit/loss calculated to Betfair Starting Price (BSP), less 2% commission on any winning bets.
All Qualifiers
Let me start by looking at the results for all qualifiers across the eight years of study.
![]()
As we can see these horses have won roughly once in every nine starts and have made an overall profit. Of course, the figures are skewed somewhat with nine winners priced over 100.0 BSP, the highest being BSP 431.91. Hence, as I tend to do with most of my articles, it makes sense to impose a price cap to try and avoid certain stats looking better than they actually are. I think including horses up to BSP 16.0 is a sensible price point to use, and I will implement that for the remainder of the article.
So, let me look therefore at the figures for all qualifiers that were priced BSP 16.0 or less.

![]()
We still see a small overall profit which is interesting. It is clearly worth digging a bit deeper given this positive starting point.
Race Class
I want to look first at the ROI percentages for all these qualifiers (BSP 16.0 or less) in their respective Race Class.
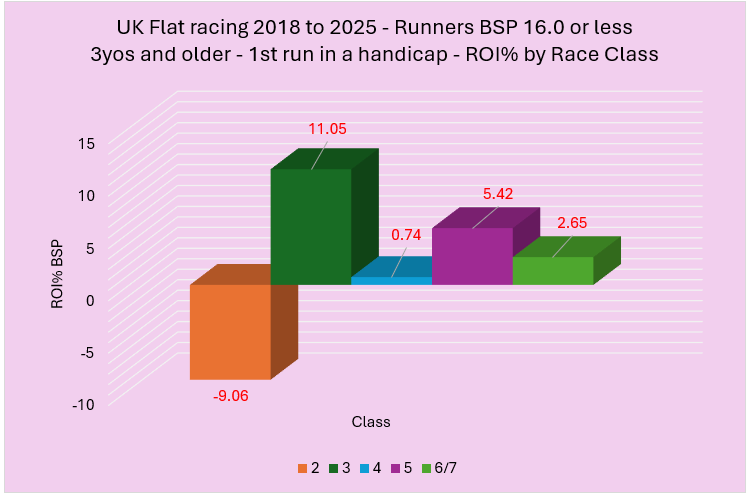
I have grouped Class 7 with the Class 6 results and for the record there were only seven qualifiers from Class 7 races. There were four Class 1 handicaps during the period of study, but they don’t exist anymore, so it seemed pointless to add them in.
The graph shows that Class 2 qualifiers struggled in comparison, and the table below gives us a deeper breakdown:
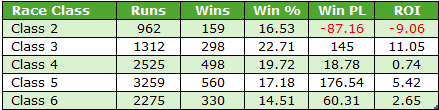
Class 2 handicaps are contested by the best handicappers so that might be a reason why horses having their first run in a handicap struggled a little at that level. All other Class brackets edged into profit, with Class 3 first-timers doing best.
Age of horse
Now, let me split the results by age.
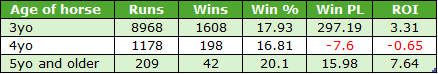
It should come as no surprise that the vast majority of runners have been aged three and, overall, they have had a solid record. Not many older horses (aged five or more) qualified, as would be expected, but actually as a group they have done well.
Sex of horse
Now I would like to look at the record of male horses versus female ones. The breakdown below is based on the results of mixed sex races, those races open to both sexes. It makes no sense to include male or female only races in any such comparison:
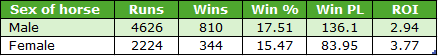
There was roughly double the number of male runners, which is the norm, and although they had a better win rate, females have been slightly better value when priced BSP 16.0 or less. However, in truth there has been little in it.
Position LTO
Let me now look at performance based on last time out position. The graph below shows the returns to BSP for each group:
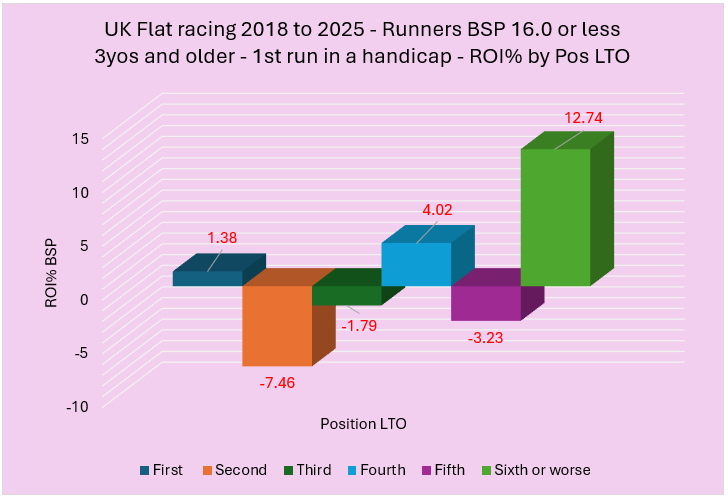
As the graph illustrates, the value has been with horses that were soundly beaten last time (those finishing sixth or worse). Below is a table showing more keys stats including strike rate and the actual profit/loss figures.
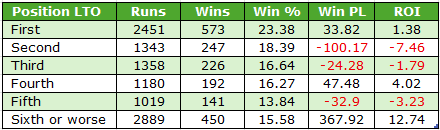
My perception looking at all the evidence is that horses that finished second last time have been overbet, which makes sense to me, whereas those finishing sixth or worse have been under bet, hence they have offered a bit of value.
Previous Career runs
How about previous number of career runs? Has that made any difference? Let's take a look:
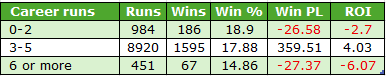
The vast majority of qualifiers had raced three to five times previously which makes sense because most horses qualify for their first handicap run after three previous career runs. This group produced the best returns as we can see. The performance of those with six or more runs was the poorest, but even losses of just over 6p in the £ is not the worst we have ever seen by some way.
Previous runs over the distance
I wondered if the number of previous runs over the race distance made any difference. Here are the splits:
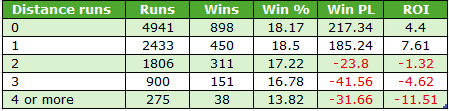
Based on these stats, previous distance runs of zero or one have both given positive outcomes. Performance has started to tail off a little for runners with two previous runs over the distance, getting slightly worse for three, and then being relatively poor once we get to four or more. Albeit the four or more group is very small in comparison with the others.
Trainer Angles
Onto the area that many readers enjoy most: trainers and their performance. Below is a table containing all trainers who had at least 75 runners making their first run in a handicap when priced BSP 16.0 or less:
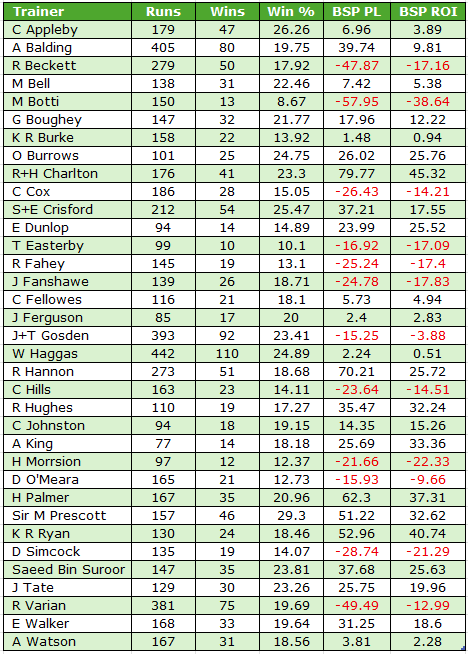
There are more trainers in profit than showing a loss in this table, (23 vs 12), with a few standouts. The Charlton stable, Kevin Ryan, Hugo Palmer, Alan King, Sir Mark Prescott and Richard Hughes have all managed to achieve returns in excess of 30 pence in the £. Let me share some ‘extras’ in regard to these six stables:
- The Charlton stable had six winning years in a row from 2019 to 2024, but 2025 did saw just one winner from 17. Variance, or something else?
- Kevin Ryan had an outstanding record with his sprinters when making their handicap debut. Of the 60 runners over five or six furlongs 18 won (SR 30%) for a healthy profit of £74.85 (ROI +124.7%). He also did well at Newcastle scoring six times from 17 runners (SR 35.3%) for a profit of £14.87 (ROI +87.5%).
- Hugo Palmer has been consistent with six winning years out of eight.
- Over 1m 4f Alan King’s runners have excelled, winning seven races from just 16 runners returning a huge 264p in the £.
- Sir Mark Prescott has long been renowned for this handicap debutants. He is 5 from 10 at Yarmouth over the past eight seasons and 8 from 25 at Wolverhampton securing decent profits at both. Ignoring his favourites, which tend to be over bet, his record reads 26 wins from 106 (SR 34.5%) for a profit of £52.64 (ROI +48.7%). Also keep an eye out for his runners that finished well beaten last time out. Those that finished sixth or further down the field LTO have won 30 times on handicap debut from 101 starts (SR 29.7%) for a profit to BSP of £26.95 (ROI +26.7%).
- Richard Hughes, like Palmer, has been very consistent with seven winning years out of eight. His female runners have secured returns of over 78p in the £.
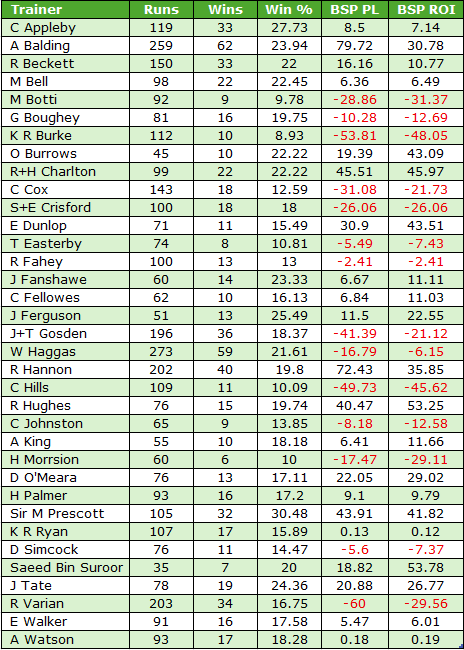
With most of the runners being 3yos, I want to examine trainer records with 3yos running in 3yo only races compared with running in 3yo+ ones. Firstly, the overall trainer numbers from 3yo only handicaps:

Again, several trainers stand out, and below is a graph showing the trainers with the highest A/E indices based on BSP prices. This is a metric that helps to determine good value. All these figures are above 1.20 which are very strong indeed.
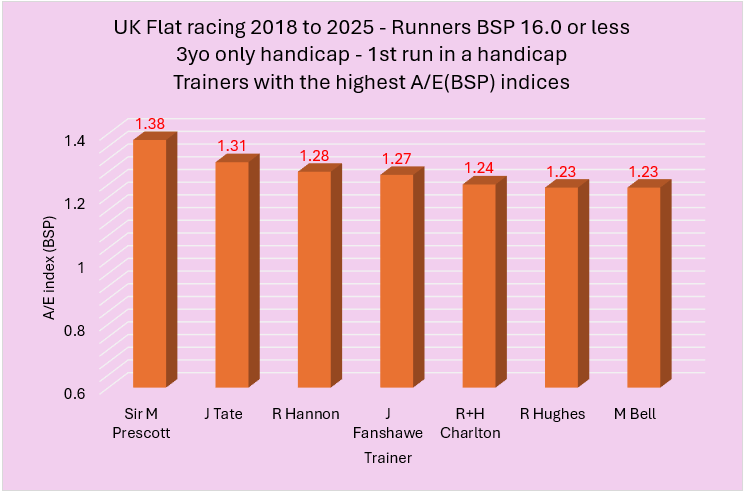
I will be keeping any eye out for handicap debutants in 3yo only races from these stables this year. For the record Richard Hughes turned a profit with these runners in seven of the eight years; Richard Hannon and the Charlton stable in six apiece.
Now a look at the 3yo+ handicap race data for these trainers with their 3yos have their first run in a handicap:
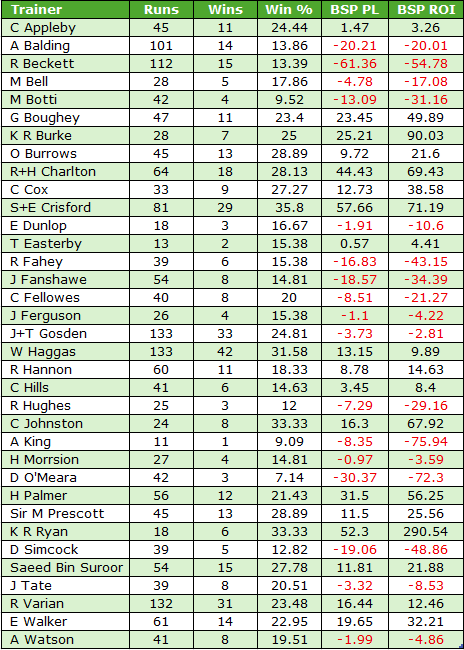
We drop down now to roughly half the trainers in profit, which makes sense I guess considering these 3yos will be up against older, more seasoned horses in such races. Also, the sample sizes for most of the trainers are smaller than the 3yo only ones, and in many cases much smaller. Only Saeed bin Suroor has run more 3yo debutants in races for older horses compared to races for 3yos only.
I thought it would be a good idea next to compare both the win strike rates and the A/E (BSP) indices for each trainer in 3yo races versus 3yo+ races with their 3yos. Remember the price cap is in place still at BSP 16.0. I have colour coded the A/E indices – anything 1.15 or above suggest good value and is coloured blue; anything 0.80 or lower is coloured red which suggests poor value.
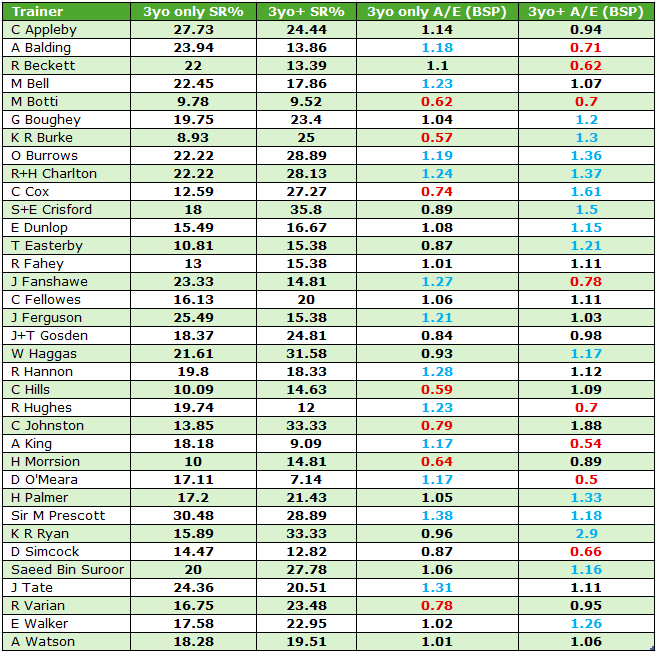
There are some significant differences for certain trainers when comparing their records in the different age group races. Below is a quick ready reckoner table to show the trainers with the biggest contrasts:
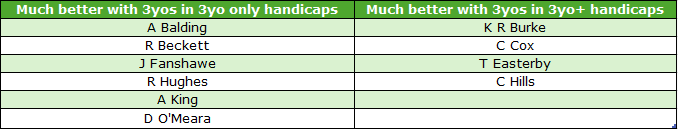
*
That's all for this one. Lots to go at in terms of profitable angles for three-year-olds running first time in a handicap. Here's hoping we catch a nice one or two in the coming days, weeks and months. Until next time...
- DR
Other Recent Posts by This Author:
- Course Topography: Uphill Finishes
- The Impact of Last Time Out Run Style
- Combining Pace and SR Ratings, Part 2
- More on Combining Pace and SR Ratings
- A Look at Summer All-Weather Racing


superb . Thankyou Dave. A fantastic article and very useful.
Great piece as ever .
I followed it up assuming the horse lost its first attempt at 3 yold handicaps to see how it got on next time out again in a handicap for 3 yold
And filtered by trainers.
Makes interesting results too .
Hope this makes sense
Great article Matt. You have encouraged me to take more notice of three year olds making their handicap debut.
Nigel.
great article Dave. I like to speciliase in 2 yr old races but usually stop when the nurseries start. Would their be any value in looking at first time in nurseries?
Very good piece.
Profits to be made.
Leave a Reply
Want to join the discussion?Feel free to contribute!