
Back in early February, I wrote a piece about 3-mile handicap chases at Uttoxeter, writes Dave Renham. This was the third time I had looked at a specific course and distance and diving deeply into past statistics. I will again revisit this idea today, delving forensically into Musselburgh's 7 furlongs trip, focusing on handicap races only. And, as a ‘Brucie Bonus’, I will also look at the key stats in Windsor 1-mile handicaps. Two for the price of one!
I have noted before in the earlier articles that looking for patterns and pointers for races from a specific course and distance (C&D) is a type of trends-based approach. Using past race trends remains very popular – for example, for every race I bet on at the Cheltenham festival this year I first studied past race trends in an attempt to gain some extra insight into how the races may pan out this year.
For this article I have taken handicap data from 2017 to 2025. Profits are calculated to Betfair Starting Price (BSP) with returns adjusted for 2% commission. It should be noted that for all areas other than the draw and run style I have ignored 2yo handicaps. For the record there were only nine such 2yo races at Musselburgh.
Musselburgh 7f handicaps – an overview
Firstly, there have been on average 21 qualifying races a year over seven furlongs at Musselburgh (handicaps only), so a decent number. Just over 40% of the races were Class 6 races, the lowest tier, while around 65% were either Class 5 or 6. Let’s start the digging process.
Musselburgh 7f handicaps: Betting market
I am going to look at the betting market for our first main set of stats and specifically market rank. I have used the Betfair market for this:

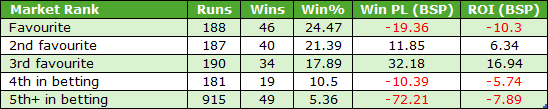
The value has been with those second and third in the market, while favourites have been over bet. There were no ridiculously priced winners over the past nine seasons with the highest two being 50.0 and 58.93. Horses priced BSP 60 or more were 0 from 94 with just four placing.
It is interesting when we analyse favourite performance in more detail as there has been a big difference when we split their record by Class of Race.
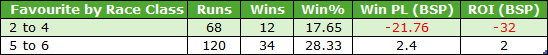
At the lower levels favourites have done OK. In better class races (4 and above) their record has been very poor indeed.
Musselburgh 7f handicaps: Sex of horse
Time to see whether the sex of the horse has made a difference. I have restricted races to mixed sex races (which was still a decent sample of 146 races), and below shows a comparison between the win and each way strike rates:
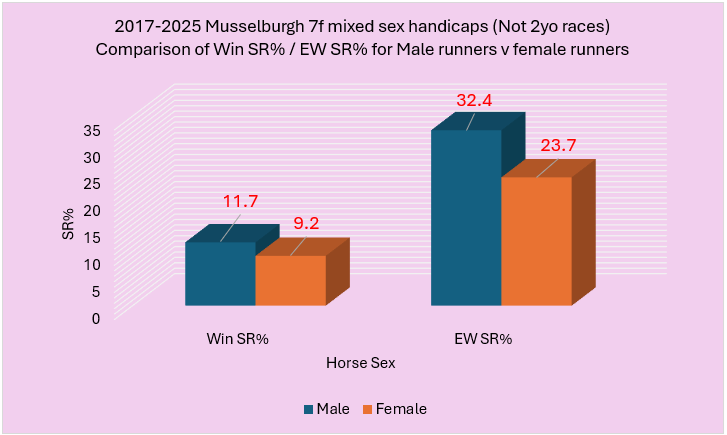
The blue bars show there has been a definite edge to male horses, and the full splits were thus:
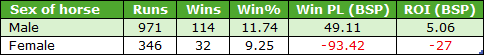
Males accounted for many more of the runners but made a blind profit to BSP. Of course, we need to double check these bottom lines have not been skewed by winners at huge prices, so here are the splits using a price cap of BSP 18.0 or less:
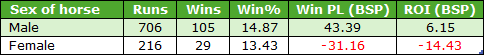
We still see a clear difference between the sexes in these Musselburgh contests with males doing best.
I have said many times before, especially when using BSP for profit and loss, it often makes sense to use a price cap to avoid skewed findings. Therefore, for the remainder of the article, bar the run style and draw stats, I will be using the BSP 18.0 price cap.
Musselburgh 7f handicaps: Age
I am going to split the age stats into two – firstly I will look at 3yo+ handicaps, after which I will look at 4yo+ handicaps. So, 3yo+ handicaps first. Roughly half of all the handicaps over this C&D were open to 3yos and older:
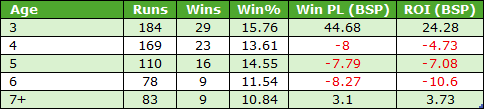
There was a strong overall performance by the youngest age group, 3yos. Not only did they make a profit to win bets, but they would have made a small profit on the Betfair Place market as well. The 7yo+ group had the lowest win rate, as we would probably expect, but nudged into profit. However, four of their nine winners were priced between BSP 13.0 and 15.0 which helps to explain that.
A look at the 4yo+ handicaps now and the age splits. There were 64 such contests across the period of study:
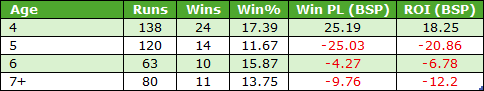
We see a similar pattern here with the youngest horses, in this case 4yos, having performed best, and comfortably so. These 4yos have offered good value and their A/E index (BSP) backs that up with an impressive figure of 1.20.
Musselburgh 7f handicaps: Course form
Previous course winners have scored 15.4% of the time (57 wins from 365) for a small loss of £2.46 (ROI -0.7%).
Horses that had never raced at Musselburgh before saw 69 of them win from 471 (SR 14.7%) for a profit of £39.47 (ROI +8.4%).
Horses that had raced at the track before but had failed to win won 47 of 347 (SR 13.5%) for a loss of £31.02 (ROI -8.9%).
Musselburgh 7f handicaps: LTO Course
I am going to look now at where horses that contested these Musselburgh 7f handicaps ran last time out. There are four LTO venues that have provided at least 75 runners priced 18.0 or less. These have been:
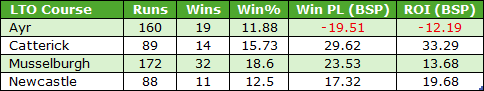
Positive returns emerged from three of the four. Clearly it was a positive to have run at Musselburgh last time, while Catterick, like Musselburgh a sharp track, also shows positive figures during the review period.
Musselburgh 7f handicaps: Recent runs
Next stop is to look at the horses’ best finishing position over the past three runs to see whether anything can be gleaned. The splits were:
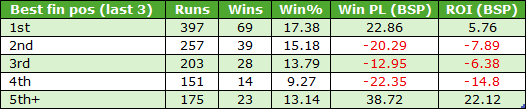
It was a positive for horses to have won at least once in their previous three starts, such runners making a small gain of close to 6p in the £. Likewise, ‘out of form’ horses, those whose best finishing position in the last three runs had been 5th at best, also proved profitable when priced BSP 18.0 or less. Indeed, returns increase to 30p in the £ if focusing solely on male runners.
Musselburgh 7f handicaps: Trainers
Trainer data is limited for most handlers in this context, but two names shone.
Richard Fahey had an 18.7% strike rate (14 wins from 75) for a profit of £12.32 (ROI +16.4%).
Grant Tuer enjoyed an even better record with 13 wins from 39 (SR 33.3%) for a very healthy profit of £39.60 (ROI +101.5%).
For the last two Musselburgh sections I will be ignoring the price cap and including all runners once more. This is because I am not focusing on profit/loss for the draw and run style analyses.
Musselburgh 7f handicaps: Draw
For a potential draw bias to exist we need bigger fields to analyse, so I have focused on races with at least eight runners. Let me share the raw data first, splitting the draw into the three sections I normally do – low third, middle third and high third, giving the win percentages for each third of the draw.
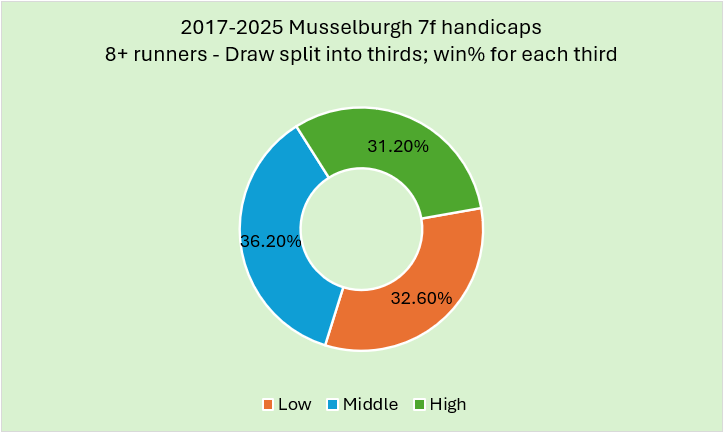
As we can see these stats suggest that there has been very little favour to any specific third. However, if we look at the PRBs (Percentage of Rivals Beaten) we see there may have been a small bias after all.
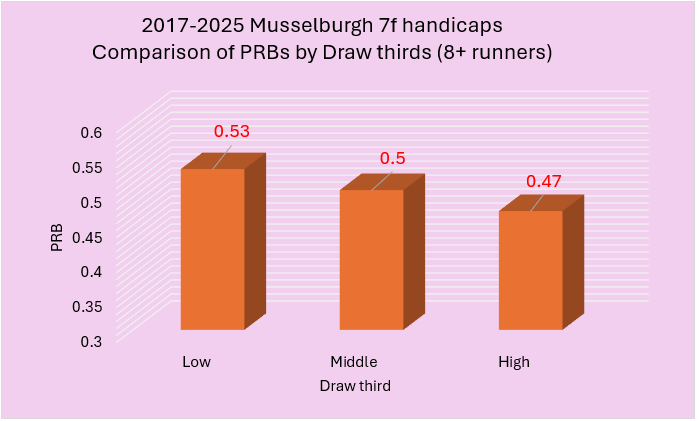
Low have had an edge over high (0.53 versus 0.47) and if we restrict races to good to firm or firmer, we see something quite interesting:
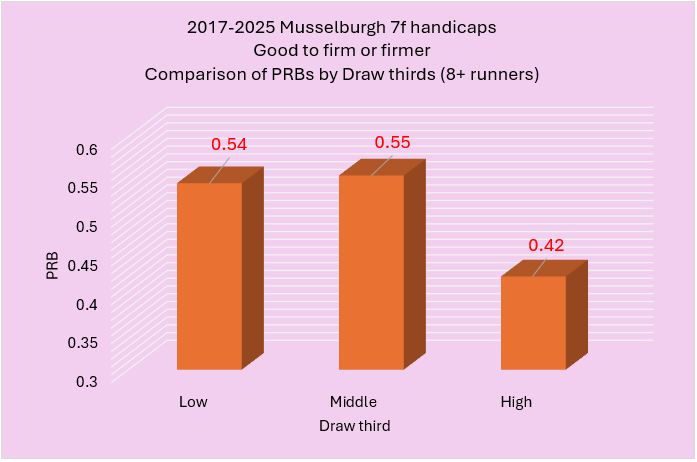
On firmer going the PRB numbers are indicating that high draws have been at a real disadvantage under such conditions. Indeed, high draws have managed to ‘win or place’ just 21% of the time on good to firm or firmer, well below the expected figure on a perfectly fair track of 33.3%.
On soft or heavy ground low draws have performed extremely well, winning 12 of the 20 races. This was quite a small sample but with a PRB of 0.56 I would expect low draws to continue to enjoy a decent edge when the ground comes up soft or heavy in future.
Musselburgh 7f handicaps: Run Style
Finally for this course and distance I will review the run style PRB splits.
As we can see there has been a significant edge to horses that led early, and the nearer the front they were in the first part of the race the better. Hold up horses performed poorly.
By using the Geegeez Pace Analyser we can see the remaining metrics in full:
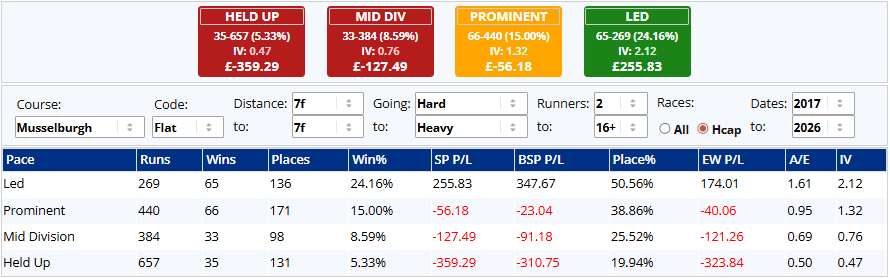
More evidence of the strength of the front running bias over this C&D. Oh, for a crystal ball that could predict the early leader!
**
It is now time to switch our attention to 1-mile handicaps at Windsor. Again, 2yo handicaps have been ignored except when looking at draw and run style.
Windsor 1m handicaps – an overview
There have been slightly more Windsor 1-mile handicaps compared to Musselburgh 7f ones with an average of 22 qualifying races a year. Before looking at the numbers in more detail let me share what Class of race we tend to get when racing this C&D. The graph below shows the splits:
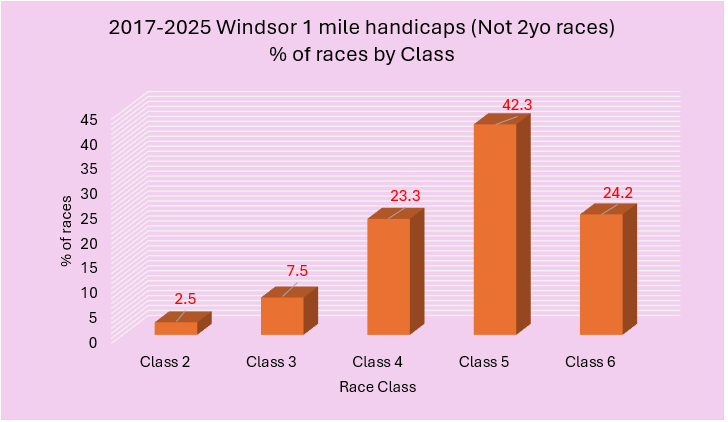
Roughly two thirds of all races have been class 5 or 6, with just 10% of races in either Class 2 or 3. Time for some digging.
Windsor 1m handicaps: Betting market
Let me take a look at the Betfair betting market and the performance of different ranked positions.
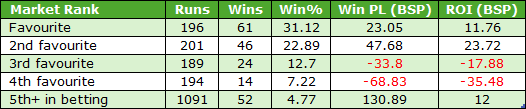
Here we see the front end of the betting market has dominated, with both favourites and second favourites making decent blind profits. The 5th+ group was also profitable but essentially this was down to two winners at big prices – BSP 107.08 and BSP 116.69. Removing those two outliers meant the remaining 1089 runners made a loss of 8 pence in the £.
Sticking with favourites and second favourites, if we combine them and look at the returns achieved in 3yo+ races, 3yo only races and 4yo+ races we see positive figures for all three:
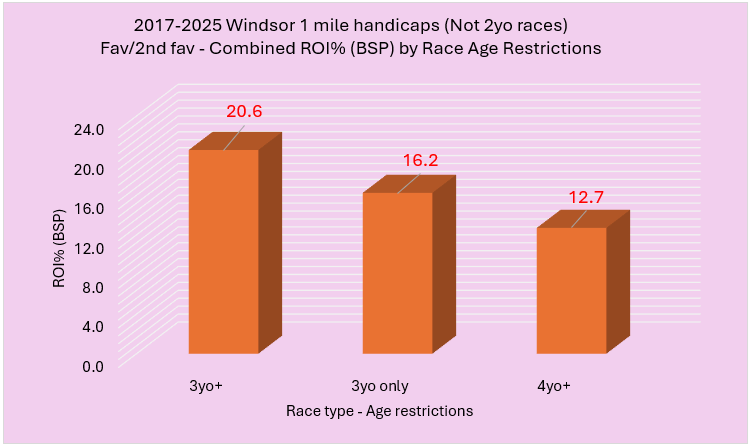
It seems that the top two in the betting have performed consistently well over the past few years.
Again, in the next few areas I will only include data regarding horses priced BSP 18.0 or less to avoid skewed bottom lines.
Windsor 1m handicaps: Sex of horse
The advantage males had over females in mixed sex races at Musselburgh over 7f has not been replicated here, but males still enjoyed a small edge. In terms of strike rate males won 15% compared to females on 12%, and they posted better returns, albeit only by around 3p in the £.
However, the value metric, the A/E (BSP) index, does indicate that males have been far better value with males on 1.05 and females on 0.87.
Windsor 1m handicaps: Age
I am going to look at the age splits in 3yo+ handicaps, as such races have occurred most often (86 races). The breakdown was thus:
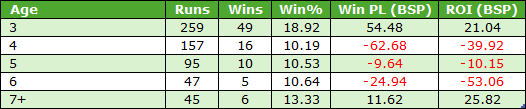
We see a similar and arguably stronger 3yo edge here to the one in the Musselburgh research. 3yos won far more often than all other age groups and produced a tidy profit. Horses aged 7 and older also made a profit but the sample size was small, and three of the six winners were priced BSP 12.00, 14.00 and 16.30 so I would not see this age group as a positive over this C&D.
The 4yo+ handicap data covered only 31 races so this has been too small a sample to drill down into and find anything meaningful.
Windsor 1m handicaps: Course form
Previous course winners have scored 18.3% of the time (30 wins from 164) for a profit of £13.97 (ROI +8.5%).
Horses that had never raced at Windsor before saw 86 of them win from 643 (SR 13.4%) for a significant loss of £90.12 (ROI -14%).

Horses that had raced at the track before but had failed to win, won 59 from 379 runners (SR 15.6%) for a profit of £18.54 (ROI +4.9%).
It does seem that past experience at the track has been useful regardless of whether a horse won there previously.
Windsor 1m handicaps: LTO Course
It is time to look at where the horses ran last time out. There are four LTO venues that have produced positive stats from at least 50 runners priced 18.0 or less. These have been:
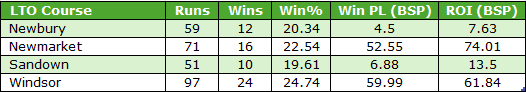
I mentioned in the course form section above that the stats were indicating that a previous run at Windsor had been a positive. We have now had an even stronger positive if they had raced at the track last time out. The figures for horses coming from Newmarket have also been exceptionally good.
Windsor 1m handicaps: Recent runs
I could not find any worthwhile patterns when analysing the last three runs, but in terms of LTO winners, they performed poorly losing £31.37 from 170 qualifiers showing negative returns of over 18p in the £.
It is also worth noting that last time out winners actually did very well when sent off as the favourite (a 36%-win percentage coupled with returns of 28p in the £), but if they did not start favourite their record was dreadful: just 11 wins from 120 runners (SR 9.2%) for a loss of £45.49 (ROI -37.9%).
Windsor 1m handicaps: Trainers
Trainer data is again very limited and only one trainer, Richard Hannon, saddled more than 30 qualifying runners in the review period. He ran 68 horses, of which 10 won (SR 14.7%), for a small loss of £1.85 (ROI -2.7%).
Clive Cox is worth a mention as he has had eight wins from just 25 runners (SR 32%). Profits were £24.94 (ROI +99.8%). For the record he saddled six different horses to win, so it was not a case of one or two horses skewing the stats.
Windsor 1m handicaps: Draw
As earlier I will be concentrating on races with at least eight runners when looking at the draw (2yo handicaps included). Here were the win percentage splits for the bottom, middle and highest thirds.
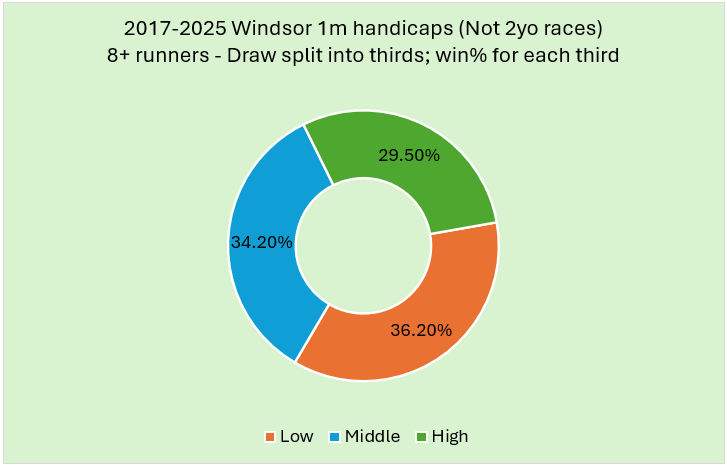
Once again, we have had a very level playing field. This has been backed up when looking at the PRBs:
![]()
Essentially, I think we can disregard the draw at this trip.
Windsor 1m handicaps: Run Style
Finally for this article I will be taking a look at the run style PRB splits over this C&D.
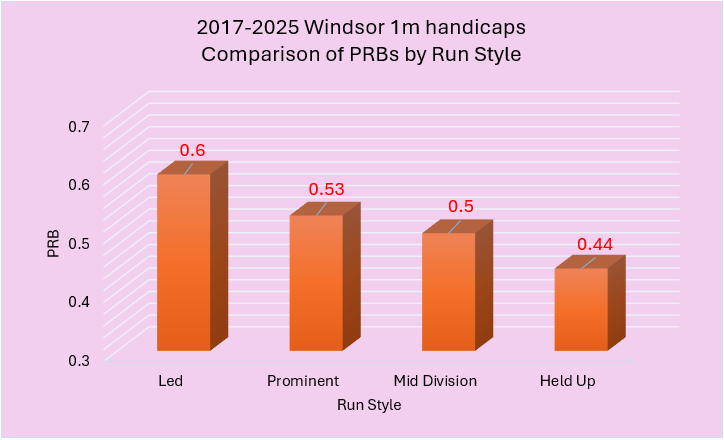
As with the Musselburgh findings we can see there has been an edge to horses that have led early, and the nearer the front a horse was early in the race, the better. The bias was not as significant here, but it was still strong. The Geegeez Pace Analyser below shares the other key metrics:
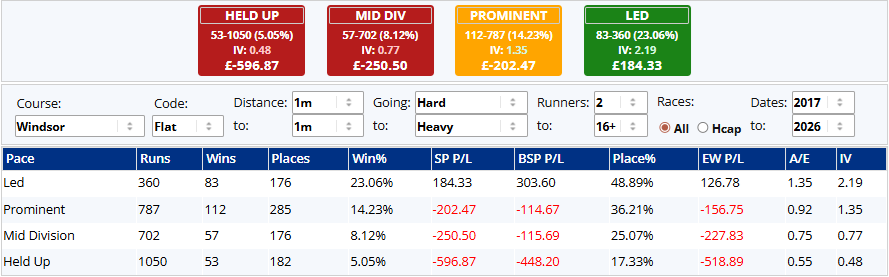
These stats correlate strongly with the PRB figures and confirm the front running bias.
**
That's it for this week – two for the price of one and it’s not even Christmas! I hope we will be able to exploit these findings across the 40 or so qualifying races we will have this season.
Good luck, and until next time...
- DR
Other Recent Posts by This Author:
- The Impact of Last Time Out Run Style
- Combining Pace and SR Ratings, Part 2
- More on Combining Pace and SR Ratings
- A Look at Summer All-Weather Racing
- 3yo+ First Time in a Handicap: An Analysis


Excellent as usual
Thank you Magic.
Leave a Reply
Want to join the discussion?Feel free to contribute!