
An investigation into the Geegeez Instant Expert, Part 2
This is the second of a two-parter in which I take a look at the Instant Expert feature in more detail, writes Dave Renham. Last week, I shared some initial findings connected with 575 British 5f handicap races run in 2024. It would make sense to read that piece first here, if you have already not done so. This week I continue my digging and. as I did last time, sharing my findings as I dig! So, at this juncture, I am unsure whether the findings this week will be as interesting or indeed as positive as that first half.
Recap
To recap quickly, the 5f handicaps I am looking at exclude 2yo handicaps (known as nurseries), but include all other age classifications. Any profit/loss quoted will be calculated to Betfair SP (BSP) less 2% commission on any winners.
As I mentioned last week, the Instant Expert tab can be found on the top of the Geegeez Racecards, between the Profiler and Pace tabs.
Instant Expert provides the Geegeez Gold community with some useful, and quickly digestible, horse information. It has a unique ability to summarise the form profile of every runner in the race into this single view. Instant Expert covers the form of each horse in terms of wins (or places), runs, and win (or place) percentage for each of five key areas namely going, class, course, distance, and field size. This can be seen in the screenshot below where I have clicked the tab for the 2.52 at Beverley run on the 23rd April of this year:
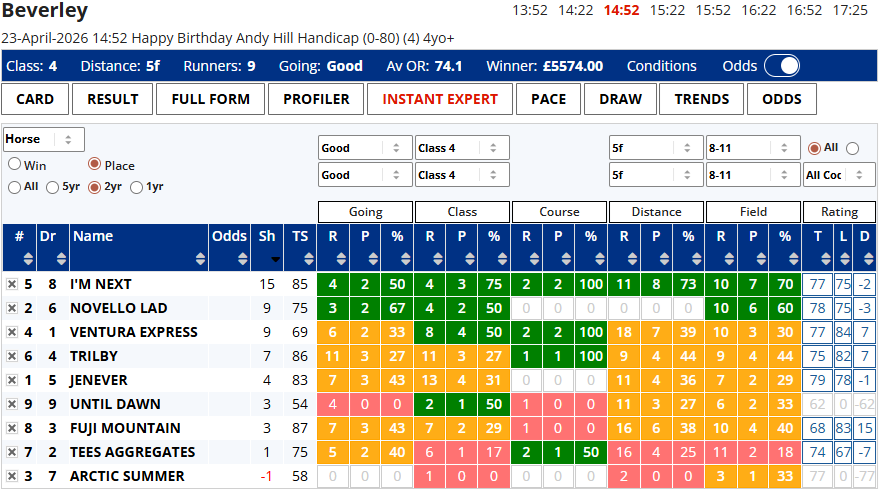

The parameters I am using in terms of generating the percentages for each horse in each category are:
2-year placed form (see top left above the grid), all races and all codes (see top right above the grid).
These parameters are the same as I used in last week’s article because clearly the data across both articles needs to be consistent. The display is colour coded to help us see things more clearly at a glance: green for a higher percentage rate, amber for a middling percentage, and red for a low percentage. Horses with no form under a certain condition have grey figures.
In the above example I have ranked the runners by their scores which are based on The Shortlist scoring system (The ‘Sh’ column). Green percentages score three points, amber percentages score one, grey percentages zero and red percentages minus one. Hence across the five areas a horse can obtain a top score 15 (five greens), whereas the lowest score would be -5 (five reds). Users may change the parameters and dropdowns so, for example, if you prefer to look at 5-year win only form just click the relevant circles. Once this is done, the Shortlist scores will change.
In the illustrated race above I’m Next had the maximum score of 15, while Novello Lad and Ventura Express were joint second on nine, with Trilby ranked fourth scoring seven points. For the record, the result of the race was as follows:
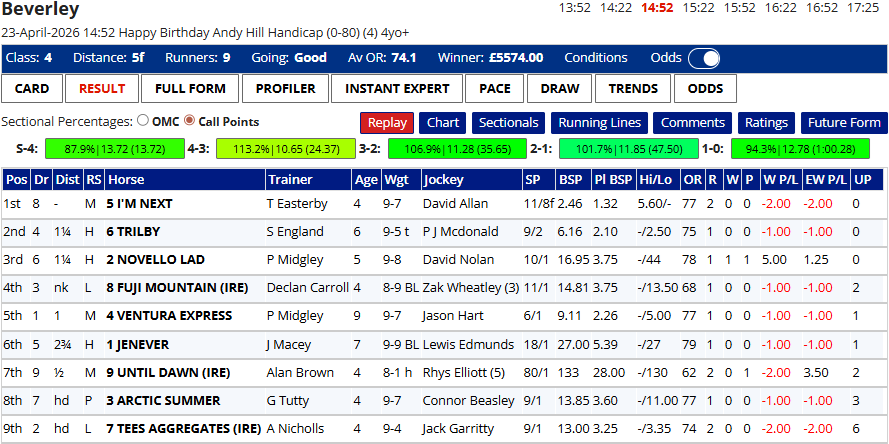
The top ranked horse I’m Next went onto win this race, priced at 11/8. Trilby, the fourth ranked runner, was second at 9/2 while one of the joint second ranked runners Novello Lad came third at 10/1. Based on what we found out last week in terms of the performance of the rankings, this type of result will occur much more than say three horses ranked near the bottom coming first, second and third.
A line on ranking methodology
Before getting into the meat and bones of this second piece, let me briefly discuss ranking or rating methods for a few lines. The key to a good set of ratings/rankings is not whether the top-rated/ranked runners make a long-term profit. Of course, that would be an added bonus but, essentially, to measure the effectiveness of a rating set we need to look at the win strike rate and the percentages of rivals beaten (PRBs).
The top-rated/ranked runner should have the highest win percentage, the second highest should win next most often, and so on, gradually reducing for the other runners. Ideally there would be a significant difference in strike rate between say the top-rated with the fourth rated, and likewise with the fourth rated and the tenth rated, and so on. This type of finding would ideally be mirrored in the PRB stats.
It was noted in my first article that the PRBs produced the perfect graph when assessing Instant Expert Shortlist score rankings with the PRBs decreasing from highest ranked to lowest. The win strike rates also showed the right type of pattern although the seventh and eight ranked were marginally out of kilter scoring maybe 1 to 1.5% higher than would be expected. Overall, the rankings had the right 'feel' based on all the stats I uncovered.
Instant Expert Rank #1 by Betfair Starting Price
Having set the scene, coupled with some key recaps, let me start to crunch the numbers once more. Last time, I looked into the combined performance of the top two ranked runners in terms of their Instant Expert (IE) Shortlist scores across different areas. To start with here, I want to focus solely on the top ranked runner starting with...
Instant Expert (IE) top ranked runner by Price
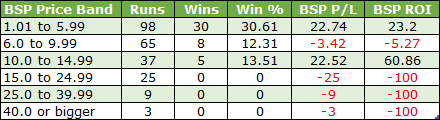
I want to see whether the BSP prices of the top ranked horses make any difference to returns. I have split qualifiers into different price band groupings and here are the splits:

We would expect higher win rates for shorter priced runners, but it is interesting that the performance of the bigger priced top ranked runners, those BSP 15.0 or bigger, has been very poor. Overall, these qualifiers have managed just three wins from 111 runs (SR 2.7%) for a loss of £57.07 (ROI -51.4%). From this sample, it is clear that top ranked runners based on their Instant Expert Shortlist scores give the best value if priced under BSP 15.0.
Instant Expert (IE) top ranked runner by Price (4yo+ hcaps only)
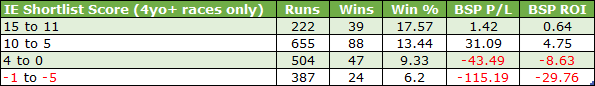
Last week it was noted that the top two ranked runners combined performed far better when contesting 4yo+ handicaps compared with other race classifications. Therefore, I want to look at the top-ranked runners in 4yo+ handicaps using the same price band analysis. Here are the splits:
There were no wins at all for those priced BSP 15.0 or bigger – 0 from 37 to be precise. The well fancied runners, those under BSP 6.0, produced very solid looking results albeit from a modest sample size of 98 qualifiers. The overall results for horses priced under BSP 15.0 are 43 wins from 200 runs (SR 21.5%) for a profit of £41.83 (ROI +20.9%).
Instant Expert top ranked runner by Age (4yo+ hcaps only)
Sticking with 4yo+ handicaps for a minute, I want to see if the age of the horse has made any difference when it comes to the top ranked runner.

Based on these findings it does seem that once we get to horses aged seven or older, performance of the top ranked runner tails off notably. This older age group produced just two wins from 41 starts with losses of close to 81p in the £. Yes, it is small sample but comparing the PRBs, five- and six-yrear-olds combined had a PRB of 0.64, while those aged seven and up were significantly lower on 0.54.
Of course, finding value selections is the key to successful betting and looking for positive angles helps us in this regard. However, it is also important to try and find negative angles in order that we can discard (or at least downgrade) certain runners from our shortlisting process. If we can narrow down the field it will implicitly improve our chances of finding value selections. It needs to be said that we can never be 100% confident that discarded selections won’t win, because a handful always will; but if these runners represent very poor value, then in general they are worth discarding. We know we can't back every winner!
In the first article we saw that those ranked ninth and tenth produced significant losses of nearly 46p and 30p in the £ respectively. Combining their two records they delivered just 33 wins from 754 runners (SR 4.4%) for losses of £272.75 (ROI -36.2%).
Instant Expert rank of 9 or lower by Class
Now I appreciate that these runners ranked ninth or lower will only be relevant in races of at least nine runners, but I still want to share a few stats I have found for this group.
A look at these lower ranked runners by Class of Race. Here are the splits:
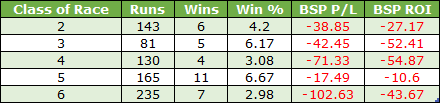
As expected, we see losses across the board. However, there is no clear pattern in terms of whether lower ranked runners have struggled more in higher or lower classes. The Class 5 returns are somewhat out of kilter, but a BSP 50.0 winner is responsible for making the ROI% lower than perhaps what it should be. What the stats from different classes do tell us is that these runners struggle when racing in all class levels.
IE rank of 9 or lower by Race Classification
I am now going to split the races by 3yo only, 3yo+ and 4yo+ races to see what effect this has had on these lower ranked horses:
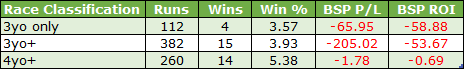
We see a lower strike rate in both the 3yo only and the 3yo+ group. These two also endured substantial losses to BSP. The 4yo+ group produced the best strike rate and almost broke even. However, all is not what it seems, as two of the 4yo+ winners were priced at BSP 50.0. Taking those two out and losses for the remaining 258 qualifiers would have been substantial, equating to around 38 pence in the £.
Digging a bit deeper, here are the numbers when we restrict all nine and lower ranked runners to those that were priced under BSP 15.0.
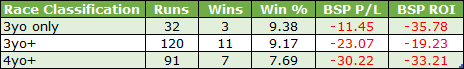
So even as we move towards the more fancied end of the betting market losses remained steep, although the 3yo only data set is small.
One final stat I wish to share before moving on is the performance of these lower ranked runners (9+) when aged three. If we look at all 3yo qualifiers that had a BSP of 10.0 or bigger, just one of these runners won from 192 qualifiers. Losses were £166.50 (ROI -86.7%).
Individual Instant Expert Shortlist scores by PRB
Having looked at a plethora of Instant Expert Shortlist ranking stats across both articles, let's now consider the performance of individual scores. As noted earlier, these scores range from the highest, 15, to the lowest, -5. I am going to examine PRBs first and, in order for them to fit within the graph, I have combined next door positions. Hence the highest two possible scores have been combined (15 and 13), followed by the next two (12 and 11), all the way down to the two lowest scores of -4 and -5. Remember, it's not possible to achieve a Shortlist score of 14.
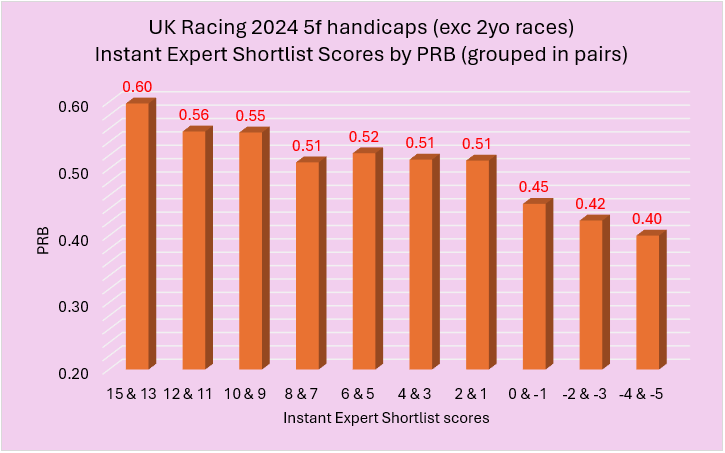
We see a very similar graph to the one I published in the first article which I referenced earlier – the one that examined the PRBs for different ranked runners. The higher ranked runners had higher PRBs, and we see the same pattern here. The very lowest scores have commensurately low PRBs so, on this evidence at least, horses with a score of minus two or less can generally be safely ignored. Even those scoring 0 or -1 have a note of caution about them with a PRB of just 0.45. For the record, the top score of 15 produced the highest PRB, at 0.62, with a score 13 achieving a PRB of 0.58, while 11 and 12 both scored 0.56, and 9 and 10 both hit 0.55: that's very pleasing linearity indeed.
Instant Expert individual scores
Let me now share the strike rates, profit/loss, and ROI percentages for each individual Instant Expert (IE) Shortlist Score.

Some of the sample sizes are relatively small such as for the scores of 10 or 12, which is one of three reasons why we cannot necessarily be seduced by bottom lines for these individual scores. The second reason is that some individual scores will have been skewed somewhat by a big priced winner or two. One such example is a BSP 80.0 winner for the -5 group. If we weed that winner out and examine the other 237 runners which scored -5, the ROI% drops to -35% and correlating far better with all the other horses whose Shortlist score was a negative value. The third reason is that a score of 1 or 2, or indeed even smaller, could actually be the highest Shortlist score in the race. One such example of this can be found from a Yarmouth race in July 2024 which is shown below:
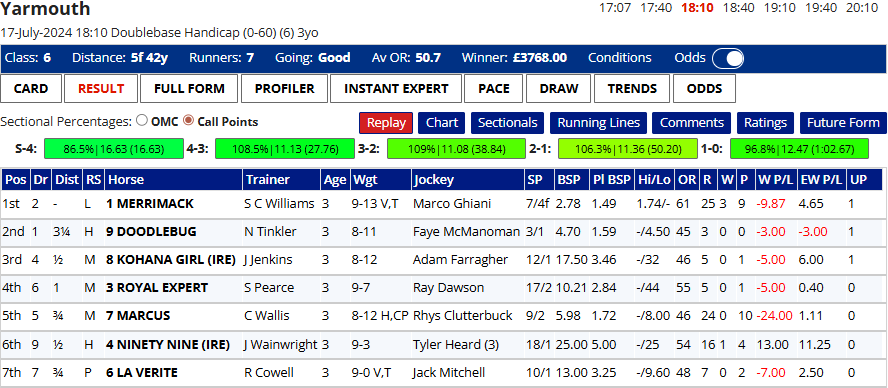

Merrimack was top ranked with a Shortlist score of just 2. For the record, he went on to win the race.
When looking at the strike rates for individual Shortlist scores there was not perfect correlation in terms of the strike rates always dropping as the scores decreased. However, when looking more generally the right strike rate pattern emerged and this can be seen to best effect when we group the highest IE scores together (11, 12, 13 and 15) and compare them to the lowest (-1, -2, -3, -4, -5).

Grouping like this does help to create more robust sample sizes and also smooths the data. This is further evidence of the potential effectiveness of Instant Expert, although I appreciate I have only looked at 575 UK handicap races, all run over 5f and from a single year, 2024. However, for this sample the correlation between ranking results and individual scores is primarily positive and makes me more hopeful that other result sets will produce similar results.
Instant Expert individual scores (4yo+ hcaps only)
It makes sense next to look at the 4yo+ handicap only data as these races to date have shown the most positive findings. Due to modest sample sizes, I have grouped the individual Instant Expert (IE) Shortlist scores into bands:
More positive correlation with both win rates and returns. This is replicated once more when we compare the PRBs:
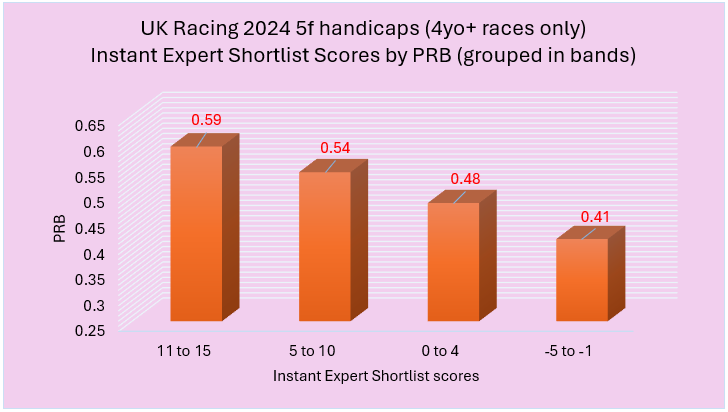
For the record, horses scoring between 11 and 15 in 3yo only and 3yo+ handicaps had a lower PRB of 0.56. As with my first Instant Expert research offering, it seems 4yo+ handicaps see the Instant Expert at its most effective, when there is generally more data available from which to populate the scores and colour codings that the view thrives on.
**
Summary
In this article horses with negative IE Shortlist scores have performed very poorly across the board and are horses I believe we should be ignoring nine times out of ten. This type of performance is similar to what we noted with horses ranked ninth or lower in the first article. The same pattern is occurring – the higher ranked runners have totally outperformed lower ranked runners; higher individual Shortlist scores have outperformed lower scores.
Clearly, these two articles have only scratched the surface as far as the Geegeez Instant Expert is concerned. However, the early findings have shown that this tool has real potential to help pinpoint runners which should offer good value and others which likely represent poor value. Making money over the longer term when betting is about finding value. If we can do this regularly enough, we will come out in front. And, crucially, using tools like Instant Expert means we'll have fun in the process!
The Instant Expert tab is something I always look at when analysing races for potential betting opportunities and, I hope via these two articles, I have converted more Gold members to do likewise.
Until next time...
- DR
Other Recent Posts by This Author:
- Combining Pace and SR Ratings, Part 2
- More on Combining Pace and SR Ratings
- A Look at Summer All-Weather Racing
- 3yo+ First Time in a Handicap: An Analysis
- Royal Ascot 2026: Must Know Betting Angles


hi will instant expert numbers and rankings be on the Query tool anytime soon ? thanks Phil
There’s no plan to add them, Phil, mainly because they would change depending on the settings used; and we can’t include every combination of time frame, win/placed, all races/handicaps, all races, specific race code.
Matt
An interesting part two Dave. There’s definitely merit in them. The 4yr old Handicaps certainly seem the pick of the data you were working with and like you say that’s doubtless because of the extra data available for the scores so I wouldn’t be at all surprised if that’s the case at other distances as well.
Interesting stuff Dave and very well presented (as ever). It’s obvious you’ve been burning a lot of midnight oil on these IE articles!
The key takeaway for me was the steady strike rate and better betting returns of horses scoring 1 to 7 in the IE shortlist scores. It makes sense as these will be the less obvious types who might have the odd negative against them but can clearly still succeed in 5f handicaps.
All the best,
Russ
This is a great piece of analysis. What I like best is the simplicity. I was told by Nick the creator of By2or.co.uk to always put a number on it and in 2yo maiden racing it works for me but to be able to apply the same logic to 4yo+ handicaps is just great.
I have been using it in conjunction with the pace maps for 3yo and 4yo+ races up to a mile since you published the first article and notwithstanding the small sample it is looking promising.
Yes often simple is best. Goes back to the pros and cons of racing systems. Generally those with fewer variables work best.
Thanks for the positive comment btw!
Dave
Can the IE figures be further broken down please to understand in different disciplines distance, class, going etc which is the most important.
Matt is working on getting a bigger dataset for me to look at. Once I get it I’ll start digging and feedback. Not sure of the timeframe as it is not a case of just clicking a button and dumping data into a database. Watch this space!
Good afternoon,
I always appreciate these analytical articles but to my mind there is a flaw in the basic data which is to assign a similar weight in the total Instant Expert score to the Field score.
I am far from an expert but does any body else agree that the field size has as much influence on a horse`s chance of success as its` performance over the Distance, the Course and on the Going and in the Class. I don`t and in practice almost ignore the Field rating referring more to the first 3 I mention and then the Class. I tend to deal with the influence of the field size by reference to Draw and Pace which is difficult/impossible to assign a score to.
GRUNDY. that is exactly what I was getting at. I always take a lot of notice of IE but different aspects for different type of races. i also use horse stats for established handicappers and trainer stats only for unproven horses.
You raise an interesting point. It is something that would require a lot of digging but what I would say is there have been plenty of examples of horses that prefer small fields and conversely horses that prefer bigger fields. Take sprinter Caspian Prince who had a long career starting in France in December 2011, moving to the UK in December 2013 and retiring in 2021. He had an excellent record in big fields. In races of 16+ runners he won 7 and was placed a further 6 times from 25 runs. Hence his win % was 28% and win & placed 52% in these big field races. In reality the average chance in these races of winning is just under 6% and win/placing 21%.
Essentially my article was an introduction into Instant Expert – I think the findings show that even using equal weightings for a group of variables they have been fairly good indicators of performance thus far.
The question of weighting is really tricky. If you put a number on them keeping it simple is definitely the best way.
For my two year old method I attribute a maximum of 1.5 each for Trainer and Sire and 1.25 for the jockey, ie max score 4.25
The trainer or sire can be 0, .5, 1, 1.5, the jockey 0, .75 or 1.25. All based on 2yo only strike rates.
It is a blunt tool but extraordinarily effective and quite often matches the market, after that it is down to paddock judging.
When at the track paddock judging a 2yo field I give them my estimated OR based around 75 for the best looker. This takes time to develop and very often there are none that deserve a 75. This is purely a visual check.
Leave a Reply
Want to join the discussion?Feel free to contribute!