
An Analysis of the Racing Post Ratings in UK Turf flat racing
An excellent addition to the Query Tool back in December 2025 was the ability to query Racing Post Ratings (RPR), writes Dave Renham. Hence, I, along with other Geegeez Gold members, can now delve into past stats for this long-established rating method.
In this article I plan to dig into RPRs to try and unearth some positive or negative angles that hopefully we can employ successfully this year and into the future. It is not for me discuss the pros and cons of how the RPR figure we see in the racecard is calculated. Ultimately, this is a formula or method that the Racing Post have been using for many years, so we need to assume they are happy with their product.
Introduction
My focus for this piece is UK turf flat racing and I will be analysing the RPR figures for this specific race code. The time frame studied runs from the start of 2020 through to the end of 2025, six full turf seasons. All profit/loss figures have been calculated to BSP less 2% commission.
In the past I have had conversations with respected racing analysts who have compiled ratings, be they speed or ability ratings, and, for them, to judge the effectiveness of their ratings the win strike rate is very important. The top-rated runner should have the highest win percentage, gradually reducing for the other ranking positions.
Obviously, it is hoped the top-rated runner is going to be the best performer in terms of returns as well; however, it is important to point out that regardless of how good a set of ratings is, speed or form-based, we cannot expect the top-rated runner to secure a blind profit over thousands of races.

Overall Performance by RPR Ranking
Let’s start with looking at the win percentages (strike rates) for different rated runners. This covers all races on the turf over the period of study. The horizontal axis is labelled from 1 which stands for the top-rated runner, 2 the second rated and so on:
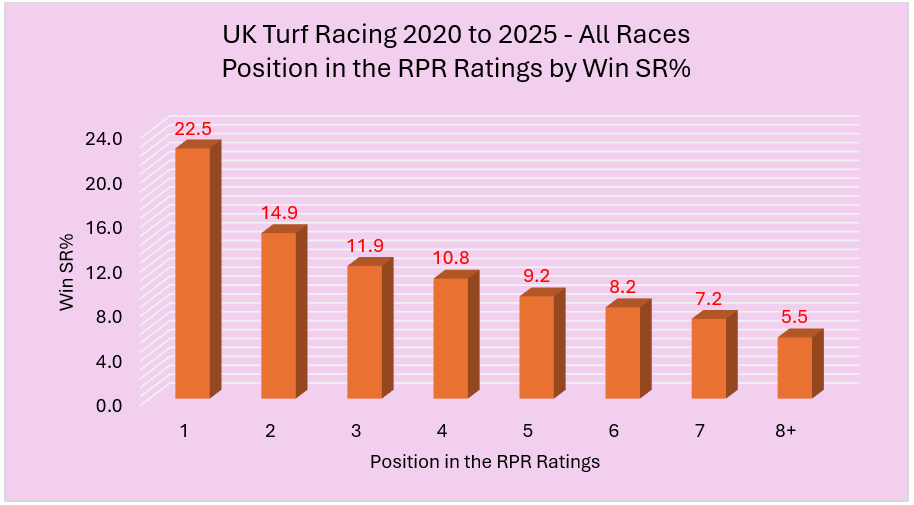
The strike rate for top-rated runners has been better than one win in every five races which is excellent for any set of ratings. More importantly perhaps, the win percentages have correlated positively with the rated positions producing the sliding scale I was talking about earlier. It is interesting, though, to see quite a big gap between the top two rated.
If we look at the Each Way (win & placed) strike rates, we have seen a similar pattern:
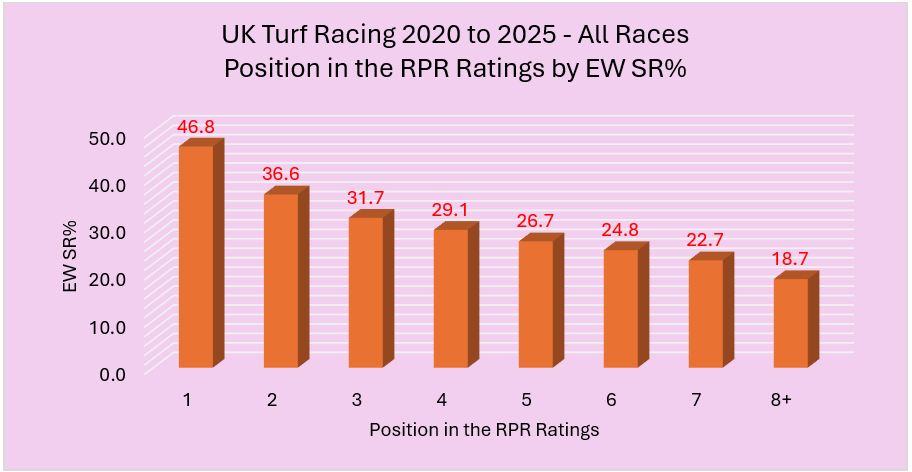
The top-rated runner has the highest percentage once more, and the sliding scale is replicated showing positive correlation with the win only figures.
Finally, in terms of the individual rating positions, let me share the Percentage of Rivals Beaten (PRB) figures. Being able to share these is down to another of the recent Geegeez additions of having PRB figures available in the Query Tool Results Summary. The splits were as follows:
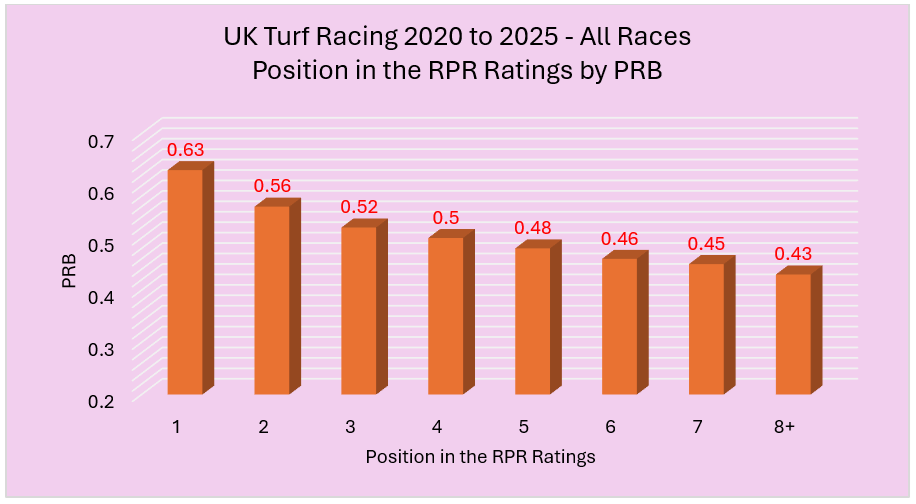
The same type of graph has appeared a third time. Therefore, the RPR ratings have conformed well to the pattern we would expect for a good set of ratings.
RPR Top Rated
Overview
From here, it made sense to me to focus on the RPR top-rated horses to see if there were any positive or indeed negative angles. Hence let me look at the record of every single RPR top-rated runner since 2020:
![]()
Despite the excellent strike rate, losses have been steeper than perhaps might have been expected. As a general rule I am guessing these runners have been notably overbet. It is now time to dig a bit deeper.
RPR top-rated runners - Yearly strike rates
Let me start the digging process by comparing the yearly figures.
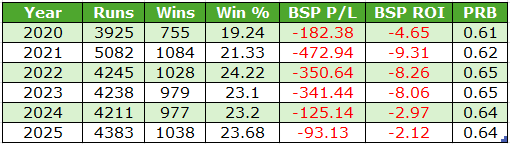
All years have shown a loss for the top-rated runner although the last two years have been the best, or least worst, in terms of returns.
RPR top-rated runners – Record by Month
A look now to see whether the time of year has made any difference to the returns. The graph below shows the splits:
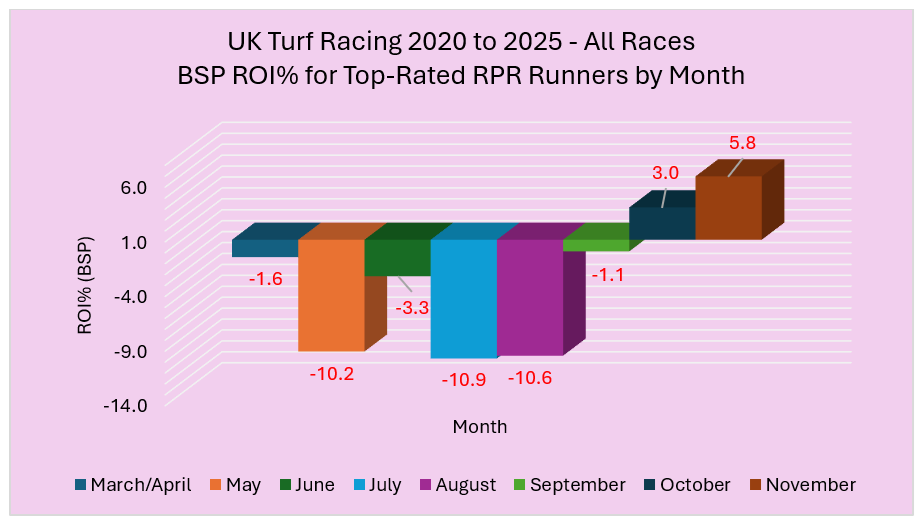
Based on these data, the top-rated runners have performed far better in the Autumn than at any other time of the year. In the height of summer (July & August) top-rated RPR runners produced quite poor returns. I wonder if this has been a case of the top-rated runners being overbet even more than normal?
RPR top-rated runners - Market Rank
I would now like to share the performance of the top-rated runners in terms of market position / rank. The splits over the period of study were as follows:
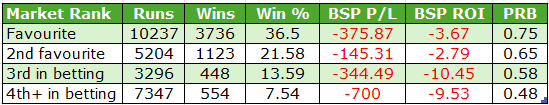
Overall, the RPR top-rated runners would have lost us far less money when most closely aligned with market sentiment, specifically when starting either favourite or second favourite.
RPR top-rated runners - Handicaps versus non-handicaps
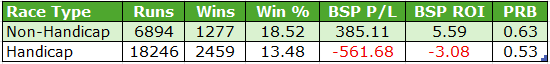
The table below illustrates the difference between handicaps and non-handicaps in terms of RPR top-rated horses.
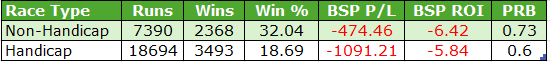
As we should expected, top-rated non-handicap runners had the better win rate; but returns for each were very similar with an ROI difference between the two of just 0.58%.
RPR top-rated runners - Age of horse
Onto the age breakdown now.
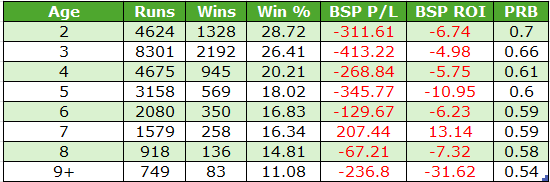
There is a strong correlation between relative youth and win strike rate: younger top-rated RPR runners won a lot more than older ones. This is also true if we look at handicaps and non-handicaps separately.
One interesting age stat is for top-rated RPR 3yo runners in non-handicaps. They have had 902 winners from 2406 runners (SR 37.5%) for a very small loss of £22.04 (ROI -0.9%). This is the strongest cohort in terms of top-rated runners to date.
At the other end of the spectrum, older horses, those nine or above, have struggled in all races and they look best avoided.
RPR top-rated runners - Run style
Finally for top-rated runners I want to share performance by run style – possibly my favourite area of research. Firstly, a look at the win strike rates (within their specific run style groups):
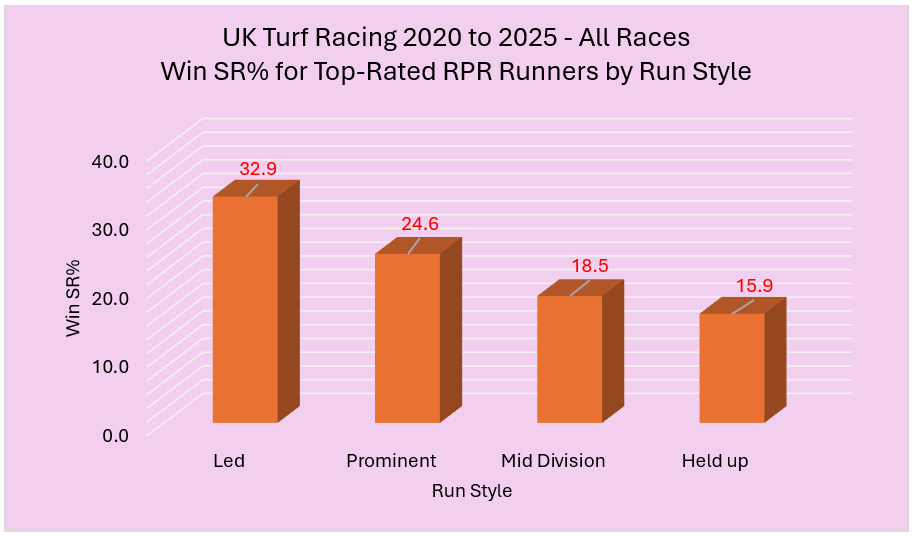
We see an extremely familiar pattern when it comes to run style stats where early leaders/front runners have comfortably attained the best win percentage within their group while hold up horses endured the lowest.
Of course, we do not know pre-race what the run style of each horse will be and hence any profit/loss data shared is essentially hypothetical. However, I always like to show the splits to help emphasise the run style bias:
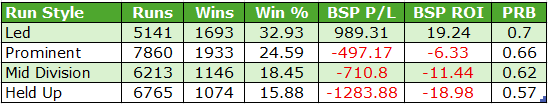
Essentially, if the RPR top-rated runner leads early then we have a huge value selection.
2nd Top Rated RPR
Overall, the performance of the top-rated RPR runner has been a little disappointing and, as I alluded to earlier, my feeling is that they have tended to be overbet. However, if the top-rated runner performance has been modest, horses second in the RPR Ratings have performed much better in terms of returns. Here are their overall figures:
![]()
Losses to £1 level stakes at BSP very close to break even over the period of study.
Let me drill deeper into the second rated runner to see whether we can find a positive angle or two.
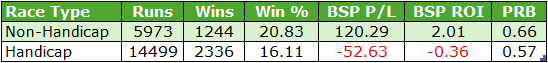
RPR 2nd rated runners - Handicaps versus non-handicaps
I want to start with handicaps versus ‘nons’ as we immediately ‘hit’ our first positive.

Horses second in the ratings have made a steady profit in non-handicaps which is impressive considering this is every single qualifier. All of this profit came from younger horses, those aged two to four. This cohort hit a win rate of 19% thanks to 1186 wins from 6253 producing a profit of £438.40 (ROI +7%).
RPR 2nd rated runners – Horses with an ISP of 12/1 or less
As we know, some bottom lines can be skewed by big priced winners, so I narrowed down the group to those that had an Industry SP of 12/1 or less. Again, I have split handicaps and non-handicaps:
Handicap runners made a very small loss, while non-handicap runners within this price bracket enjoyed returns of 2p in the £.
Let me now share three further positive angles I found for those second top in the RPR Ratings. I am going to keep the price restriction of 12/1 or shorter in place for all three:
- Second rated runners ridden by a claiming jockey produced 558 wins from 3420 (SR 16.3%) for a profit of £137.24 (ROI +4%).
- Fillies and mares when second in the ratings secured a strike rate of 18.2% (1145 wins from 6289) for a profit of £227.50 (ROI +3.6%).
- Sticking with mares, those aged five or six and second in the ratings enjoyed a great record, with 170 wins from 874 runners (SR 19.5%) for a decent profit of £233.71 (ROI +26.7%). It should be noted that five- and six-year-old mares would also have secured a small profit if focusing on horses priced over 12/1.
RPR 2nd rated runners – Run Style
Finally, let me share the run style figures for those second in the RPR Ratings. To allow the best comparison against the top-rated RPR stats shared earlier these results will cover all races and all prices:
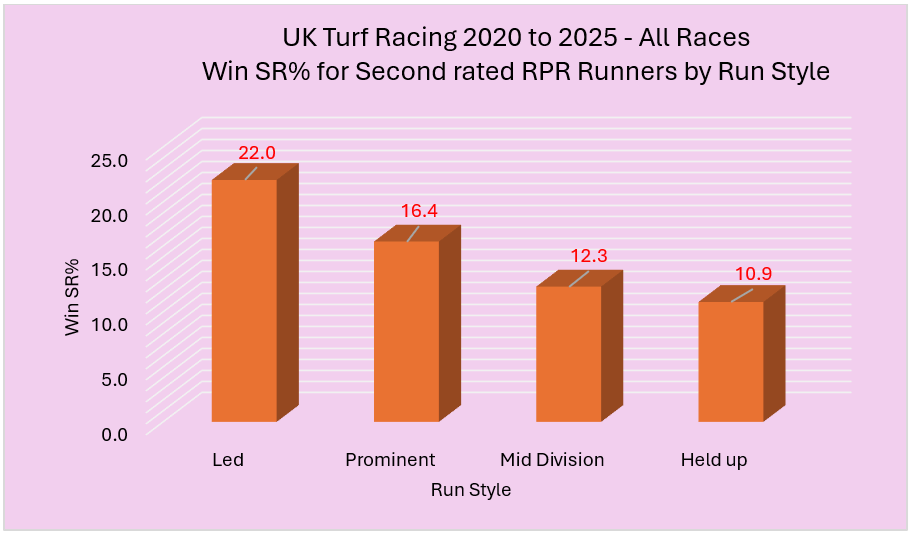
We'd expect lower strike rates for each group compared with the top-rated stats, but what about returns?
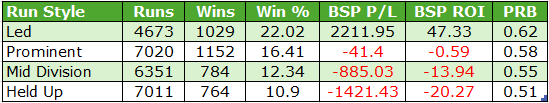
The front running (led) stats have been off the chart in terms of potential returns. In contrast, the losses for mid div and held up runners were quite significant.
*
The Racing Post Ratings have been around since the late eighties when they were known as ‘Postmark’ and are long established. Based on the recent evidence shared in this piece, the better value has been with those runners rated second in the ratings. I think that top-rated runners have been consistently overbet, thus making the second rated runners better value generally speaking.
I have yet to dig into the performance of the Racing Post Ratings in terms of either All Weather or National Hunt codes; so it will be interesting to see what I find. That research will be done some time in the Autumn with hopefully enlightening articles to follow.
Until next time...
- DR
Other Recent Posts by This Author:
- Course Topography: Uphill Finishes
- The Impact of Last Time Out Run Style
- Combining Pace and SR Ratings, Part 2
- More on Combining Pace and SR Ratings
- A Look at Summer All-Weather Racing


The RPR’s form the core part of my methodology. There is other criteria I demand about potential selections of course, but over the 2025/26 NH season, when concentrating solely on top rated horses on RPR’s, I hit 32% winners for an ROI of 20%. I achieved this by specialising on the business end of the market (2-1 to 5-1) in field sizes of 12 or less (10 or less in handicaps) and using Instant Expert to eliminate unproven horses. After that it was just a question of whether I was confident the horse could run to its rating – the most important bit!
I must admit the statistics regarding front runners top rated on RPR’s did prick my ears as they’re not that difficult to find using the Geegeez pace ratings in the way that I do. I’m more of a Jumps man but after reading that I’m tempted to get involved more on the level!
My latest research has shown combing RPR and TS for the speedy distances and RPR with distance % in instant expert for the stamina distances (across both flat and jumps) has been very profitable for the festivals across the year (still more research needed to confirm accuracy)
Hi Dave – excellent as per usual.
Are these the adjusted RPR’s that you’re using?
Dave
Your joy in finding new mathematical answers to the imponderables our sport provides is infectious. Brilliant and Thanks. Great work. Simon S
great
Thank you once again for a superb article Dave.
With regard to the non handicaps, there would obviously be a plethora of Maiden/Novice races. It would be interesting to compare those against the Group/Listed, and Classified ones.
Great article as ever! One follow-up piece might be to look at the horses rated below to see if there’s an “horses rated within x pounds” angle? My methodology includes checking how close my selection is to the top rated. If the margin seems manageable it gets picked whatever the price. Combined with current from/last time out, I find it’s the closest predictor of finishing positions that I’ve yet to see
Thanks as always Dave, very interesting.. Could this info be used successfully for ‘In-Race’ betting, where you could assess the top rated horse’s start before laying on it with some relative confidence?
Leave a Reply
Want to join the discussion?Feel free to contribute!