Pace Wins The Race: 5f All Weather Handicaps
We still have several weeks of the all-weather season left so I have decided to look to see how strong the pace bias is on the sand, writes Dave Renham. I have not previously looked in detail at all weather pace bias in my Geegeez articles so now seemed as good a time as any.
Just in case you have not read my previous articles on pace I will briefly summarise a few things. Firstly when I discuss pace my main focus is the initial pace in a race and specifically the position horses take up early on. Most of you will be aware that on geegeez.co.uk racecards there is a pace section, and the stats in this article are based on the site’s pace data.
This info is split into four groups - Led, Prominent, Mid Division and Held Up, and after each race all the horses are assigned points in regards to which position they took up early in the race. Leaders get 4, prominent runners 3, horses that ran midfield 2, and those held up score 1. Just over 96% of all UK and Irish runs since 2009 have been scored, the other 4% unable to rated from the comment. For clarity, at the time of writing, 1,169,760 of 1,218,499 comments have been scored.
In previous articles, I have highlighted certain distances / race types that generally favour front runners both on the flat and over the jumps. My first five articles looked at 5f handicaps where pace bias is arguably at its strongest, but I did not look in detail at any course data for the six UK all weather tracks – my main focus was turf handicaps. Hence, a touch belatedly perhaps, it is time to address that now!
The first set of data I wish to share with you is the overall pace stats for 5f all weather handicaps with 6 or more runners (the data for this article has been taken from the last 5 complete years, 2014 to 2018):
| Pace comment | Wins | Runners | SR% | IV |
| Led (4) | 254 | 1137 | 22.3 | 2.04 |
| Prominent (3) | 360 | 2874 | 12.5 | 1.15 |
| Mid Division (2) | 67 | 1026 | 6.5 | 0.62 |
| Held Up (1) | 183 | 2735 | 6.7 | 0.61 |
These figures clearly illustrate the advantage to horses which have led, or disputed the lead, in 5f all-weather handicaps. In fact, the Impact Values - a measure of how much more likely than normal something is to happen, 1 being 'normal' - suggest that 5f handicap pace bias is slightly stronger on the all weather than it is on the turf.
The main data cover all handicaps with six or more runners; I have next looked at splitting these data into groups – 6 to 8 runners; 9 – 10 runners; 11 or more runners. Here are my findings:
6 to 8 runners
| Pace comment | Wins | Runners | SR% | IV |
| Led (4) | 119 | 459 | 25.9 | 1.86 |
| Prominent (3) | 138 | 956 | 14.4 | 1.04 |
| Mid Division (2) | 22 | 249 | 8.8 | 0.64 |
| Held Up (1) | 65 | 757 | 8.6 | 0.62 |
9 to 10 runners
| Pace comment | Wins | Runners | SR% | IV |
| Led (4) | 85 | 446 | 19.1 | 1.81 |
| Prominent (3) | 146 | 1083 | 13.5 | 1.28 |
| Mid Division (2) | 30 | 435 | 6.9 | 0.66 |
| Held Up (1) | 68 | 1125 | 6.0 | 0.57 |
11 or more runners
| Pace comment | Wins | Runners | SR% | IV |
| Led (4) | 50 | 232 | 21.6 | 2.60 |
| Prominent (3) | 76 | 835 | 9.1 | 1.10 |
| Mid Division (2) | 15 | 342 | 4.4 | 0.53 |
| Held Up (1) | 50 | 853 | 5.9 | 0.71 |
It seems therefore the front running bias is as its strongest when there are more runners. An IV of 2.6 for front runners is extremely high for races of 11 or more runners.
Of course, each all weather course has its own unique confirmation and, consequently, its own set of stats. Here is a view on the courses individually, presented in alphabetical order:
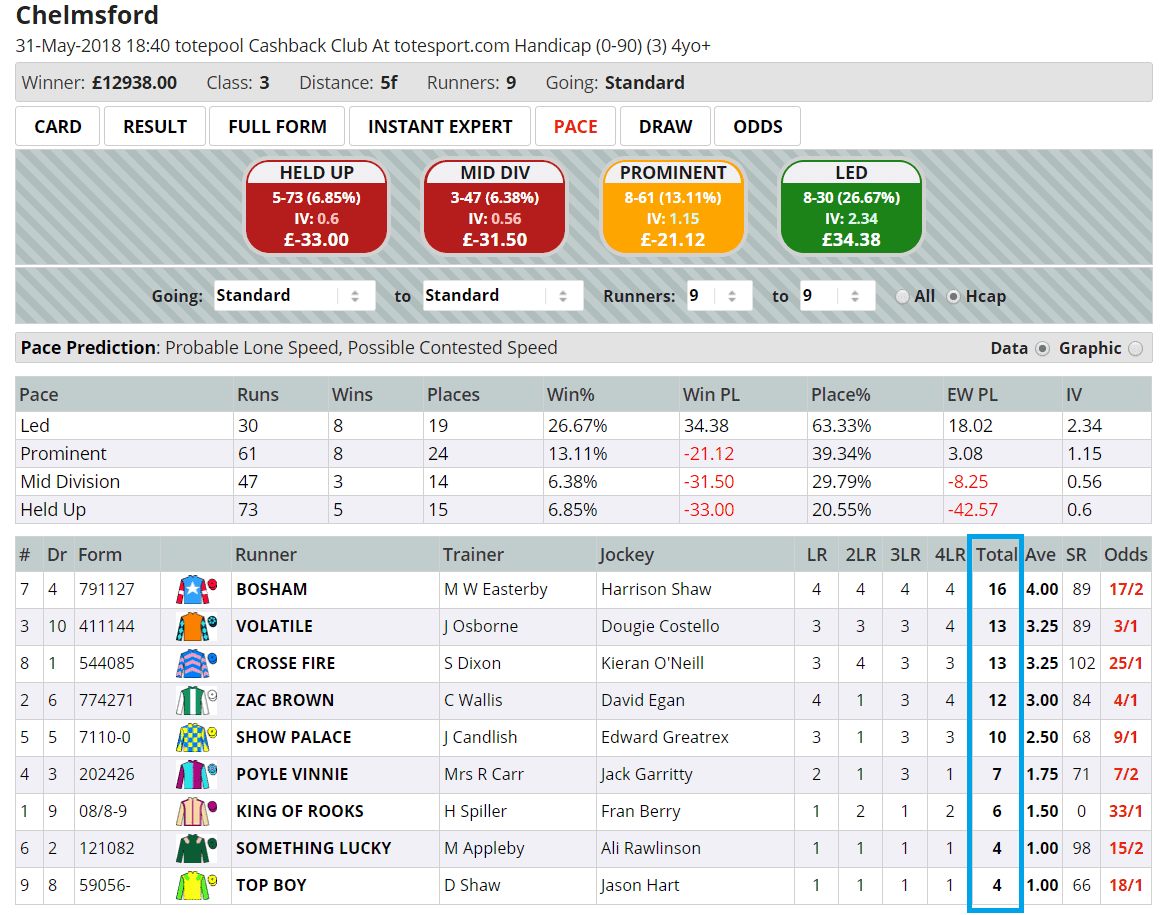
Chelmsford
| Pace comment | Wins | Runners | SR% | IV |
| Led (4) | 51 | 194 | 26.3 | 2.26 |
| Prominent (3) | 40 | 346 | 11.6 | 1.00 |
| Mid Division (2) | 22 | 252 | 8.7 | 0.78 |
| Held Up (1) | 30 | 410 | 7.3 | 0.63 |
Just over a quarter of the 5f handicap races at Chelmsford have seen the early leader going on to win. This is a very high percentage and worth noting. It is also worth pointing out that in races of 11 or more runners 9 of the 27 races (SR 33.3%) have been won by the front runner (IV 3.84). Not only that, another ten have been placed. Hence just over 70% of all front runners in these bigger field races have finished in the first three.
Kempton
| Pace comment | Wins | Runners | SR% | IV |
| Led (4) | 23 | 84 | 27.4 | 2.36 |
| Prominent (3) | 24 | 170 | 14.1 | 1.22 |
| Mid Division (2) | 4 | 72 | 5.6 | 0.49 |
| Held Up (1) | 8 | 177 | 4.5 | 0.39 |
It is a shame that Kempton seem to have so few 5f handicaps these days as the front running bias is at its strongest here. There is a decent inside draw bias here also and it should come as no surprise that front runners from the lowest three stalls have secured 11 wins from 33 (SR 33.3%). The IV is 2.88 for those well drawn pace setters. Hold up horses have a dreadful record also which is worth mentioning too.
Lingfield
| Pace comment | Wins | Runners | SR% | IV |
| Led (4) | 54 | 208 | 26.0 | 2.13 |
| Prominent (3) | 57 | 377 | 15.1 | 1.24 |
| Mid Division (2) | 16 | 227 | 7.0 | 0.59 |
| Held Up (1) | 31 | 436 | 7.1 | 0.58 |
Lingfield is another of the all weather courses to demonstrate a strong front-running bias over 5 furlongs. Additional insights are hard to find, although early leaders who were drawn 1 (the lowest draw) have produced 14 wins from 36 (SR 38.9%).
Newcastle
| Pace comment | Wins | Runners | SR% | IV |
| Led (4) | 22 | 137 | 16.1 | 1.74 |
| Prominent (3) | 37 | 393 | 9.4 | 1.03 |
| Mid Division (2) | 11 | 183 | 6.0 | 0.67 |
| Held Up (1) | 40 | 473 | 8.5 | 0.92 |
Newcastle has the weakest front-running stats of the six all weather courses, almost certainly linked (like Southwell) to it being a straight five as opposed to running around a turn, but an Impact Value of 1.74 still indicates front-runners do have an edge. Hold up horses perform quite well here so it is not a course and distance I personally get too involved with.
Southwell
| Pace comment | Wins | Runners | SR% | IV |
| Led (4) | 27 | 142 | 19.0 | 1.81 |
| Prominent (3) | 94 | 730 | 12.9 | 1.23 |
| Mid Division (2) | 4 | 102 | 3.9 | 0.41 |
| Held Up (1) | 14 | 342 | 4.1 | 0.40 |
The second lowest IV (1.81) for front runners, and again the straight nature of the track is likely a factor at a course where pace setters do well at other distances. Note that horses which try to come from midfield or off the pace really struggle over the five at Southwell. I have found no major additional angles to profit from, but ultimately steer clear of horses that regularly are held up.
Wolverhampton
| Pace comment | Wins | Runners | SR% | IV |
| Led (4) | 77 | 372 | 20.7 | 1.90 |
| Prominent (3) | 108 | 858 | 12.6 | 1.16 |
| Mid Division (2) | 10 | 190 | 5.3 | 0.52 |
| Held Up (1) | 60 | 897 | 6.7 | 0.61 |
Decent front running stats for Wolverhampton, too. Front runners when drawn close to the inside rail, (draws 1 to 3), have scored 32 times from 132 races (SR 24.2%) with an IV of 2.14.
*
Before I finish, we can use these numerical figures to create course and distance pace averages. I have done this by adding up the pace scores of all the winners at each course and dividing it by the total number of races. The higher the average score, the more ‘biased’ the course and distance is to horses which lead early or race close to the pace. This hopefully gives us the final piece of the jigsaw. Here are the 5 furlong handicap pace averages for the six aw courses:

Hopefully this article has demonstrated how strong the front running bias is on the all weather over the minimum trip of 5f in handicap races. The four turning courses offer a huge edge in my opinion. My next article is going to look at 6f handicaps on the all weather so watch this space!
- Dave Renham