
Gauging Trainer Consistency
I think most of us have favourite trainers or at least ones we prefer, but there is a good proportion of punters who use trainer form, be it long term or recent, as a significant part of their betting selection process, writes Dave Renham.
Introduction
Some people follow trainers at certain courses, others certain jockey/trainer combos, some look for first time runners in handicaps, etc. In this article I am going to try, and please note the word ‘try’, to find a way to determine how consistent an individual trainer has been over the past decade or so.
To do this I have taken data from the last ten full years of flat racing in the UK (turf and AW) and split it into two blocks of five years – 2015 to 2019 and 2020 and 2024. The idea is that I will compare the earlier data set against the more recent one. I have chosen an elite band of trainers to make the research more manageable.
Personally, the more consistent the trainer, the easier it is to assess the chance of any of their runners. And, when I am looking at a potential bet, I prefer the trainer to be consistently good rather than consistently bad!
Methodology
The question I had before I started was, what is the best way to undertake such a comparison of different trainers? What do I use? Win strike rates? Placed strike rates? A/E indices? PRBs? Or a combination of all of those?
The logical starting point for me seemed to be win strike rates. However, I hit a snag immediately. My initial idea felt really logical: compare the win strike rates of different trainers over the two different time frames across different parameters. Then divide the highest winning 5-year percentage by the lowest to give a Comparison Strike Rate (CSR) for each trainer.
I have used this type of CSR method before when comparing win strike rates but that was when I was looking at individual trainers or individual sires and comparing them with their own strike rates across various parameters. That ratio approach generally works well as a metric and it was plan for the second part of the article.

The problem with comparing one trainer’s CSR with other trainers is when the strike rates for each trainer vary significantly. It will probably be easier to give you an example to explain what I mean.
Imagine a 100-race scenario where a trainer had five winners, equating to a 5% win strike rate. Let us then imagine that in the next set of 100 races we saw nine winners (+4 winners). This is a highly plausible scenario, but suddenly the win strike has almost doubled to 9%. This would give us a CSR figure of 1.80. Imagine the same idea with a trainer that hit 25 winners in the first 100 races and then 33 winners in the second 100. Eight more winners is a decent improvement, twice the difference in winners compared with the first trainer, but their CSR figure is much lower at 1.32. To hit a comparable CSR figure of 1.80, 45 winners would have been needed in the second group of 100 races, equating to 20 extra wins.
So, I decided to put the strike rate CSR method on the back burner for the first half of the article, opting instead to use a value metric, A/E index, instead. This seemed a better plan for trainer to trainer comparisons as long as the sample sizes were not too small.
Small sample sizes can make A/E indices look far better or worse than they are in reality. That is the same for most metrics, of course, and is one of the perils of working with racing data. However, for decent sample sizes, A/E indices tend to be a good metric when it comes to comparing different trainers (and horses and jockeys and sires and courses, and so on).
For this article I will be using a minimum of 30 runs within each area to qualify and, as I mentioned earlier, will be using A/E indices to make comparisons for this first half of the piece. The indices are based on Betfair Starting Prices.
Trainer Consistency: 2yo runners
Let me look at some two-year-old (2yo) data first, starting with the individual trainer A/E indices for horses making their debuts. I will divide the bigger A/E index by the smaller one to create a comparison A/E figure using a similar idea to the one mentioned earlier with the Comparison Strike Rate (CSR). I will call it the CAE figure:
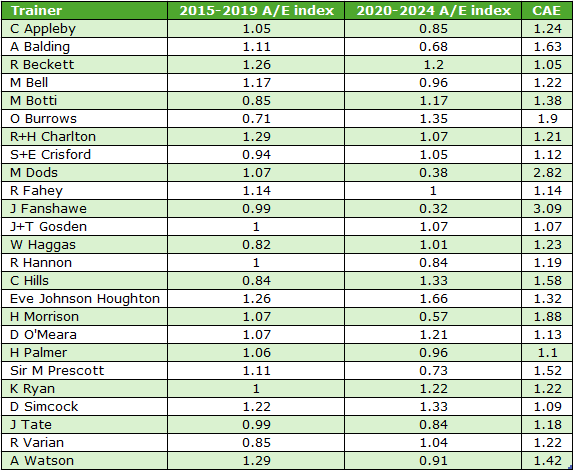
The closer the CAE figure is to 1.00, the more consistent the trainer has been in relation to comparing their A/E indices over the two-time frames. Based on this method, as far as 2yo debutants go, the trainers that have shown the most consistency are Ralph Beckett (1.05), J & T Gosden (1.07), David Simcock (1.09), Hugo Palmer (1.10), Simon & Ed Crisford (1.12) and David O’Meara (1.13).
Owen Burrows has shown a real uptick in performance from 2015 to 2019 compared with 2020 and 2024. His CAE figure of 1.90 underscores this. In fact, when we drill into his performance with 2yos on debut we see that in the past two full years (2023 and 2024) these runners won nine races from just 30 starts (SR 30%) for a BSP profit of £32.79 (ROI +109.3%).
Moving onto 2yos on their second career start, here is a graphical comparison of the trainers’ A/E indices across the two-time frames. I have split the trainers into two groups in order to fit in each graph:
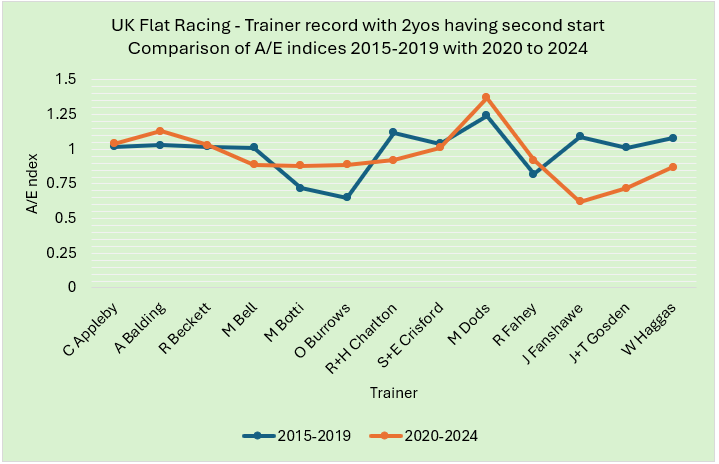
The closer the orange and blue dots are to each other, the more consistent the trainer’s A/E indices have been across the two periods.
Converting these into CAE figures we see the most consistent trainers from this group with second time starters aged two have been Ralph Beckett (1.01), Charlie Appleby (1.02), Simon & Ed Crisford (1.03), Andrew Balding (1.10), Michael Dods (1.10), Richard Fahey (1.12) and Michael Bell (1.13). Interestingly, when we look at the two win strike rates for these seven trainers, their strike rates have been very similar, which adds further confidence in the findings.
Onto the second batch of trainers now:
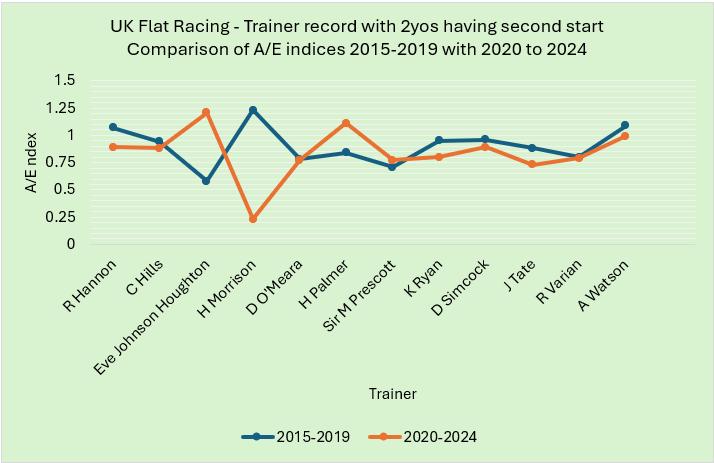
In this group the trainers with the closest CAE figures to 1.00 are Roger Varian (1.01), David O’Meara (1.01), Charles Hills (1.07), David Simcock (1.08), Sir Mark Prescott (1.08) and Archie Watson (1.10). These trainers have produced some consistent performances across the board with their 2yo second starters.
Trainer Consistency: 3yo runners
I want to move on to three-year-old (3yo) races next and am going to look at a much bigger data set, namely all 3yo non-handicaps. In theory, we should see the CAE figures much closer to 1.00 than before due to the sample size.
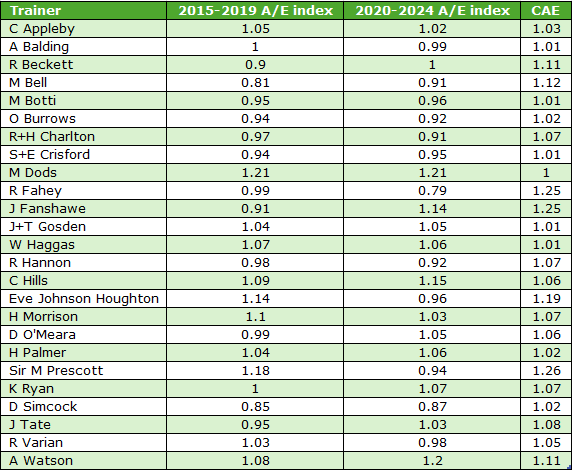
With 18 of the 25 trainers having a CAE figure of less than 1.10, this is an indication that most of these top trainers do perform to a similar level year in year out with specific horses in specific races – in this case 3yos in 3yo non-handicaps. Larger samples of data are less affected by those occasional unusual results which can impact on smaller data sets.
However, it should be noted that Richard Fahey and Sir Mark Prescott have both seen a dip in performance in 3yo non-handicaps over the past five years. Fahey’s record across both time frames has been particularly contrasting as the table below shows:
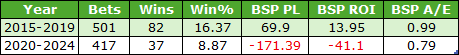
The strike rate has almost halved, and the returns have gone from a strong positive figure to a poor negative one. Conversely, James Fanshawe has seen an uptick in performance over the past five years, turning an 8% loss at BSP from 2015 to 2019 into a 22% profit from 2020 to 2024.
It’s now time to switch methods for the second half of the article where I aim to examine some trainer course data.
Trainer Consistency: Racecourse Angles
For the trainer course data, I plan to look at a selection of individual trainers comparing their course records and so, as I stated earlier, I will revert to the CSR (comparison strike rate) concept. Again, to help make comparisons easier when I divide the strike rates, I will divide the bigger by the smaller to give figures of 1.00 or higher.
Charlie Appleby
A look at the Godolphin trainer Charlie Appleby first. Here are the courses where he has had at least 30 runners in both timeframes:
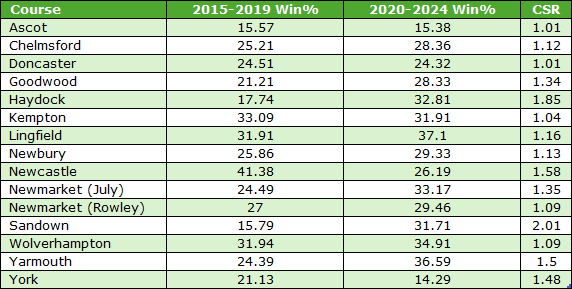
I think this table shows why as punters need to be a little careful when it comes to some trainer course stats. Yes, certain trainers do target certain courses, and some are able to consistently repeat successes year on year. However, even for someone like Appleby, who has a yard chock full of top-quality horses, not all courses have delivered similar strike rates in the two five-year batches. At Sandown his win record has been excellent in the past five years but was relatively modest in the earlier five, giving a CSR figure of 2.01. The same applies for Haydock and the splits for Appleby at the Warrington track are as follows:
In terms of returns, we can see that Appleby’s figures have improved by around 40p in the £, although despite this he did not manage to get into overall profit.
Looking at which courses it might be worthwhile considering backing his runners in the future, I would say the following: Doncaster, Lingfield, Newbury and the Rowley course at Newmarket. My thinking is that these five have not only seen consistent performances (CSR figures all between 1.00 and 1.16) but have produced blind profits to BSP in both of the two five-year time frames. Ascot also falls into that category but his figures there are skewed by a BSP winner priced 36.0 in 2017 and a BSP 75.0 winner in 2022.
Before moving on, Appleby’s record at the Newmarket Rowley course is worth sharing in more detail; from 2015 to 2019 he had 54 winners from 200 (SR 27%) for a profit of £58.62 (ROI +29.3%). From 2020 to 2024 his record read 104 winners from 353 runners (SR 29.5%) for a profit of £105.76 (ROI +30%). Eight of the ten years saw the Godolphin trainer produce a blind profit on all his runners.
Andrew Balding
There are three courses where Balding has turned a profit in both five-year time frames and hit a low, i.e. consistent, CSR figure. These are Chester, Doncaster and Newbury. Of the three, Chester has the most consistent feel to the stats. He has a good record there with shorter priced runners (BSP 10.0 or lower) hitting a strike rate of 26.2% (71 wins from 271) for a profit to BSP of £60.34 (ROI +22.3%).
With bigger priced runners (above 10.0) at the track, he has made a profit of £73.52 (ROI +61.3%) thanks to 10 winners from 120. Overall, taking all prices into account, he has made a blind profit there in seven of the ten years.
Ralph Beckett
For Beckett I have produced a table of his CSR figures for different courses and these are shown below:

Doncaster, Wolverhampton and York have seen consistent CSR figures of 1.03, 1.13 and 1.01 respectively, with all three of them proving profitable across both time periods.
Chelmsford has a slightly higher CSR at 1.29 but this is a fourth course I would look out for Beckett runners as these splits are decent:
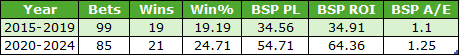
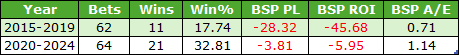
In contrast, his record at Lingfield (turf and AW courses combined) has been all over the place. The 2.30 CSR screams this and, if we look at the yearly win strike rates, coupled with the win & placed (EW) ones, we see the following:
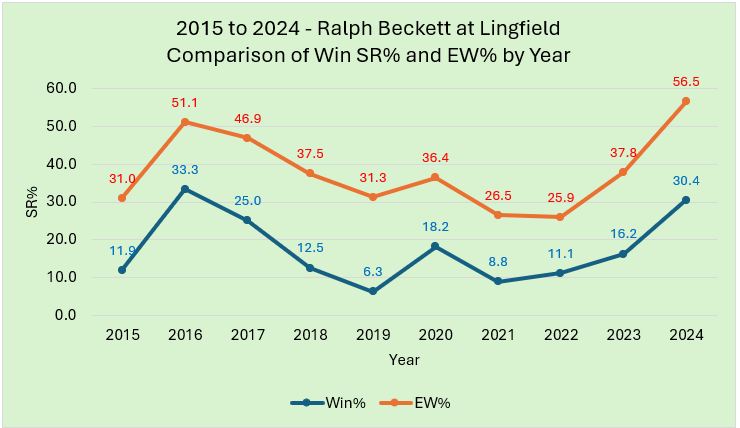
We can see the huge discrepancies comparing 2016 and 2024, where the win rates were over 30%, with 2019 and 2021, where the win rates were 6.3% and 8.8% respectively. These results are based on fairly decent yearly sample sizes, too, with eight of the ten years having 30+ runners at the course.
I have said it many times before in articles that some stats can be misleading, and the more digging we can do behind the numbers the better.
Other Profitable Trainer Consistency Angles
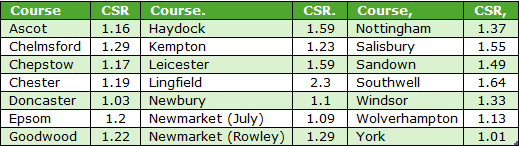
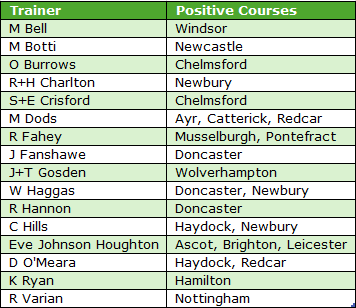
Time precludes further trawling of the full list of trainers in such detail but I will share the remaining positive trainer/course stats, based on the combination of low CSR figures combined and two profitable five-year time frames. Trainers not shown failed to complete that double qualification for any course:
Outro
As I stated at the outset, this was a piece of research where I wanted to try to establish when trainers show consistency within certain parameters. Hopefully all the hours of research combined with my approach has at least offered some tasty food for thought. I am sure the ideas are not foolproof, but I believe they have merit and utility.
Comments are always welcome and if there are any tweaks to the methods that you’d like to discuss, please let me know in the space below.
- DR
Other Recent Posts by This Author:
- Combining Pace and SR Ratings, Part 2
- More on Combining Pace and SR Ratings
- A Look at Summer All-Weather Racing
- 3yo+ First Time in a Handicap: An Analysis
- Royal Ascot 2026: Must Know Betting Angles


A nice piece of work.
Good to see BSP A/E being used. This is a more useful metric than ‘ROI to level stakes’ as the latter is prone to more variance. BSP A/E indicates the gross profit (before commission) if horses were staked proportionally. That is, staked to return a fixed amount including stake (1/BSP). After all, why would you stake a 20/1 shot the same as an even money shot? Appleby showed a 14% gross profit at Haydock to proportional stakes. A loss at level stakes.
An analysis of trainers’ performances with their horses fourth run, first run in a handicap would be interesting. 😉
Another good thought provoking article, Dave.
Concentrating solely on the trainer/course part of the article, I do have a tweak to suggest but it’s more of a sense check in truth. For me to take a trainer’s record at a course seriously, I’d want to see that the yard’s figures are not being assisted by horses that are racking up plenty of repeat wins. Don’t get me wrong, the trainer still has to take credit in that scenario but conversely if they are consistently sending a variety of animals each year to a specific track and getting consistent winners then I’d take more notice. It’s probably not easy to build that in to the results above in fairness to you. It is something that people should consider though and Query Tool will easily help give answers to Gold users.
For me, a trainer’s record at a track is only important when it’s a poor one as I may re-consider a potential bet if I find this is the case. I believe the horse and jockey’s many diverse credentials tower above the trainer’s track record in terms of influencing race outcomes. However, I do pay very close attention to the stable in other senses though.
Cheers
Russ
Yes Russ – excellent point about repeat winners. Should have added that in.
cheers
Dave
Leave a Reply
Want to join the discussion?Feel free to contribute!