
Handicap comparisons – last run to current run (Part 2)
This is the second article of two where I am continuing to look at some handicap data focusing on horses in terms of their most recent run compared with their current one, writes Dave Renham. The first article can be viewed here.
Introduction
In the first piece I looked at a variety of criteria including distance, class, weight carried, official rating (OR), average race OR, odds, course and trainer. I looked at each of these individually, but in this second half I plan to combine some of those variables. I also plan to look into trainer-based ‘last run to current run’ stats in greater depth.
I have analysed UK flat handicap races between 2019 and 2024 on both turf and all-weather (AW), with a few caveats. Firstly, horses must have been at least three years old; secondly, they must have had at least six career starts; third, they must have run in a flat handicap last time out; and, finally, their price must have been 12.0 BSP or lower.
Sticking with horses aged three or more seemed logical as far as handicap races go; and with horses needing at least six career starts to qualify, it means that most of them would have found their niche as it were in terms of distance, class, and so on. Using last time out (LTO) flat handicaps meant we could get a proper comparison in terms of changes in distances, official rating, weight etc., while the price limit avoids bottom lines being skewed by the odd huge price making the winner’s enclosure. Profit and loss detail has been calculated to Betfair Starting Price (BSP) less 2% commission on winning bets.
Before sharing my latest findings I want to set the scene, which I hope explains why I started looking at specific combinations of criteria. Hopefully the next paragraph will do this!
Context
The class of race that a horse runs in is restricted somewhat by their OR (also known as their handicap mark), so most horses race at a similar level to the one they raced in last time. Hence, horses tend to run against a similar level of opposition from one race to the next. This may change a little over a period of races as there will be some horses that are improving or running consistently well. For example, horses that win multiple races in a relative short number of races will soon move up class levels and face stronger opposition.
Of course, we can get the opposite with horses struggling and sliding down the handicap, and thus facing easier opposition in subsequent starts. However, as stated earlier, most horse ply their trade in a similar class, and also race over a similar distance, and perhaps there is something to said for horses being familiar with the type of race they are running in.

When back at the trainer’s yard, racehorses tend to be looked after day to day by the same person, kept in the same stable, ridden out by the same jockey: a fairly well defined routine. Horses have familiarity at home all the time, because it provides safety, stability and so on. It makes sense therefore that horses should respond to familiarity on the racecourse.
"Doing the same thing"
So the first combinations of criteria I researched were ones that were the same in this race as in the previous run. My initial focus therefore was on familiarity or similarity at the racecourse. I chose six variables - distance, class, weight carried, OR, average race OR, and betting odds - and I combined three of them at a time. This means I looked at 20 different three-way combinations. Here are my findings:
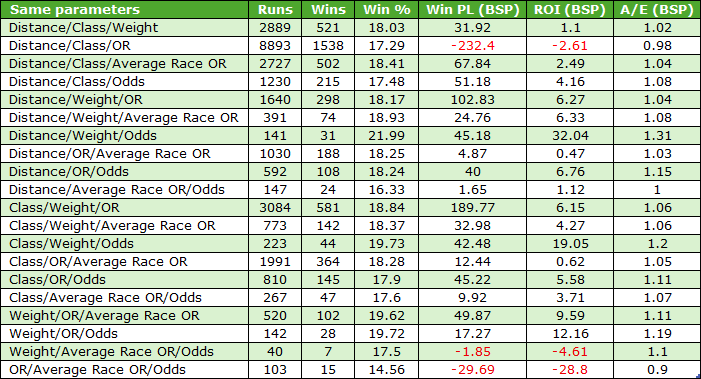
It was a surprise to find that 17 of the 20 combinations had produced a profit to BSP. Not only that, two of three losing combos came from the two smallest samples (40 and 103 qualifiers respectively). Maybe there is something to be said for familiarity on the racecourse?
Of course, there are numerous other three-way combinations I could try. I could change the parameters so that they all differ, or indeed one or more differ with one or more remaining the same. However, that would take an age to calculate, and we would have perhaps the biggest table of data in the world to try and analyse! Moreover, I could potentially try combining four parameters in any which way, or two... the list is endless.
Back in trip with some variables the same
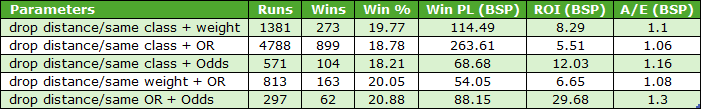
However, before moving on to my trainer analysis I would like to share a few more combinations, because one of the things that came out of the first article was that horses dropping in distance outperformed those that were upped in trip. So it makes sense to look at some combinations with one of the parameters being ‘dropped in distance’. The other two parameters I will keep as the ‘same’. Here are a few of the more profitable combinations in terms of ROI% first:
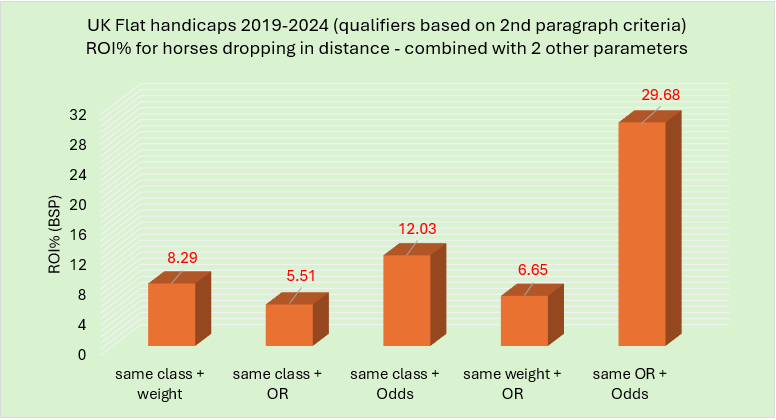
All five shown provided solid returns and the full splits with strike rate percentage (SR%) and profit are as follows:
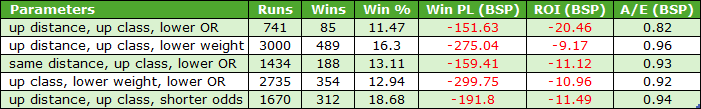
With so many three-way combinations producing positive results, we could be forgiven for thinking that virtually all of them have been profitable. That is certainly not the case, however, and there were a few that lost a fair few quid. Five such 'dodge or lay' combinations are shown in the table below:
To summarise, thinking about the original table I shared where three parameters stayed the same and were then combined, it has made me feel that the fewer changes the better for most horses running in handicaps. It makes sense, of course, and from the numbers I have crunched at least it seems this is the case. Perhaps this is largely a case of horses running well and "if it ain't broke, don't fix it".
Trainers
The second part of this article is devoted to a variety of trainer-based stats that came out of my research. For any trainer to qualify in this section, they would have needed to have saddled at least 100 runners within each group.
Change in Course
In the first piece it was noted that horses that were racing at the same course as they did LTO had a slightly better record overall than those that switched courses. I wondered, are there any trainers that show a significant difference in their 'same course' vs 'different course' results? Well, yes, there were six trainers who seemed to strongly fit that profile and the graph below shows a comparison of their win strike rates:
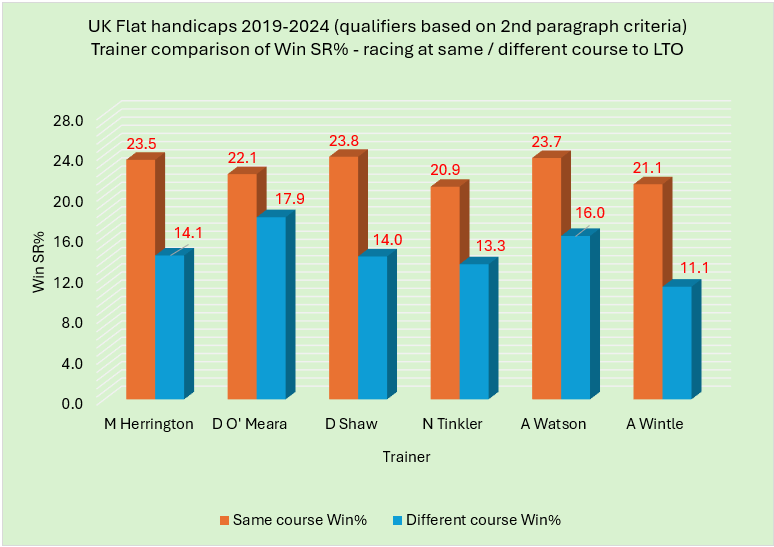
It is nice to see some trainers that we rarely see in my articles appearing here such as Michael Herrington, Derek Shaw and Adrian Wintle. There were some significant differences in their respective win percentages. However, does that translate to other metrics? The full stats are shown in the table below:
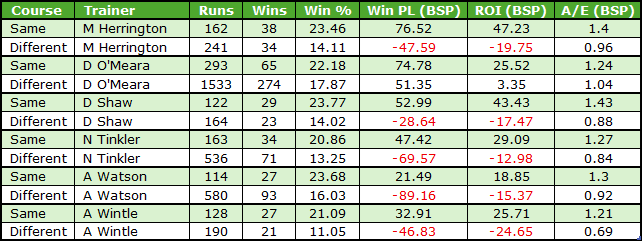
All six produced far better returns and improved A/E indices with those much better win strike rates. David O’Meara has been profitable with both groups but the ROI% differential is still over 22% or 22p in the £.
One additional stat I would like to share is that horses from these six stables which finished in the first three LTO, when returning to the same track next time combined to produce 149 wins from 599 runners (SR 24.9%) for a profit of £208.33 (ROI +34.8%).
Change in Distance
I next wanted to see if there were any trainers that had significantly different figures in connection with distance change? There were seven trainers where this was the case and, in the table, below I have shared their ROI% and the A/E indices across the three metrics – horses dropping in distance, horses upped in distance and horses racing over the same distance.
Anything highlighted in blue is a strong positive, anything in red is a strong negative and anything black is neutral:
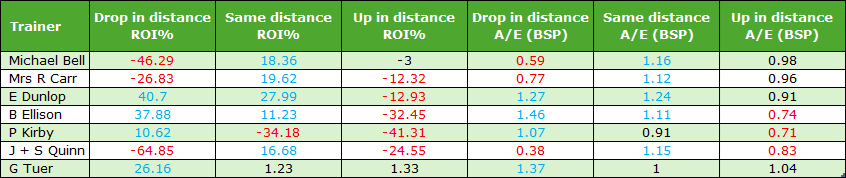
Again, it is good to see some different names from those who usually appear. As the table shows, Michael Bell, Ruth Carr and the Quinn stable fared particularly well when keeping their runners to the same distance. Brian Ellison, Philip Kirby and Grant Tuer excelled with horses dropping in distance from their last run. Meanwhile Ed Dunlop had a good record with both horses dropping in distance and racing at the same distance. Pretty much all seven, perhaps excepting Messrs. Tuer and Bell, struggled when moving horses up in distance.
Change in Class
A look at change in class of race next and for this section I am going to look at four trainers individually.
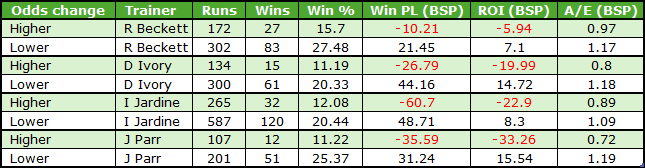
Ralph Beckett
A look at Beckett’s figures first:
As we can see, his runners struggled when upped in distance. They had a much lower win rate, lost a significant amount to BSP (unlike the other two which made good profits), and their A/E index was poor at 0.77. For the record, they had a much poorer placed record too. We should be a bit wary of Beckett horses moving up in grade.
Julie Camacho
Not a trainer I have studied or shared many stats on in the past, but there are definite differences with Camacho's results for class change:
Horses racing at the same level as last time performed really well and may be worth looking out for.
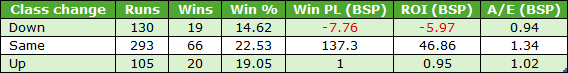
Scott Dixon
Another trainer rarely discussed in previous articles but Dixon had some very strong stats. Below are the A/E index comparisons first:
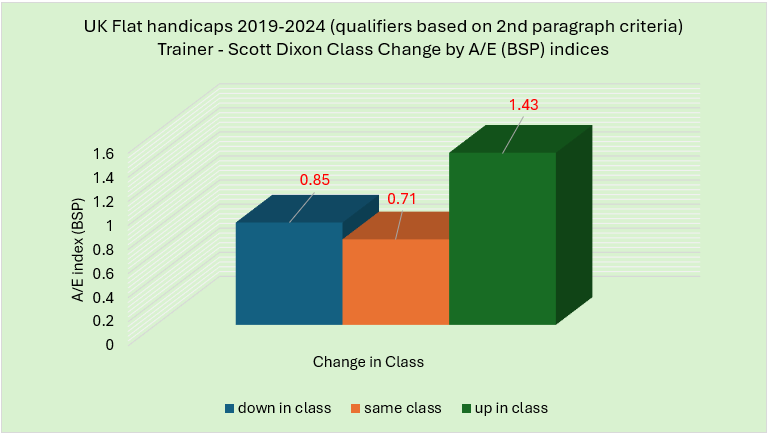
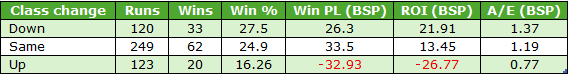
Horses upped in class performed exceptionally well based on these figures. When we analyse a wider set of metrics we can see that this is the case across the board:

Based on these findings, Scott Dixon’s runners should be noted when upped in class as the data look extremely solid. These runners did slightly better in sprints compared the other distances.
R Fell + S Murray
Finally in this section, a look at the Fell/Murray duo. They performed best when keeping runners to the same class. The table below shows the splits:
A solid performance for the pair when running in the same class, doing particularly well in Class 4 handicaps as well as with their female runners.
Change in Odds
Shorter this time than last time
The final trainer area I examined was a change in odds. The sample sizes for trainers with horses which were sent off at the same odds were too small so I compared only lower odds to their last run and higher odds to that previous race. The first table shows trainers who performed far better with runners whose price was shorter (lower) than on their previous run compared with those whose price was higher:
In general, we would expect much better strike rates for the 'lower' group across all trainers, not just this select band: shorter prices win more often than bigger prices, simple as that. However, these four had much more significant differences between the ‘lower’ and ‘higher’ results than the other trainers I looked at.
Longer this time than last time
Onto the more unusual group of trainers who had more positive results with horses which were bigger prices than they were last time out:
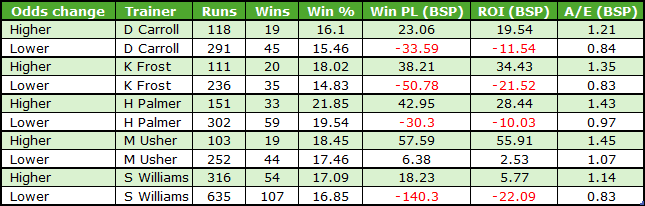
All five had better strike rates for their runners sent off longer than last time, which goes somewhat against the grain. There were decent profits across the board for this cohort and again it was good to see trainers that have rarely appeared in other articles (Declan Carroll, Kevin Frost, Mark Usher and Stuart Williams).
**
I think that's plenty for this piece. Both this one and last week's have uncovered some interesting stats and hopefully there will be ways to profit from those in the future.
Until next time...
- DR
Other Recent Posts by This Author:
- A Look at Summer All-Weather Racing
- 3yo+ First Time in a Handicap: An Analysis
- Royal Ascot 2026: Must Know Betting Angles
- Analysing Racing Post Ratings (UK Flat)
- Analysis of 3yo and 3yo+ Maiden Races


Excellent and thought provoking as usual Dave. Much to take in and work out how best to track these gems. Thank you.
Richard.
Leave a Reply
Want to join the discussion?Feel free to contribute!