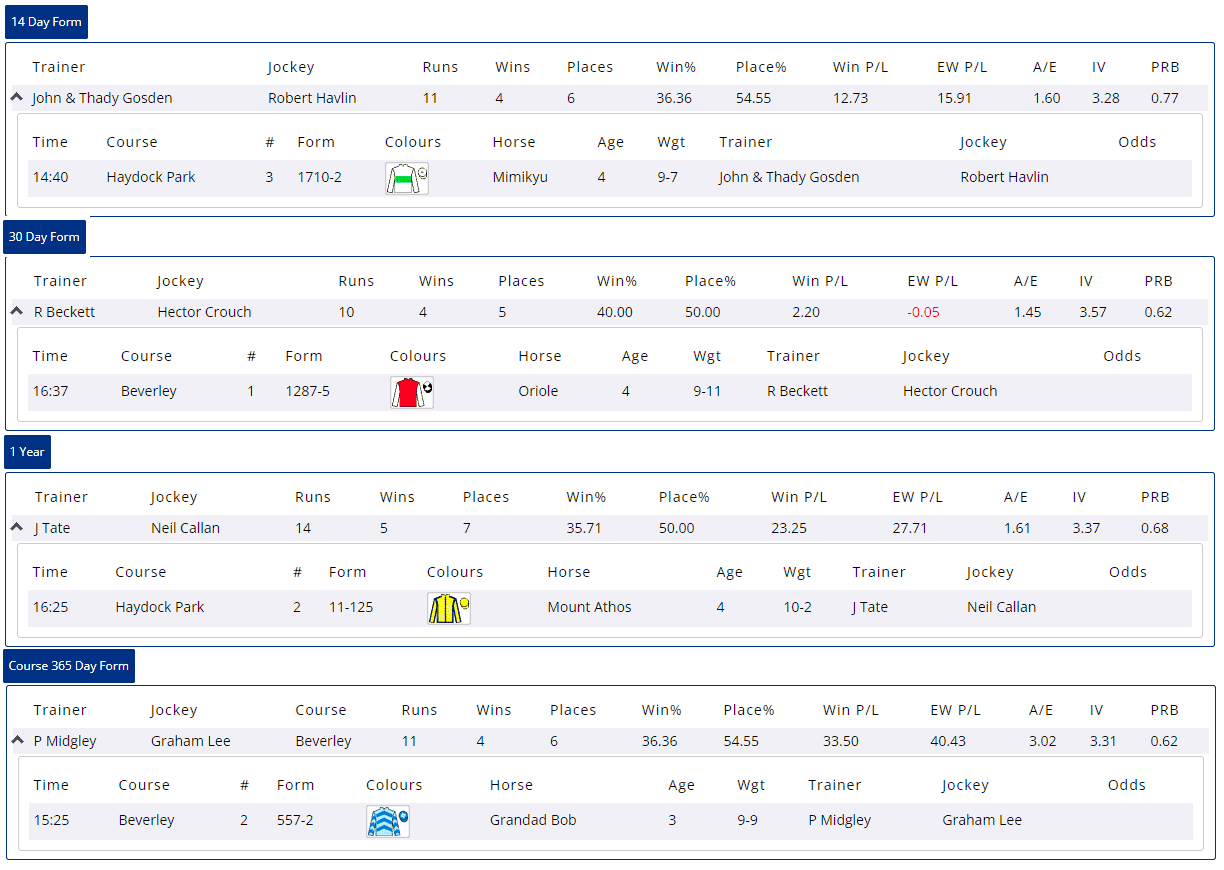
Wednesday's free Geegeez GOLD feature, the Trainer Statistics (TS) report is, in fact, four reports in one. It contains information on a trainer’s recent form, and their longer term course form. For each of 14 day, 30 day, course one year, and course five year, users can filter by runs, wins, places, win profit/loss and each way profit/loss. Clicking on any row in the report will reveal the runners that trainer has entered on the day in question, and clicking on the runner row will open that race in a new tab.
HINT: It can help to cross refer the profit figures of the trainer with their win/place percentage. A few big priced winners can mean a trainer has a high profit number but a low strike rate. You may need to be very patient, and a bit lucky, to come out in front this way!
[ Please refer to our User Guide for further information ]
In addition to the free daily feature, we always open up a number of racecards to non-Gold subscribers and for Wednesday, they are...
...have only highlighted the following two yards in good recent form...
14-day form...
30-day form...
Of the nine races highlighted above the first of the free cards is for a Listed event, but I'm not wild about lightly raced 2yr olds, so next best is actually the 4.20 Beverley, an 11-runner, Class 4, 3yo+ flat handicap over a right-handed 7½f on good to firm ground...
Reputation is considerably older than the rest of the field, but he is our sole LTO winner here, yet he might need the run after a break of almost a year. Autumn Festival, Metahorse, Craven and Ring of Gold all had top three finishes with the latter denoted as a fast finisher : perhaps he needs to get going sooner!
The top three in the weights (Autumn Festival, Mudamer and On The River) all drop down from a recent run at Class 3 and Mudamer is the only one of the three yet to win over course and distance. In fact none of the rest of the field have achieved this, but Beltane has at least woin here at Beverley over 1m½f back in June, two starts ago.
We know that Reputation has been away for a good while, but apart from Ron O's 103-day absence, the rest of the runners here have all raced in the last six weeks.
Instant Expert says that a few of these are shy of wins under expected conditions...
...although they do seem to have the knack of making the frame...
From those numbers above, I'd be a little concerned about Beltane's inability at Class 4 and the fact that Satin Snake just doesn't win on turf. Ron O is some 18lbs higher than his last/only turf win, but he has won the A/W recently off just 2lbs lower than today, whilst Craven would probably prefer the ground to be closer to good than it is to firm. Top weight Autumn Festival looks the one to beat on those figures above, but stall 11 of 11 might not be helpful, let's check...
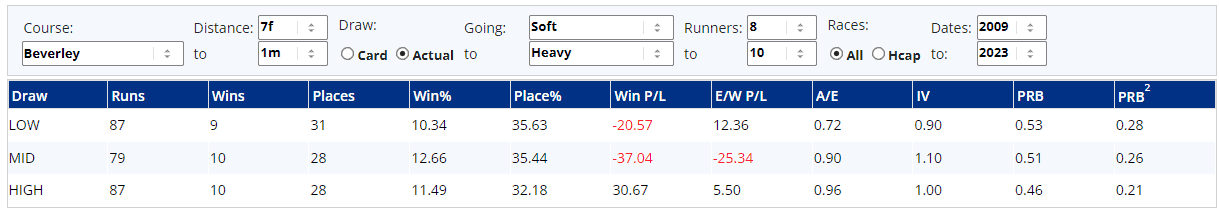
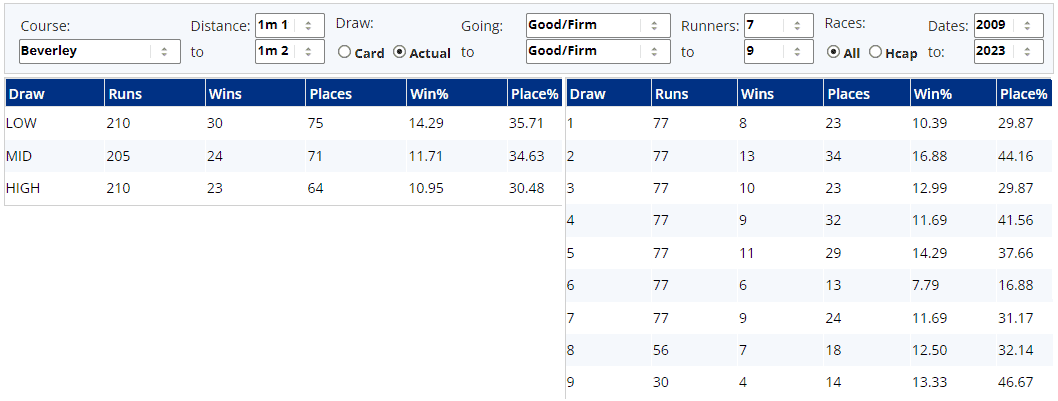
The draw stats are actually a little misleading here, as if we split the field into thirds ie low, mid and high draw, then a high draw looks favourable...
...but stall by stall suggests that whilst stalls 9 & 10 have done well, those drawn 11 or 12 have struggled...
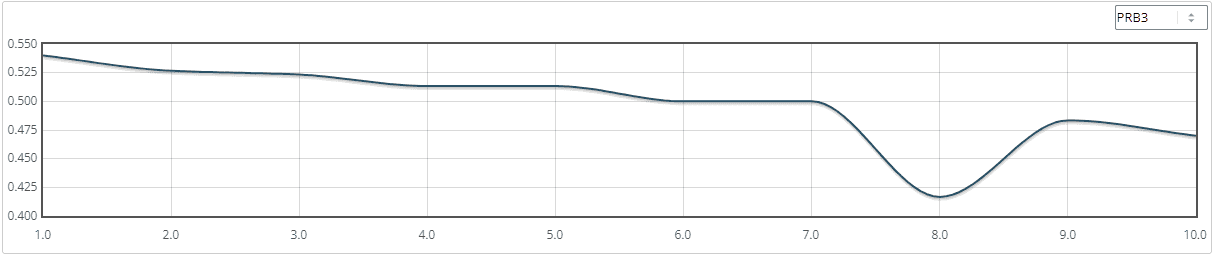
...and the PRB data suggests a lower draw is better...
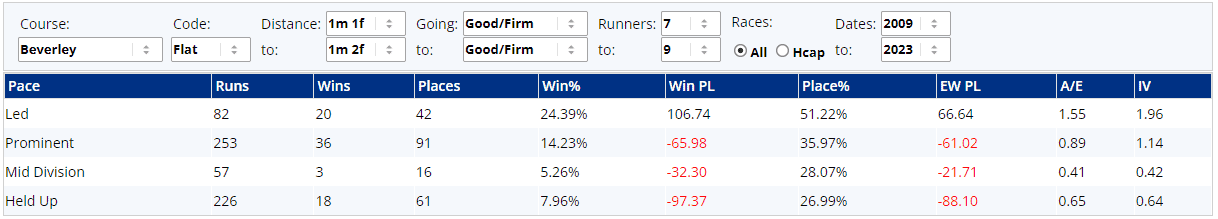
I'm going to mark that as inconclusive and focus upon the pace data from those races above, as I've got it in my head that this is where the race will be won or lost and those races above have gone as follows...
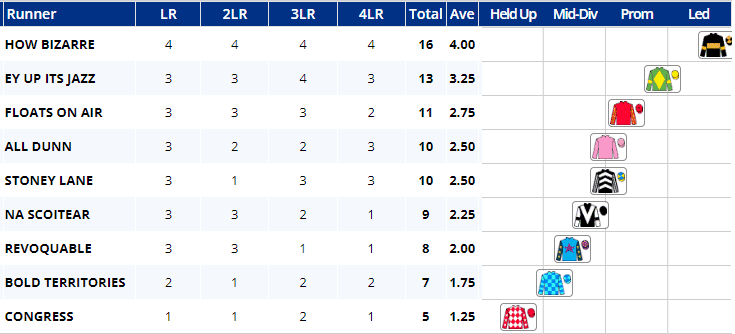
...with front-running horses definitely the ones to be on and this focus on pace rather than draw is also reflected in the pace/draw heat map...
So, who will lead? Well, we don't actually know, but by looking at how the field have approached their most recent outings...
...you'd probably want to be focusing on the upper half of that table.
Summary
So, we're looking for those in the upper half of the pace chart who should enjoy conditions here and who also come here in some semblance of reasonable form.
Beltane looks like the pace-maker, he gets good to firm ground and has two wins and two places from his last five runs, so plenty of positives there. he hasn't got a great record at Class 4, but that's probably why he's 13/2 from Bet365 (the only book open at 3.50pm Tuesday), but he'd be in my top three for this one, as would On The River, who'll also be up with the pace.
He has won four of his last seven and won here over course and distance two starts ago. He's good at Class 4 and at this venue, he's down in class but would probably prefer the ground to be softer. The doubts over the ground are again reflected in his price, as he too is priced at 13/2 in the early market.
My final one for the frame is probably top weight Autumn Festival, he's also likely to be up with the pace, scored really well on Instant Expert (especially for a place) and is 2lbs lower than his last winning mark. He has made the frame in two of his last three starts, both at Class 3; he's down in class here and a pound lighter than LTO and at 8/1 would be my E/W play.
Sorry for being later than usual this evening, I've spent much of my weekend helping my travel clients affected by the terrible fires on Rhodes (yes, I'm a travel agent away from the racing, so if you need a holiday, I'm your man!), but I'm back with you all now with a preview for Monday.
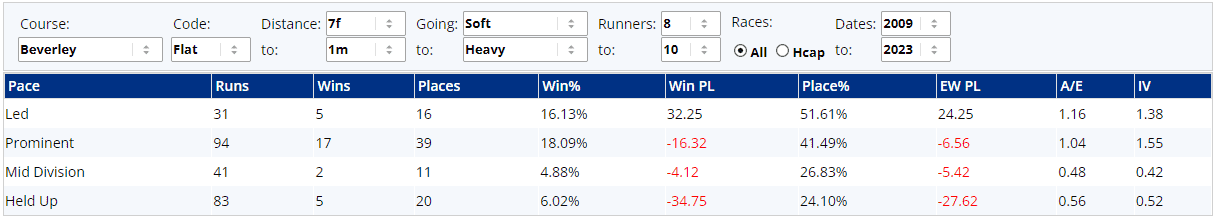
The pace tab on our racecards gives valuable insight into not only how every race is likely to be run, but also what the best run styles are in the given conditions and using this feature will keep you one step ahead of the masses. It's such an essential facet of betting that we make this information freely available to all readers for all races every Sunday and Monday, including of course, our free races of the day...
6.10 Ballinrobe
7.30 Beverley
8.20 Windsor
8.30 Beverley
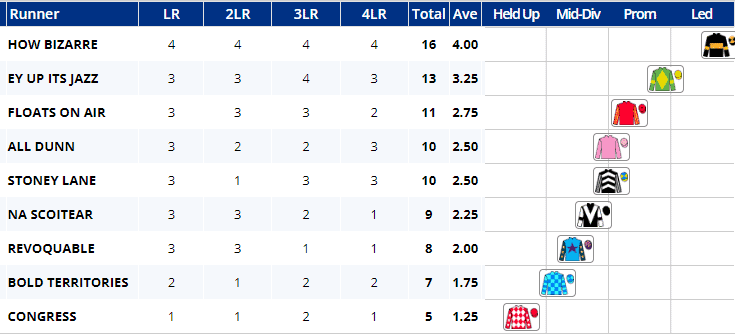
Of the three UK free races, the first seems to have biggest spread of pace based on the field's last four runs, as this is how the runners in the 7.30 Beverley have approached their most recent contests...
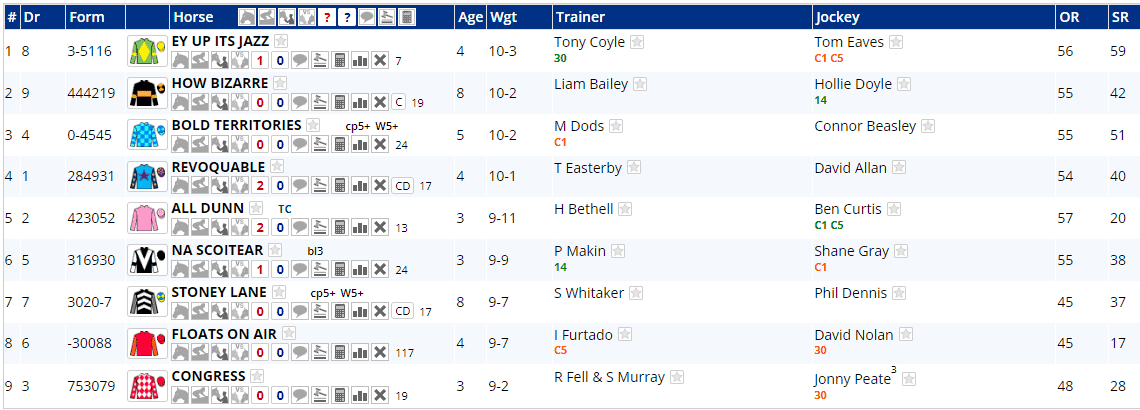
The race itself is a 9-runner, Class 6, 3yo+ flat handicap over a right-hand 7½f on soft ground that is already heavy in places and here's how they'll line up...
Revoquable won here over course and distance last time out, albeit on good to firm ground, but it does mean that he's the only one coming here off the back of a win. Stoney Lane has also won here over course and distance, whilst How Bizarre has won over 1m½f on this track. None of the other have won at either trip nor track.
All Dunn makes a yard debut for Harriet Bethell less than a fortnight after a good runner-up finish at Wolverhampton on his final run for Jamie Osborne and aside from Revoquable's win LTO, he's the only one to have made the frame last time around, but Ey Up It's Jazz has won two from three and How Bizarre won two starts ago.
Floats On Air might need the run after a break of almost four months and all of his rivals here have raced in the last 24 days with Ey Up It's Jazz have had just a week's rest. These are all confirmed Class 6 runners and none raced at a higher level last time.
Instant Expert paints a typical Class 6 picture of very few wins, but one of them has won on soft/heavy ground already and all bar two have won at Class 6. If you change the parameters on Instant Expert, you'll find that How Bizarre has won at Class 4 and Class 5, whilst Bold Territories and Stoney Lane are also former Class 5 winners...
Ey Up It's Jazz is the clear eye-catcher, but with really poor win figures for most of the field (anything in red from 10+ races is poor), I thin we're going to need some help from the place stats...
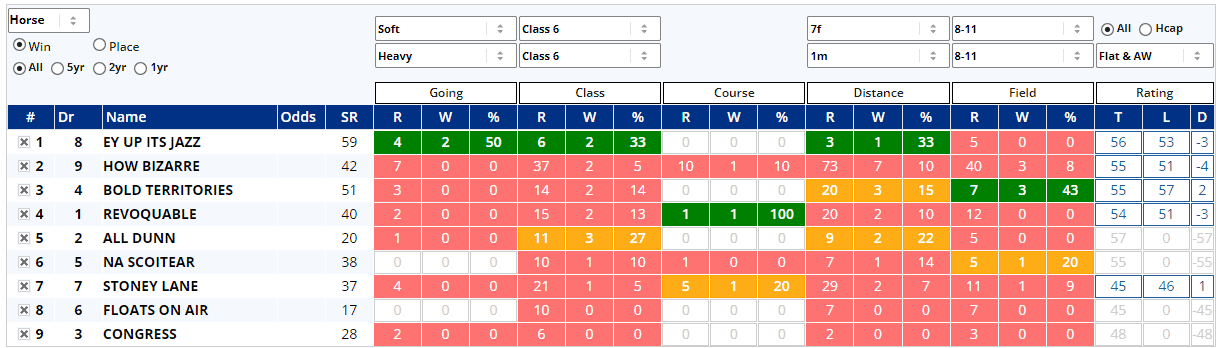
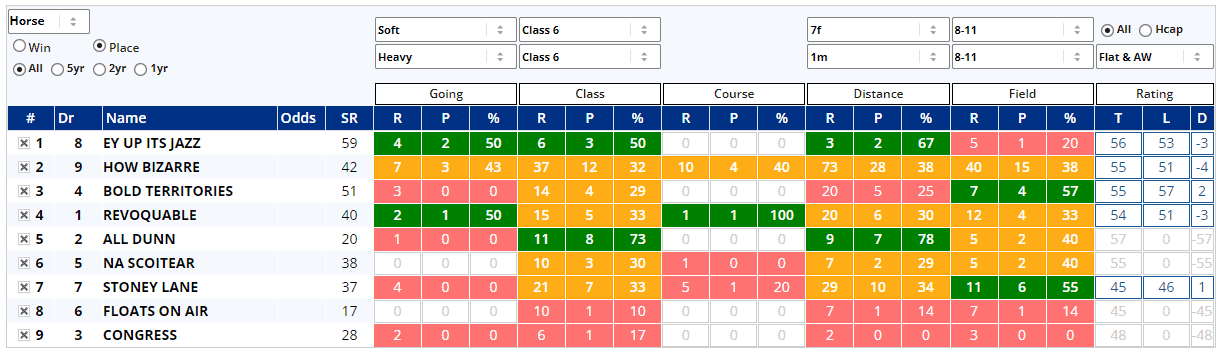
...which still aren't brilliant, but do suggest that some of these might well have enough in their lockers to make the frame. Sadly, I'm underwhelmed by the numbers for Floats On Air and/or Congress, so they're out of the picture for me, as I go and look to see if the draw might have an effect on the outcome here...
...but there doesn't seem to be much in it. The PRB3 figures pretty much say the same, but do suggest that the lower you're drawn, the slightly better chance you seem to have...
It's not a huge bias, but ignoring the clear anomaly that is stall 8, the PRB3 figure for stall 1 (0.54) is 108% that of stalls 6 & 7 (0.50), so there's a slight advantage there, which could be good for Revoquable & All Dunn in the two lowest stalls. And now back to where we started, our daily free feature, the PACE. We know from the top of the page that the runners have approached their most recent contests like this...
...and if we look at how those Beverley races we used for the draw stats have panned out...
...you'd probably want to focus on those with an average pace score of at least 2.50, although I'm interested in Revoquable's last two runs, where he raced prominently leading to a course and distance win last time out, suggesting he'll race that way again here. Bold Territories misses the cut here.
Summary
I've disregarded three already, leaving me with six to consider, from which I think Revoquable is the one to beat. He's drawn well, won over C&D recently and should race prominently, he has made the frame in tricky conditions before and I think he'll make it back-to back wins here. We're not getting rich at the 10pm price of 3/1, but it's probably a fair price.
All Dunn is the 5/2 fav and whilst I do like his chances here, that's too short for me, but he should be there or thereabouts. The one I do like from an E/W perspective is the 11/1 How Bizarre, he has a win and a runner-up finish from his last three outings, has won at both Class 4 and Class 5, has a consistent record at making the frame under these conditions and will be the likely front runner here. As long as only two pass him, we'll be fine!
Saturday's free feature is the Trainer/Jockey Combo (TJC) report, which works by bringing together the form of trainers and jockeys into a single composite report that has produced excellent results for users. Basically, some trainers turn to specific riders when they have one ‘ready to win’ and this report quickly identifies the most profitable of those combinations. Clicking on any row will reveal the entries for that trainer/jockey pairing whilst clicking on the entry will open the race in a new tab.
HINT: Look for a good sample size – ideally five or more – combined with a decent win percentage (30%+), and a positive figure in the profit columnand as ever, please refer to our User Guide for further information.
My own settings for the TJC Report look like this...
...and they have generated the following runners for me to check out...
...plus as ever, we have a list of fully functional 'free' racecards each day, which for Saturday cover...
1.30 Haydock
3.15 Haydock
3.50 Haydock
4.15 Sandown
4.37 Beverley
5.17 Leicester
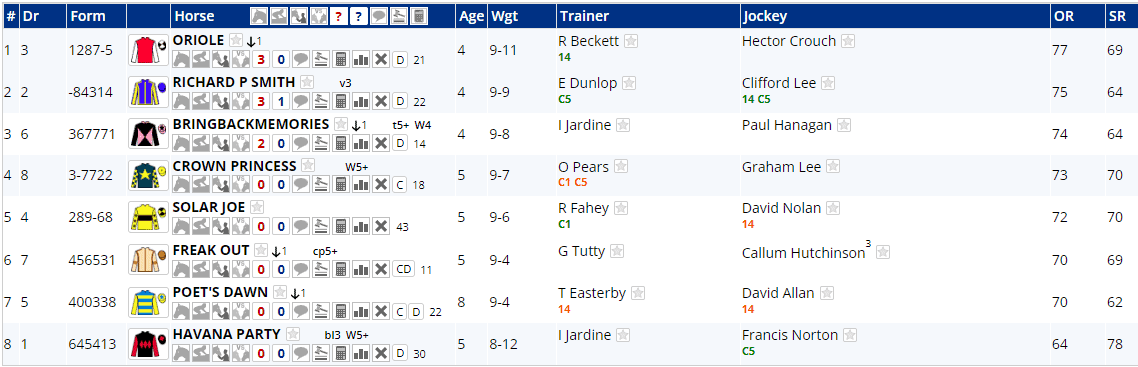
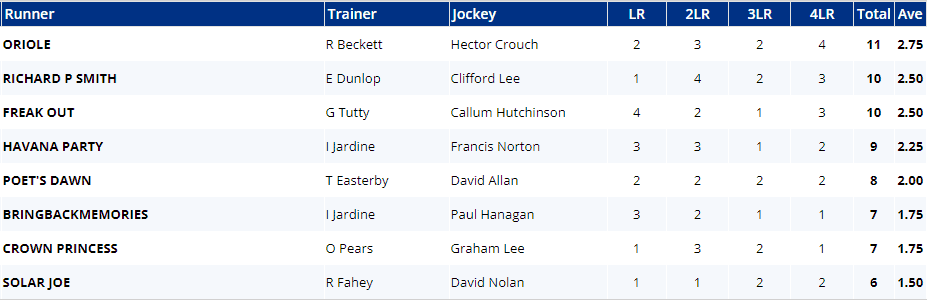
There are better races out there, but I do like to tie the daily feature in with the list of free races, so let's have a look at the 4yr old filly Oriole in the 4.37 Beverley, an 8-runner, Class 5, 4yo+ flat handicap over a right-handed 1m2f on good to firm ground...
Bringbackmemories and Freak Out both won last time out, whilst Richard P Smith and Havana Party both won their penultimate starts, but Crown Princess has failed to win any of her last ten. Top weight and featured horse, Oriole takes a drop in class here, as do Poet's Dawn and our LTO winners Bringbackmemories and Freak Out.
Solar Joe and Crown Princess are the only runners yet to win over a similar trip to this one, but the latter has at least won on this track albeit at 1m½f just over two years ago. The experienced Poet's Dawn has won four times over that 1m½f trip here at Beverley, as well as a win over 7½f, whilst Freak Out's LTO win was over this course and distance just 11 days ago.
He'll be the one with the least rest between runs, but all of these have raced in the last six weeks or so, meaning that none of them should be too rusty. Quite a few of this field have reasonable records under certain aspects of the forecasted conditions, but none have excelled and some have struggled, according to Instant Expert...
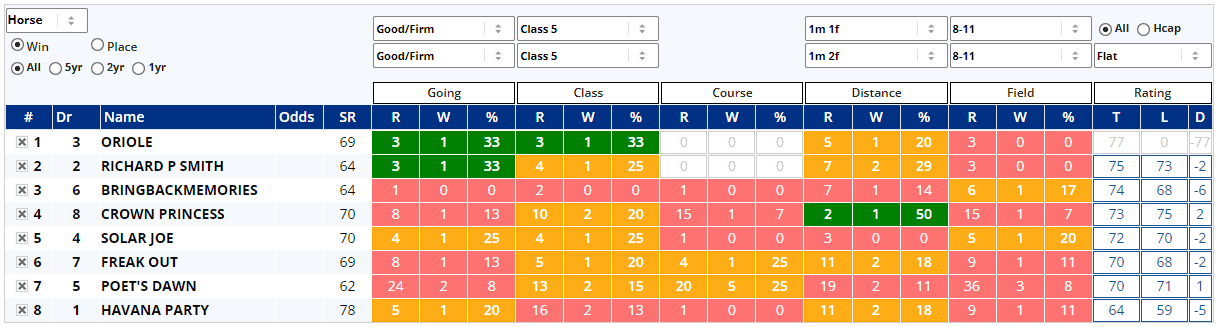
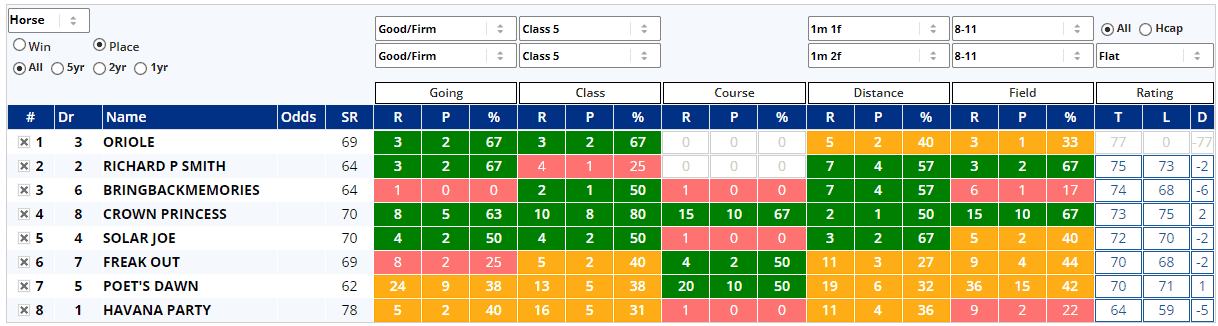
There's more negatives in the above than there are positives, but that's to be expected down at Class 5, but the main concerns surround Bringbackmemories (trip), Crown Princess (going/track), Freak Out (going), Poet's Dawn (going/trip) and Havana Party (class). Perhaps the place stats might show some of these in a better light...
That certainly puts the likes of Crown Princess in with a shout of making the frame and there's no real horror stories there, suggesting that any of these could grab a place in a contest that currently has no obvious winner. If we then turn to the draw, there's not a great deal in it, but the lower stalls have fared better than those drawn higher...
...but you'd have to expect that over 1m2f on quick ground that the draw bias could easily be undone and that race positioning aka pace will be of a greater importance, so let's see how those races above have unfolded...
Essentially the further forward a horse races, the more chance it has of winning/placing, therefore if we've any confirmed front runners around, they'd be the ones to focus on, but sadly that doesn't appear to be the case based on recent events...
There's not many of these wanting to take it on, so there's the chance of a falsely run race, but the top three on that list do at least have the ability to get on with things.
Summary
It's not a good standard of race, but it's certainly competitive. No odds available for this at 3.45pm on Friday, so I'll come back to this later on, but my thoughts are that the likes of Bringbackmemories and Freak Out who both won LTO should be involved with Crown Princess in with a shout of making the frame.
Apologies for a lack of Insights for Monday, I was at a surprise wedding on Sunday, but I'm back now and The Shortlist is Tuesday's free Geegeez GOLD feature and it's a simple (usually brief) report highlighting those horses with a largely ‘green’ profile in the Instant Expert Report each day and it covers win or place stats for both the current and the next day's racing.
GREENis good (33% or better win rate) – worth 3 points AMBERis quite good (16-32% win rate) – worth 1 point REDis not so good (0-15% win rate) – worth -1 points GREY means there is no available data for that factor - worth 0 points
The final column, ‘Score’, is the sum of the previous five ‘colour’ columns, with 15 being an all green profile, and 9 being the lowest score appearing on this report.
HINT: The best bets are not necessarily the highest scores. Rather, they are often the biggest difference between a Shortlist horse and the ‘best of the rest’ in that race.
N.B. Shortlist selections are unlikely to make a profit, at SP at least, to blind backing. Our recommendation has always been that The Shortlist should be a starting point rather than an end in itself. That said, it continues to highlight horses whose chance is better than recent form and its odds might imply.
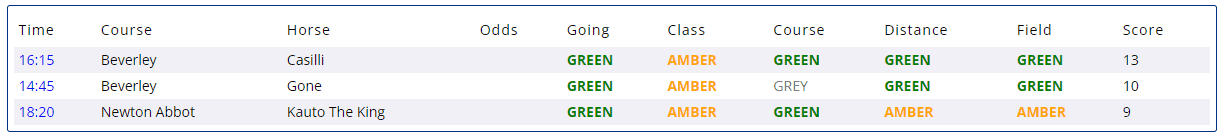
[Please refer to our User Guide for further information] and here is Tuesday's Shortlist...
...where Casilli would be of most initial obvious interest. As ever, the daily feature is complemented by a selection of fully functional racecards opened up to all readers and for Tuesday they cover the following...
5.20 Beverley
8.05 Newton Abbot
8.25 Newbury
8.40 Newton Abbot
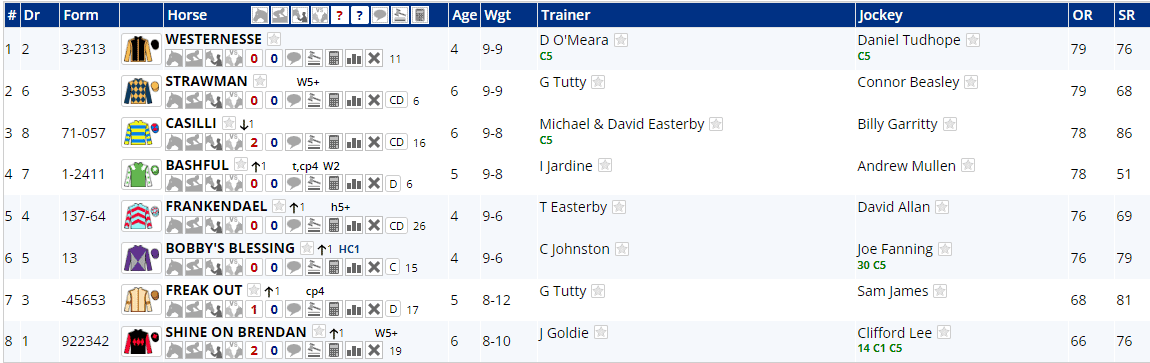
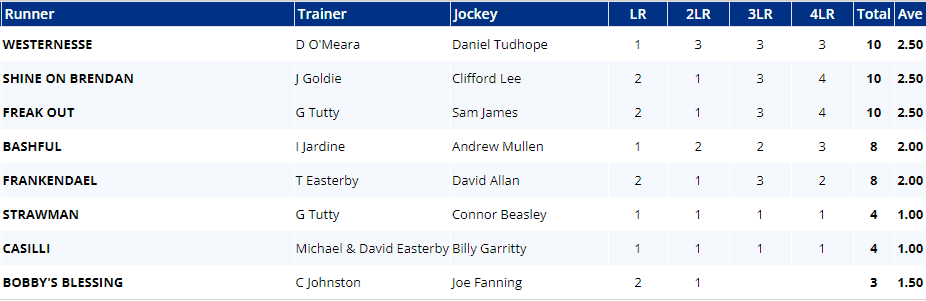
And I think I'll have a look at the 6yr old mare Casilli from The Shortlist. She's the sole female in the 4.15 Beverley, which is an 8-runner, Class 4, 4yo+ flat handicap over a right-handed 1m2f on good to firm ground...
Bashful is the form horse here, having won his last two, but only Strawman, Freak Out and Shine On Brendan are winless in at least five (9, 9 & 10 respectively to be precise) outings.
Joint top weights Westernesse and Strawman are the only two to have raced at this grade last time out, as featured runner Casilli now drops down from Class 3 with the remainder of the field all stepping up from Class 5. This will be Bobby's Blessing's handicap debut after just two starts over 7½f, including a win here on debut, but this is a big step up in trip.
Westernesse and Shine On Brendan have won at neither track nor trip, but Bashful and Freak Out are distance winners at Newcastle, whilst Strawman, Casilli (of course) and Frankendael are all former course and distance winners.
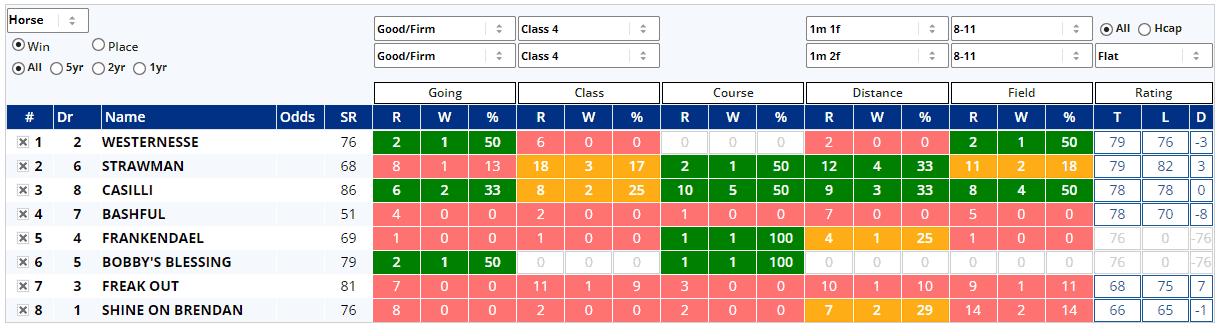
Strawman and Bashful both raced as recently as last Wednesday and the entire field have been out in the last four weeks, so there shouldn't be any rustiness on display. Instant Expert will, of course, show why Casilli is on The Shortlist, but it also tells us that half of the field have won on good to firm ground, just three have won at Class 4 on turf and that a couple of these have a really poor record at the trip...
So the concerns here are...
GOING : Strawman, Freak Out & Shine On Brendan
CLASS : Freak Out
DISTANCE : Bashful & Freak Out
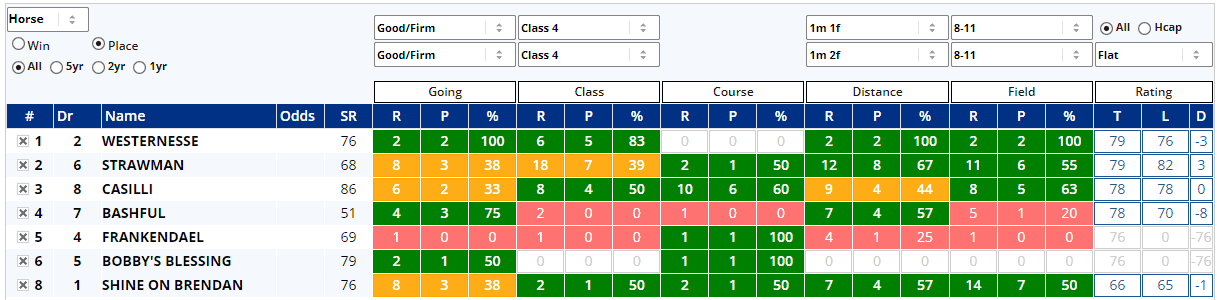
And before I even look at the place stats, I'm crossing Freak Out off the list! And having looked at the place stats...
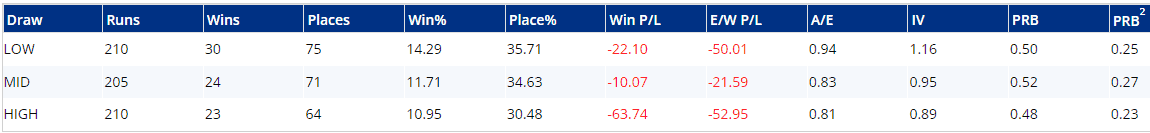
...I'm also ruling Frankendael out of my thoughts, leaving me with runners in stalls 1 and 2 plus 5 to 8 inclusive for a contest that has, in the past, favoured those drawn in the lower half of the draw...
...which wouldn't normally be great news for Casilli drawn widest in #8, but those races show that horses drawn higher than stall 7 have done pretty well too...
Our stats for these races say that pace is more of a deal breaker than the draw, though, with a clear sign that those willing to set the fractions ultimately get rewarded...
Prominent runners do better than average too, but any further back in the field makes life difficult, which won't be good news for the likes of Casilli if her last four runs are anything to go by...
However, here lies a problem, because they can't all run to a pace score of 2.50 or lower, one (or more) of them will have to set the tempo of the race and if they go at a dawdle, then those most used to coming from off the pace might well be the ones to side with.
Summary
The draw stats didn't really give me much help, whilst the pace data suggests the possibility of a falsely run race. However, I can see why Westernesse is the current 5/2 favourite. He does tend to race up with the pace (ignore LTO, he stumbled out of the stalls and was awkwardly away), he's got a good low draw and has eight top three finishes on the bounce.
Do I want to back him at 5/2? Not really, even though he's the likeliest winner in my eyes. To be honest, I'd want him to be a point (or more!) longer in the market, so I'll leave him alone. That, of course, doesn't mean that you have to. Bobby's Blessing is next best at a high of 7/2 and that also seems a bit skinny for a horse with just two runs under his belt and now up in trip by 2.5 furlongs, so I'll skip him too in favour of an 11/1 E/W bet with Skybet (10's elsewhere) on The Shortlist horse Casilli. Yeah, she's not in prime form, but her draw is fine, her hold-up approach might not be horrific in a pace-less contest and she's best suited by conditions. She was a little more than two lengths outside the placings here over course and distance last time out, but is now 2lbs and 1 class lower here and might well be the value option.
Tuesday's free offering from the GOLD service is the The Shortlist feature, a simple – and usually brief – report highlighting those horses with a largely ‘green’ profile in the Instant Expert Report each day. It covers win or place stats, and can be viewed for both today’s and tomorrow’s racing.
GREEN is good (33% or better win rate) – worth 3 points AMBER is quite good (16-32% win rate) – worth 1 point RED is not so good (0-15% win rate) – worth -1 points GREY means there is no available data for that factor - worth 0 points
The final column, ‘Score’, is the sum of the previous five ‘colour’ columns, with 15 being an all green profile, and 9 being the lowest score appearing on this report.
HINT: The best bets are not necessarily the highest scores. Rather, they are often the biggest difference between a Shortlist horse and the ‘best of the rest’ in that race.
N.B. Shortlist selections are unlikely to make a profit, at SP at least, to blind backing. Our recommendation is – and has always been – that The Shortlist should be a starting point rather than an end in itself. That said, it continues to highlight horses whose chance is better than recent form - and its odds - imply. As ever, please refer to our User Guide for further information!
And this how The Shortlist looks for this Tuesday...
...which, as you'd expect, is heavily Ascot-oriented. We do still also have our daily list of 'free' racecards, which are as follows...
2.20 Thirsk
2.55 Thirsk
3.40 Ascot
7.00 Brighton
7.15 Beverley
The 3.40 Ascot is on the 'free' list and is the second richest race of the day. It also features three runners from The Shortlist, but at 19-runners, it's not for me, even if SkyBet are paying 6 places! Instead, I'll take the last of the 'free' races, a decent standard sprint at one of my favourite tracks; the 7.15 Beverley is an 8-runner, Class 3, 3yo+ flat handicap over a straight 5f on good ground and here's how they'll line up for the "Beverley Speedy Handicap"...
No LTO winners here, but top weight Hiya Maite was third after winning his penultimate race, whilst Embour, California Gem and Manila Scouse have all won inside five runs and Embour is denoted as a fast finsher, ideal for this kind of contest! Only Spring Is Sprung and Ventura Flame are winless in seven (8 & 13 respectively if anyone's counting). All eight have at least one 5f win under thier belts and both California Gem and bottom weight Ventura Flame are former course and distance winners.
Only half of the field ran at Class 3 last time out; Spring Is Sprung was 4th of 14 at Class 2, beaten by a length at 33/1, whilst Manila Scouse (3rd of 7), Dandy Dinmont (5th of 9) and Ventura Flame (5th of 17 over C&D) all step up from Class 4 and it's hard to see any of that trio improving for a step up. Most of them do have the benefit of a recent run; half a dozen have raced in the last month, Calfornia Gem was seen six weeks ago, but Embour hasn't raced for nearly 16 weeks now and might well need the run.
Embour has, however, won three Class 2 contests on the Flat, according to Instant Expert, whilst under today's conditions, we see that he's the only previous Class 3 winner too. Just four of the field have won on good ground and in what looks a fairly modest set of numbers, California Gem probably makes most appeal...
Embour looks weak across the board, but is now 8lbs lower than his last win. Devil's Angel's numbers are steady, aside from being a Class 4 horse, Dandy Dinmont hasn't shone over the minimum trip and has fared little better (1 from 6) at 6f and is still 7lbs higher than his last win, whilst Ventura Flame has a good record on good to firm ground and also on soft/heayy, but has shown very little in between the two extremes! I'll consult the place stats, in case any of these have been 'unlucky' in their defeats...
...which does, in fairness, put some of these in a better light, but Spring Is Sprung isn't great over 5f and Ventura Flame still hasn't performed on good ground, but several of these are still in it, as we turn to draw and pace, where I suspect the emphasis will be on the latter over a straight 5f! Now, I wouldn't normally expect the draw to have too much of an influence over a straight five, but stalls 1 and 2 have done better than par here...
...albeit off a fairly small sample size. The 'perceived' (I remain to be persuaded) bias is less pronounced when it comes to making the frame, though and that data is possibly more reliable. I am, however, pretty confident that those races used for the draw data will tell me that the "Speedy Handicap" is likely to be won by a front runner, but I'm not always right, so let's check...
...and I think that's fairly conclusive. Leaders win most often, they place most often and they convert the highest percentage of places into wins, so we want a horse that'll be sharply away and based on the field's most recent efforts...
...the consistent Hiya Maite looks like he might well try to win this from the front. Embour was, of course, noted on the card as a fast finisher, but you'd have to be from where's he's going to be halfway!
Summary
Easy call for me here, as I'm with Hiya Maite. He's in good consistent (3 wins and 4 places from his last 8) form, runs off the same mark as a narrow defeat over 6f LTO when headed late on and looks like grabbing an easy lead here. he could prove difficult to peg back and at 7/2, there could still be a bit of value in the price.
As for the places, I don't like Embour, Dandy Dinmont nor Devil's Angel, but any two from the other four could get in here. None will be at what I'd want for an E/W bet, so I won't be backing them, but if pushed for one for the forecast etc, recent C&D winner Ventura Flame receives weight all round and might be the answer.
Now the 2019 Royal Ascot carnival is confined to history, my attention once again turns to finding some interesting insights on some of the UK’s less glitzy racecourses (which, in their defence, is all of them!), writes Jon Shenton.
Ascot may well be a full bodied, world-class (and expensive) Michelin star racing experience, but sometimes a hearty pub meal and a couple of pints hit the spot like nothing else.
So, clumsy metaphor out of the way, for this edition of punting angles, I’ll be focusing on the picturesque Yorkshire track of Beverley.
I enjoy this particular northern circuit. Fast and furious large field sprints spring to mind, as well as a large cast list of trainers, jockeys and owners which should lead to some reasonable angles and opportunities.
Let’s first take a look at the course map:
The diagram illustrates a couple of seemingly devilishly tight turns. There is also a stiff uphill finish, the little red triangle pointing upwards indicating the highest point on the course is shortly after the finishing post, the lowest point being diagonally opposite. Thus, the final two and a half furlongs are a gradual climb, testing stamina as well as speed over shorter distances. Horses competing at the 5-furlong trip face an uphill task literally almost every step of the way.
Beverley trainers
Before analysing specifics regarding race distance profiles, a customary evaluation of trainer performance is in order. My starting filter is that all races from 2012 are included, but only where the runner SP is 20/1 or shorter. 50 runners are required to qualify in the table.
To be perfectly honest there doesn’t appear to be too much on here to get overly excited about. The duo at the top of the table, plus potentially David O’Meara are probably the ones to focus on, if any.
Taking Richard Guest as an example, there is a definite point of interest from a punting perspective. The Wetherby based operation has had only one solitary winner where there has been a SP of between 11/1 and 20/1 as the numbers below display:
The 10/1 or shorter row is a clear indication that market support for a Guest representative is a significant factor in assessing the likely performance of a stable runner.
Not much more to say on that, in truth.
However, whilst I was evaluating runners at the skinny end of the market, I noticed something that I think is worth bringing to your attention. Step forward, Mrs Ann Duffield. Hers is a yard I haven’t really taken a great deal of notice of previously from a data perspective: despite being a regular on the circuit I’ve never established anything robust in stats terms relating to runners from this stable.
The table above displays Duffield runners at the track, segmenting them between fancied and less well fancied runners. The delta between the two is noteworthy: just two winners from 127 runners at 6/1 or greater with a painful A/E of 0.25, IV 0.26 and a bankrupting ROI of -61%. Compare this to a strike rate of 35%, 54% ROI and IV of 3.05 for the shorter-priced entries and it’s looks like it’s potential party time when Duffield horses are towards the top of the market.
We can go slightly further:
This table shows the 11/2 or shorter SP data by odds rank, i.e. the position of the horse in the market, 1 being favourite. It may be an arbitrary point, but it certainly appears as though there is a differential between the horses residing in the top two of the market and ones further down the pecking order.
I’ve earmarked an alert in my portfolio to track any Duffield shorty that is at the top 2 of the market at Beverley and is less than 11/2 in price.
I’m learning that this game is all about constant evolution, by nature I generally search for horses at the more speculative end of the market. However, the more data I crunch the more I’m learning to appreciate these sorts of shorter priced opportunities. They offer balance and, in a world of risk and reward, such angles can keep the wheels turning when the more ambitious plays are stuck in their inevitable ruts. At least in theory, anyway.
There are other trainers (Brian Ellison, Michael Bell to name but two) where market support appears to be of significance. The table below is for your reference and contains the Beverley A/E performance for each trainer for each odds bracket. To qualify, a minimum of 25 runners in the 6/1 or less category are required. These data hopefully show how I stumbled onto the Duffield angle. This approach will, I think, become a staple of how I evaluate trainer and market support in the future.
That’s enough about trainers, maybe a bit too much in fact! Turning the focus, now, to a couple of the specific race distances that the course hosts during the summer months.
Beverley Five Furlongs
Over the minimum trip of five furlongs, races start from a chute beyond the home turn at the bottom of the home straight. It is not around a bend as such, but there is a pronounced dogleg to the right at about halfway and a general curvature in that same direction for much of the trip. This ordinarily would point to a low draw bias, as the low stall numbers are situated towards the far rail, therefore offering the shortest route to the finishing post.
As a result, it would make sense that low draw numbers generally prevail in 5f contests at Beverley given that topology of the trip. The numbers confirm the theory.
Draw bias (IV) at Beverley for races at 5f by field size on Good to Firm, Good and Good to soft ground
Using IV for races with ground conditions of good to firm, good and good to soft, the above table certainly points towards a low draw as being the place to be; or perhaps more accurately a high draw is the place to avoid.
There seems to be an indication of a low draw becoming more advantageous as the number of runners increases. This certainly makes some sense, any advantage from the general curvature of the track from a low draw should increase as the physical distance in starting position becomes greater between the low and high wings.
There is always (or should be) a companion piece when analysing the draw, namely pace. We already know that early speed in a general advantage in these sharp sprint races from Dave Renham’s excellent series on early speed.
Again, Impact Value (IV, or how often something happens in relation to its peer group, where 1 is ‘normal’ and the further away from 1 is better or worse) is my weapon of choice. The visual below is an attempt at recreating the heat map within the draw analyser but for multiple field sizes in the same table. Its content again covers the more rank and file ground conditions from good to firm through to good to soft. [When the ground is soft or heavy, the draw bias at Beverley can reverse with runners often making a beeline for the near side running rail].
To my eye, early speed is important almost irrespective of stall position. It does reaffirm that the larger the volume of competitors the more challenging it is to prevail form a high draw. The big fat zero for Led, High Draw and a field size of 14+ relates to 10 runners, 0 wins and only 2 places. Not big numbers but a nil is a nil. More importantly, logic supports the notion that these runners are significantly inconvenienced by race conditions.
Prominent runners do remain competitive throughout, perhaps with a notable bias to the lower side of the draw in the medium and large fields. Horses with mid-division and held up run styles face both a literal and metaphorical uphill battle and a lot to overcome.
Of course, nothing is impossible, and any horse can win any race, as our editor is always reminding us! Even the red ‘danger zones’ in the table are generally populated with numbers above zero, meaning at least some winners are found even in these relatively hostile environments. It’s about playing the percentages, however, and hopefully by using data such as these, small incremental improvements can be attained to improve long term results.
Beverley 7.5-furlong races
I’m acutely aware that there is a danger of sounding like a broken record here. However, the adage of pace wins the race is seldom more apt than in relation to events over the 7.5-furlong distance at Beverley. The actual official distance is 7f and 96 yards so do bear that in mind as it can be advertised as a plain old seven. Those extra 90-something yards can be of critical importance, especially with the stiff uphill finish coming into play.
To get a feel for the track I find it’s a sensible idea to sit back, perhaps with a cold Peroni (or other suitable equally enjoyable beverage) and take in a few race replays. The course map shows those tight turns but by perusing visual evidence it’s much easier to comprehend and, ultimately, to bring data to life.
Even without the support of stats this trip has all the hallmarks of being a front runner’s playground. Happily, this can be checked using Query Tool to confirm the hypothesis or disprove it.
I’ve used QT in this case (as opposed to the pace analyser) as I want to compare our subject matter course with other tracks in the UK.
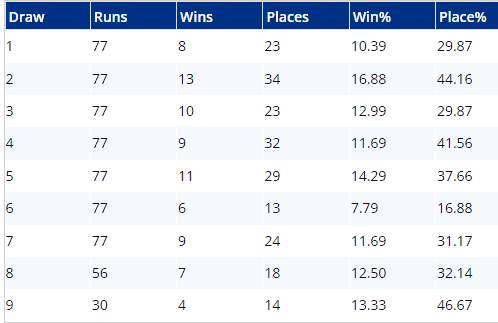
The table above contains data relating to the fate of front-running animals at a 7f trip (to the nearest furlong). The query filters are simply, all races from the 2014 season up to 7th June 2019, Distance 7f and a Pace Score of 4 for the runner to denote front running status; and I’ve sorted by win percent.
In the UK, only Chester has a bias towards pace greater than Beverley at this distance. It’s a great benchmark as we all know the benefit of early speed at the Roodee. For Beverley to be in the same ballpark is a pleasant and potentially useful surprise. The trailblazers have a very strong record with close to 30% maintaining their advantage at the line, 56% hitting the frame, a very high A/E of 1.61 and a super high IV of 2.68. That’s a rock-solid foundation to build upon.
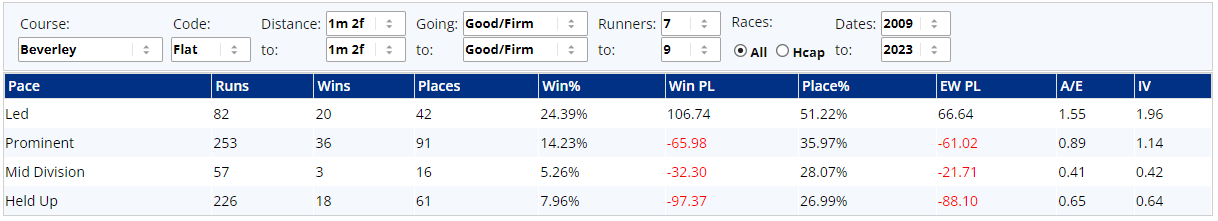
Expanding on this a little, the numbers in the green and red table below represent the overall pace profile of the 7f trips of the courses in question.
It’s very interesting to note that not only does Beverley have a confirmed and pronounced front running bias, a prominent running style also scores well in comparison to the other tracks.
In simple terms, it’s more important at Beverley to pick a horse with a prominent or pace-setting profile than virtually everywhere else (at this distance). Even if a horse doesn’t lead, the closer it is to the front of the pack the better.
The corollary of this is that hold up horses have a very moderate record over the course and distance (A/E 0.45), the poorest of all the listed tracks.
Field size is worth consideration when analysing front runners. It’s logical to assume (and an obvious point to make) that it’s easier to get a lead in a field of 4 than of 14 for example. The graph below shows the A/E performance of leaders at Beverley over the 7.5 furlongs range based on the number of competing horses.
I’ve excluded a handful of data in the graph related to races with 4, 15 and 16 runners across a total of 7 events, as it’s not helpful given sample sizes are extremely small.
The performance line tracks upwards, demonstrating that A/E improves as the number of runners increases. This works from a sense point of view as horses racing off the pace have a huge challenge to overcome, and simply, there is more of them in bigger fields. An abundant volume of runners means less racing room, so picking up and sweeping by the field is a big ask with a relatively short straight of only 2-and-a-half furlongs: advantage front runners. Importantly, with A/E being a measure of implied profitability, these data show that if you can consistently predict the front runner(s) in larger fields at this course and distance there will be due reward.
That’s all for this edition of Punting Angles. Hopefully there’s plenty to put to work in your own Beverley betting, and don’t forget that the tools here on geegeez.co.uk – especially Draw, Pace, and Query Tool – can give you this sort of leg up at any track you care to look into.
Please feel free to drop me a line with your suggestions, questions or comments. I’d love to hear from you.
geegeez.co.uk uses cookies to improve your experience. We assume that's OK, but you may opt-out from the settings. Cookie settingsACCEPT
Privacy & Cookies Policy
Privacy Overview
This website uses cookies to improve your experience while you navigate through the website. Out of these cookies, the cookies that are categorized as necessary are stored on your browser as they are essential for the working of basic functionalities of the website. We also use third-party cookies that help us analyze and understand how you use this website. These cookies will be stored in your browser only with your consent. You also have the option to opt-out of these cookies. But opting out of some of these cookies may have an effect on your browsing experience.
Necessary cookies are absolutely essential for the website to function properly. This category only includes cookies that ensures basic functionalities and security features of the website. These cookies do not store any personal information.
Any cookies that may not be particularly necessary for the website to function and is used specifically to collect user personal data via analytics, ads, other embedded contents are termed as non-necessary cookies. It is mandatory to procure user consent prior to running these cookies on your website.