As a horse racing researcher, there are good days and bad days, writes Dave Renham. On good days I research an idea and find that the data connected with it is interesting and robust enough to dissect and eventually use for an article. On bad days the idea or ideas I research seem to constantly hit a dead end, with the data crunched offering little or nothing of interest to me or potential readers of said research.
The second week in January was a week where I had a few bad days in a row. All my ideas were falling flat or at least after some digging offered up nothing of significant interest. However, just as I was binning yet another idea, I stumbled across some numbers that made me stop in my tracks. Had I eventually found something that had the potential for a worthwhile piece? About half an hour later after testing a few further theories, I felt I did, and hence I will be sharing my findings today.
Rationale
The data for this article has been taken from UK National Hunt racing covering the years 2019 to 2025. Any profits / losses quoted are calculated to Betfair Starting Price (BSP), with a 2% commission being applied on any winning bets.
For this article, I have been looking at the performance of horses that were ridden last time out by some of the top jockeys in the country. I have chosen the following – Nico de Boinville, Sean Bowen, Harry Cobden, Brian Hughes, Gavin Sheehan and Harry Skelton. These six have had some of the best win percentages of recent years as well as riding a decent number of horses each season, which means we have an excellent initial sample size from which to work.
My initial reasoning for why this angle might prove fruitful was that it is rare for any of these jockeys to ride a complete no-hoper and hence most horses they ride are expected to run well. Of course, there is no guarantee that the same jockey will be on board again next time, but whether they are or are not, one would assume if these horses were expected to run well once, they would be expected to run well next time too. I felt that my reasoning had some sound logic behind it; however, the proof is in the pudding and all that.
Overall: horses ridden by Super Six last time out (LTO)
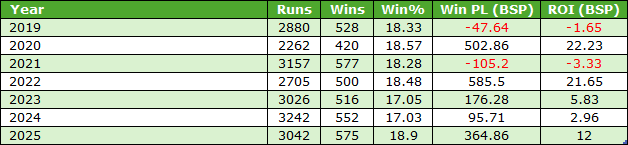
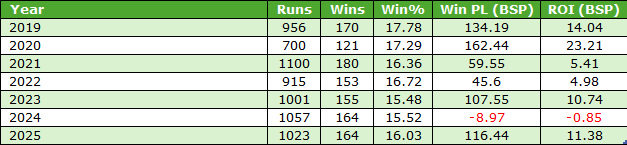
So, first things first, here are the results for all horses ridden LTO by one of my six jockeys in terms of their very next course outing:
This was an extremely solid – indeed, astounding – starting point producing a sound win rate, with returns edging towards 8 pence in the £. Splitting the results by year produced the following:
There have been five winning years out of seven, with the two losing years showing only smallish losses. Hence, this simple starting point has been fairly consistent.
Now these results include all possible BSP prices and as we know bottom lines can be massively skewed by big-priced winners. Unfortunately, this set of results does include such winners, with nine of the qualifying horses winning at a BSP of 100.0 or bigger. Backing all horses in triple figures over this timeframe would have yielded 60% of the initial £1572.30 profit figure. Hence, it made sense to ignore those bigger priced runners and focus on a subset of runners at shorter prices. Otherwise, one or more of those 100.0+ winners could be skewing some, or all, of the areas I wanted to explore. I decided therefore that a price limit of BSP 30.0 would be a much better and fairer option. Thus, the remainder of the article is restricted to horses that were priced BSP 30.0 or less.
Let me therefore look at the overall figures for this subset of runners with that BSP 30.0 price cap:
We have lost roughly 15% of the original qualifiers, but we are still left with a very good sample size, and although the returns are slightly less impressive, a blind profit of over 4p in the £ is still noteworthy.
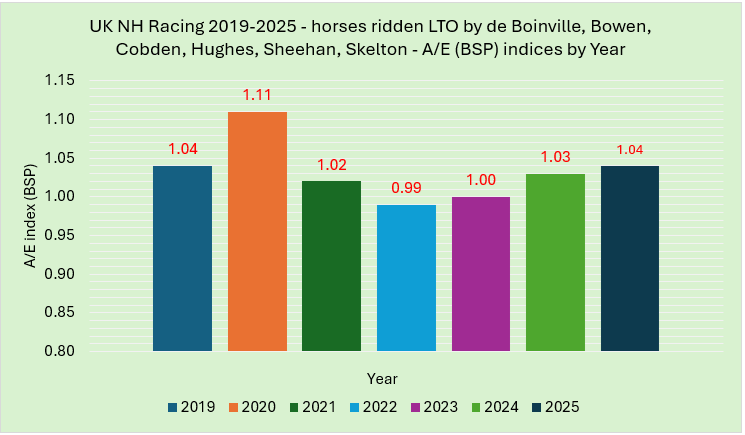
From this starting point, I wanted to dig deeper, so I began by looking at the yearly A/E indices. The indices presented below are based on BSP rather than ISP, as the exchange prices are more accurate:
As the graph shows, these horses have offered ‘value’ (A/E 1.00 or bigger) in six of the seven years. Five of the seven years proved to be profitable with the worst year (2022) losing a smidge over 2.5p in the £ across all runners.
Handicap vs non-handicaps
A look now at race type; specifically handicaps versus non handicaps. The splits were thus:
A much higher strike rate has been achieved in non-handicaps, but this is the norm as they tend to be less competitive. All the profits, though, have come from handicap races.
An additional statistic to note is if we restrict the handicap results to horses that had raced in a handicap LTO as well. This specific handicap-to-handicap group produced 9707 qualifiers of which 1693 won (SR 17.4%) for an impressive profit of £974.15 (ROI +10%).
Race Class
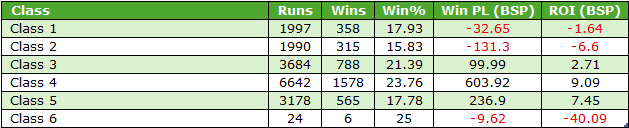
Let me next examine the Class of Race to see if anything could be gleaned from it. The splits were as follows:
We can safely ignore the Class 6 findings as there were only 24 qualifiers, and the stats indicate that Classes 3 to 5 have offered up the best returns. The more competitive levels of Class 1 and 2 both showed losses to BSP.
Last time out race position
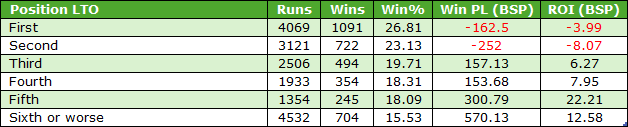
Onto position LTO now. Did that make a difference? Let’s take a look:
It is not surprising I guess that more than 7,000 of the c.17,500 qualifiers finished first or second LTO, as they were ridden by one of the ‘Super Six’; but a first or second finish last time was actually a negative when it came to next time out value. Conversely, horses that finished third or worse LTO combined to return over 11p in the £. It seems therefore, that this may be the group we should concentrate on in the future as those winners and almost winners last time are significantly over-bet.
Jockey change?
My next port of call was to examine the results where any of the six jockeys remained on the same horse next time out, compared with a jockey change which was not one of the six. Here were my findings:
The value lay clearly with horses ridden this time by a jockey who was not one of the six. Yes, the overall strike rate was lower but the bottom line was significantly better. Also, looking at the yearly splits for this cohort we see positive numbers in six of the seven years, and a negligible loss in the other one:
What I also found fascinating were the results when we examine the final possible jockey permutation – horses ridden by one of de Boinville, Bowen, Cobden, Hughes, Sheehan or Skelton last time and now ridden by a different jockey from the ‘Super Six’. In other words, a possible scenario being when Sean Bowen had ridden the horse last time, but Harry Cobden was on board this time; or Gavin Sheehan having been on board last time, being replaced by Brian Hughes this time, etc. Here are those findings:
These results have been extremely positive during the past seven years, so this looks like an avenue we could potentially explore in the future. One positive switch to mention is when Harry Cobden was riding a horse this time after being ridden by Sean Bowen LTO. This ‘combo’ saw 35 qualifiers of which 11 won (SR 31.4%) for a profit of £25.20 (ROI +72%).
[One such switch was when geegeez.co.uk syndicate horse Sure Touch won the 2024 Summer Plate under Cobden after Bowen was required to ride a horse for his father – Ed.]
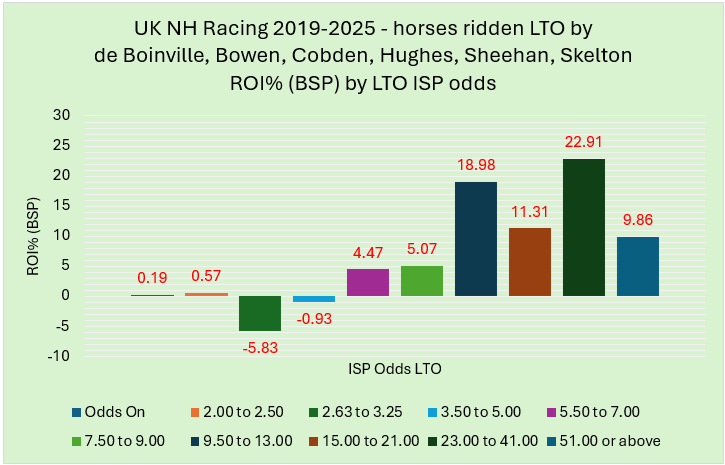
Odds Last Time Out
Moving on, one area I always like to look at where possible is the LTO odds of the horses in question. Below is a graph showing the ROI% splits for different bands of LTO odds – I have used ISP for the LTO odds as the prices are tidier:
This graph gives us a clear cut steer, with runners LTO that were priced 9.50 (17/2) or higher producing much better returns on their very next start compared with prices LTO of 9.00 (8/1) or less. For the record, horses that were priced 5.0 (4/1) or lower LTO combined to produce blind losses.
Age of horse
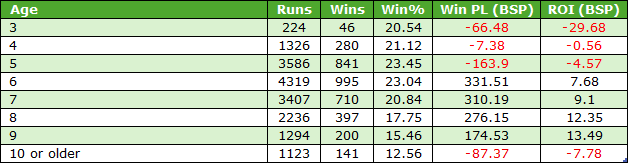
Finally for this article, I am going to share the age of horse splits, and these are shown in the table below:
As can be seen, 3yos had a poor record. The double-digit generation also struggled a little when compared with the best range, those aged six to nine. Why this group has done best is probably because National Hunt horses are in their prime between six and nine. Suffice to say horses aged six to nine have clearly offered the best value in the past few years when ridden LTO by one of the Super Six.
**
I must admit that the data shared in this piece are far better than I had expected when I embarked upon the research. It will be interesting to see if these generally positive results are replicated in 2026 and beyond.
Cian Collins believes Harry Cobden will suit dual Cheltenham Festival winner Jazzy Matty down to the ground in Wednesday’s Tote Galway Plate.
The versatile six-year-old won the Fred Winter for Gordon Elliott before changing hands for €50,000 in February 2024, winning minor races at Wexford and Sligo for new connections before landing the Grand Annual back at Cheltenham in March.
He arrives fresh having had a break since Punchestown and with regular riders Jordan Gainford and Danny Gilligan required by Elliott, Cobden steps in.
“We’ve given him a break since Punchestown, he’s in good form and we’re looking forward to running him,” said Collins.
“He’s versatile, he runs over hurdles and fences, he gets this trip (two miles and six furlongs) and it looks like he should get his favoured good ground, which is a help.
“When I knew that Danny and Jordan weren’t going to be available, his regular jockeys, I just thought Harry Cobden would suit him as he’s a good horseman with plenty of experience in those big handicaps.
“He’s a horse who thrives in big fields, they suit him. I do think he’s a better horse at Cheltenham than anywhere else, mind. Hopefully Galway is a little bit similar with it’s undulations and always on the turn with a stiff finish.
“We’re going there hopeful, he’s in good form so if he runs his race, I think he’ll be bang there.”
Gilligan rides Western Fold, with Gainford on Shecouldbeanything. Elliott’s other runners are Three Card Brag, Zanahiyr, Down Memory Lane, Chemical Energy and Duffle Coat.
Joseph O’Brien’s Nurburgring won the Galway Hurdle 12 months ago and will aim to emulate Dermot Weld’s Ansar by winning both feature races, while Noel Meade’s Jesse Evans, twice runner-up in the Hurdle, aims to go one better in the Plate.
https://www.geegeez.co.uk/wp-content/uploads/2025/07/2.79370703-scaled.jpg12802560Geegeez Newshttps://www.geegeez.co.uk/wp-content/uploads/2022/10/geegeez_banner_new_170x78.pngGeegeez News2025-07-29 12:45:242025-07-29 12:45:24Collins confident Cobden is the right fit for Jazzy Matty
Ballysax Hank completed a successful raid when partnered by Harry Cobden in the Unibet Summer Plate Handicap Chase at Market Rasen.
The Gavin Cromwell-trained six-year-old was one of a handful of Irish horses to travel over for the valuable summer feature, with Cobden taking the ride in his quest for a third successive triumph in the big handicap.
The duo started as the 9-4 favourite, though Ballysax Hank may have given his backers a few tense moments when making his rider’s job rather difficult with some fractious behaviour at the start.
The chestnut travelled at the rear and had plenty of horses to pass when he turned for home, but with plenty up his sleeve he was well able to pick them all off and score by an easy five lengths from Mickey Bowen’s Courtland and Nicky Henderson’s Bhaloo in third.
Explaining how the ride came about, Cobden said: “I was buying cattle and Keith Donoghue called me while I was in the ring at Salisbury.
“He said, ‘do you want to ride Ballysax Hank on Saturday?’, and I said, ‘yes, put me down on him’. Keith and Gavin were talking and they said I can ride the horse and it has worked out great.
“I was only hacking away for much of the race, but I knew as soon as I turned in it was all over. I just didn’t want to hit the front too soon.
“Gavin is brilliant. There was no real instructions and he doesn’t tie you down to anything. The horse was playing up at the start, and I didn’t want to get among the other horses.
“I was a bit further back than I should have been, but sometimes you have got to do what is right.
“He was very fit and ready for the day, although there was a second I thought I was coming off him (at the start), but he jumped well and was always in a nice rhythm.
“All us professional lads are paid to do a job and when you are on the horse’s back you have got to do what you think is right as opposed to what you are told to do.
“He crept into it really well and when asked he picked up. It is great how it has worked out and I’m delighted.”
This is the first in a new series of articles looking at the performance of some top National Hunt jockeys. In this initial offering I will be looking at Nico De Boinville and Harry Cobden. Both jockeys have the backing of huge stables with De Boinville riding primarily for Nicky Henderson and Cobden for Paul Nicholls.
I have analysed NH data for UK racing from 1st Jan 2016 to 31st Oct 2023. The main vehicle for my data gathering has been the Geegeez Query Tool, but I have also used the Geegeez Profiler. Hence all profits/losses quoted are to Industry SP, but I will quote Betfair SP where appropriate. All tables include A/E indices, an indicator of sustainable profitability. In addition, when data has been pulled from the Geegeez Profiler Tool, I have also shared the PRB (Percentage of Rivals Beaten) figures.
Let’s start with De Boinville.
Nico De Boinville: Overall Record
Let me first share De Boinville’s overall stats by looking at his performance on every single runner during the period of study:
This is a very solid set of figures – a win rate of more than one win in five, and an above average A/E index of 0.92 (the figure for all jockeys stands at 0.87). Losses of 11p in the £ to SP are also better than ‘average’ and if backing to BSP you would have made a small blind profit of £142.54 (ROI +5.5%). However, he has had a BSP winner at 130.0 which essentially is the reason for the + figure.
Nico De Boinville: Record by Year
Yearly stats are my next port of call. Here is a breakdown by both win, and win/placed (Each Way) percentage / Strike Rate (SR%):
As the graph indicates, De Boinville has been consistent in terms of yearly winners / placed efforts. There was a slight dip last year in 2022, but in 2023 he has won nigh on a quarter of all his races.
Nico De Boinville: Record by Betting Odds / Price (SP)
A look at the results by splitting them into different price bands:
The Evens and shorter group have performed above the norm, getting close to a break-even situation. These short-priced runners have done especially well in chases hitting a win rate of over 71%. The 7/4 to 5/2 group has edged into profit, so this price range has offered some value. However, I would not be confident that it will continue in subsequent seasons as the slightly inflated results are probably down to statistical variance.
Nico De Boinville: Record by Distance
A look at De Boinville’s record at different distances now. I have grouped them into four distance bands and to begin with I’m comparing win and each way strike rates:
This graph shows that the shorter the distance the better for De Boinville. If we look at the PRB figures (Percentage of Rivals Beaten) they correlate with the win/EW strike rates:
The 0.62 figure for the two mile or shorter races group is extremely impressive, as is the 2m1f to 2m2f group; less so the three miles or longer PRB figure of 0.48.
Nico De Boinville: Record by Race code
It is time to see if Nico’s record is better over the bigger obstacles, the smaller obstacles or on the level:
There are stronger figures across the board in hurdle races – a higher strike rate, better returns, and a higher A/E index. Backing all his mounts over hurdles to Betfair SP would have yielded a profit of £325.45 (ROI +21.1%), with six of the eight years producing a profit. Of course, a few big-priced winners have helped but hurdle races seem to be the races to concentrate on. Handicap hurdle races have produced the bigger profits to BSP but non-handicap hurdle races have also yielded a BSP profit.
Handicap chase results have proved to be poor by comparison. A strike rate of 13.2% has seen SP losses of 33p in the £; the BSP figures are not much better with losses standing at 27p in the £.
Nico De Boinville: Record by Racecourse
Below is a table displaying all courses where De Boinville has had at least 80 rides. The courses are listed alphabetically:
In general, the course strike rates are over 20% although Aintree and Cheltenham both dip below this mark. This is due to the competitive racing / bigger average field size you get at both tracks, and the A/E figures at those courses are actually top and third in the list. Uttoxeter results also come in at under 20% (15.65%) with a modest A/E index and PRB figure, so this looks a course to be a little wary of.
The Newbury figures are strong and are particularly impressive when focusing just on hurdle races. In these races at the Berkshire track, De Boinville has won 34 of his 116 starts (SR 29.3%) for an SP profit of £57.96 (ROI +50.0%). This profit almost doubles if backing to BSP standing at £106.62 (ROI +91.9%). However, don’t get too excited about the overall profits as a 50/1 winner (BSP 84.9) is almost solely responsible for the bottom line. Having said that, if you look at hurdlers at Newbury priced 2/1 or shorter, the record is very good (and profitable) – 22 wins from 38 (SR 57.9%) for an SP profit of £8.05 (ROI +21.2%); to BSP this edges up to +£10.33 (ROI +27.2%).
Nico De Boinville: Record by Trainer
Along with Nicky Henderson, only Ben Pauling has used De Boinville more than 100 times going back to the start of 2016. However, they have not joined forces at all in 2023, and only six times in 2022. Hence, I will simply focus on the combination with Henderson:
Let me compare these figures with his record with all other trainers combined:
There is a quite a difference as you can see. The strike rate for Henderson is more than double, and his runners have produced better returns, with both the A/E index and the PRB figures higher. Of course, this was perhaps to be expected as Henderson has a glut of quality horses.
There are a couple of Henderson / De Boinville stats I’d like to share:
Henderson is not a huge fan of horses returning to the track quickly, but the jockey/trainer combo has done well when a horse is returning off a short break of two weeks or less. There have been only 50 qualifiers, but 13 have won (SR 26%) showing a profit to SP of £25.08 (ROI +50.2%).
When De Boinville rides Henderson horses aged 3 or 4 the record reads 80 winners from 258 (SR 31%). Profits have been modest to SP (+£12.66, ROI +4.9%), but to BSP they look healthier at £56.53 (ROI +21.9%).
Nico De Boinville: Record by Class of Race
There are some interesting stats when looking at Graded / Listed races as the graph below of win strike rates show:
Grade 3 races, which in National Hunt are all handicaps, have provided a strike rate of just 1.1% - this is due to just one winner from 93 attempts. Of these 93 Grade 3 contestants, 39 of them were priced 8/1 or shorter. All 39 were beaten and only nine managed to place. 13 of the 39 were favourites, while 32 were in the top three of the betting.
In races of Class 2 or lower, De Boinville has hit win strike rates above 20% in three separate classes (Class 3, 4 and 5 events). He has only ridden in 41 Class 6 races, winning 6 (SR 14.6%), while in Class 2 events he is 46 from 299 (SR 15.4%).
Nico De Boinville: Record by Run style
Regular readers of my articles will know I am fan of sharing run style data. To begin with here is a breakdown of Nico’s run style performance in terms of win strike rate across ALL races:
Front runners (led) have edged it over prominent runners in terms of strike rate, both groups have secured a better than one-in-four win rate. If we examine the A/E figures we can see that they correlate with the SR%s as the following chart shows:
The led A/E index is decent at 1.05 which suggests these runners would have been value investments. Horses that raced mid-division or further back early would have offered punters poor value.
The two sets of run style data clearly show that when De Boinville is riding, a horse racing close to or up with the pace is what, as punters, we are hoping for.
Nico De Boinville: Additional stats
Before moving onto Harry Cobden, here are some extra stats for De Boinville that I feel are worth knowing:
His record in novice events is poor from an ROI perspective. Despite a strike rate around the 25% mark, in novice chases you would have lost over 24p in the £ to SP (19p in the 3 to BSP). In novice hurdle races the figures are similar with 25p in the £ losses to SP, 15p in the £ to BSP.
Horses priced 14/1 or bigger in novice events are 0 from 123.
De Boinville has secured a better strike rate on fillies and mares (22.8%) compared to their male counterparts (21.4%). The female runners would have also produced a blind profit to SP of £27.57 (ROI +5.6%); to BSP this increases to +£128.50 (ROI +26%).
Sticking with fillies and mares, when they have started Evens or shorter, 36 of the 45 have won securing an 80% strike rate. Returns have been positive, too, as one would expect – 31 pence in the £ at SP, 37p using BSP.
-------------
Harry Cobden: Overall Record
Let’s now shift our focus to Harry Cobden and start by looking at his record on all horses in all UK NH races:
These figures are remarkably similar to those for De Boinville. The strike rates are within 0.21 of a percentage point and the ROIs are both around the -11% mark.
Now it is time to break down these data, firstly by year.
Harry Cobden: Record by Year
Here is a graphical breakdown by both win, and win/placed (Each Way) percentage / Strike Rate (SR%):
As the graph shows, Cobden has managed a win strike rate of 20% or more in six of the eight years, with the other two years just missing out (18.5% and 19.5%). Likewise, seven of the eight years have seen each way (win & placed) strike rates hitting over 40%. Overall, his figures look very consistent.
Harry Cobden: Record by Betting Odds / Price (SP)
Let us see whether any market / price patterns can be found by breaking down Cobden’s results by Starting Price bands:
The shorter priced runners (first three rows in the table) have provided similar results to those for De Boinville. Horses priced Evens and shorter have effectively broken even, while the 7/4 to 5/2 have again snuck into profit. As a rule, Cobden’s price stats suggest that horses 5/2 or shorter look the ones to concentrate on.
Harry Cobden: Record by Distance
A dive next into Cobden’s record at different distances. I have grouped them into the same four distance bands I did earlier and am looking at the win and each way strike rates:
These are a more even set of stats than those for De Boinville, with only a slight drop in longer distance races (3 miles or more). If we look at the PRB figures we get the following splits:
A much more even grouping for Cobden than we saw for De Boinville. He seems to ride all distances well, especially distances of 2 miles or less.
Harry Cobden: Record by Race code
The next table illustrates Harry’s record by race code.
Chases and hurdle races offer similar looking stats, certainly as far as strike rate and ROI% is concerned.
The results in bumpers (NH Flat) are poorer when considering the whole-time frame, and losses have been steep at over 27% (27 pence in the £). However, 2022 and 2023 would have seen you break even thanks to a strike rate of just over 20%.
Harry Cobden: Record by Racecourse
I am now going to look at all courses where Cobden has had at least 80 rides. The courses are listed alphabetically:
Wincanton is the course that initially catches my eye. Not only has he ridden there more than anywhere else, but he has secured the best strike rate of all courses, too. A small profit to SP has also been achieved and the PRB figure of 0.68 is extremely high considering we are talking about over 300 rides. Not only that, but his record there has been very consistent hitting a strike rate of over 25% in each of the eight years. Hurdle races have provided the best results with 61 wins from 171 rides (SR 35.7%) for an SP profit of £40.86 (ROI +23.9%).
Taunton is another track with an excellent PRB of 0.68 – his rides at the course have seen a decent SR% again; this time 28.3%, but no blind profit. Like Wincanton, the hurdle results at the Somerset venue are the best with a 31% strike rate for a break-even scenario.
Other tracks where Cobden has done well include Newbury, Plumpton, and Worcester. Before moving on I will mention his record at Musselburgh. He has only had 24 rides there, but has been successful on 11 of them (SR 45.8%) for a profit of £13.21 (ROI +55%).
Harry Cobden: Record by Trainer
During the period of study, Cobden has had 100 plus rides for two trainers – Paul Nicholls and Colin Tizzard. Cobden had ridden over 600 times for Tizzard when that trainer passed the baton to his son Joe in April 2022. Hence, I will focus on his combination with Paul Nicholls:
He has secured a strike rate just above one win in four, but losses are slightly bigger than his overall P&L. For comparison purposes, here is his record with all other trainers combined:
As we can see the strike rate drops markedly to around one win in every six rides, but losses have been smaller. The PRB is lower, while the A/E index remains the same.
Harry Cobden: Record by Class of Race
When sharing Nico De Boinville’s stats earlier, it was shown that his record in Grade 3 contests was extremely poor. We see a similar situation when looking at Cobden’s results as the graph below shows:
Once again, the results for Grade 3 contests (remember, all of which are handicaps) are quite woeful, especially when we consider his overall record. It should also be noted that 39 of his rides in Grade 3 contests came from horses in the top three in the betting. Of these, just one prevailed.
Harry Cobden: Record by Run Style
Finally, in terms of main sections, let’s look at the run style splits in terms of win percentages:
This breakdown shows how effective Cobden is when taking the early lead. A strike rate of 35.3% is exceptional. If you had been able to predict pre-race which of his horses went into an early lead you would have secured an SP profit of £126.04 (ROI +16.2%). Conversely, backing all hold up horses would have seen huge losses of £472.71 (ROI -47.8%). As one would expect the A/E indices for his Run Style runners correlate with the win rates:
The clear takeaway here is that Cobden on a front runner is a potent combination.
Harry Cobden: Additional stats
Before concluding this piece here are some extra stats for Harry Cobden that are worth knowing:
Good to firm ground is relatively rare in NH racing but Cobden has scored 33.6% of the time when racing on this ground. He has won 45 races from 134 rides. A small 4p in the £ profit to SP would have been achieved if backing all such runners blind.
When Cobden rides a horse for a second time in their careers having won on them last time out, he has an excellent strike rate of 28.6%.
He has a modest record in maiden races in terms of returns. Losses of over 28p in the £ would have occurred if backing all qualifiers. If you exclude trainer Paul Nicholls from these figures the losses are even greater at over 40p in the £.
Main Takeaways
Below is a 'cut out and keep' table of the main takeaways from this research.
That’s all for this article – two jockeys for the price of one! I hope it has uncovered some angles that may prove useful for readers over the coming months.
- DR
https://www.geegeez.co.uk/wp-content/uploads/2022/12/ConstitutionHill_ChristmasHurdle2022.jpg319830Dave Renhamhttps://www.geegeez.co.uk/wp-content/uploads/2022/10/geegeez_banner_new_170x78.pngDave Renham2023-11-22 09:18:272023-11-22 09:20:10Jockey Profiles: de Boinville and Cobden
In this, and subsequent articles I am picking up the baton from Matt and Jon who have both previously written excellent pieces digging into the profiles of certain trainers, writes Dave Renham. As we are heading into the winter months it makes sense to throw the spotlight on some National Hunt trainers for this latest series. The first trainer I am going to look at is one of Britain's winter luminaries, Paul Nicholls.
I will be analysing nearly ten years of UK racing data from 1st January 2013 to 31st October 2022, the majority of which can be sourced by members using the Geegeez Query Tool. All profits / losses have been calculated to Industry Starting Price. Of course, we should be able to significantly improve upon the baseline figures of SP using the exchanges or BOG (Best Odds Guaranteed), and I will share Betfair SP data when appropriate.
Paul Nicholls Brief Biography
Born in Gloucestershire on April 17th 1962, Paul Frank Nicholls was educated at Marlwood School. He didn’t carry on into further education because, upon leaving school aged 16, he started working in a point-to-point yard. By the age of 20 he was race riding for Josh Gifford out of Findon, West Sussex, and then, in 1985, he moved to David Barons. His biggest successes as a jockey were back to back wins in the Hennessy Gold Cup (1986 & ’87) and, in his seven year career, he rode a relatively modest 133 winners. However, it is as a trainer that he has really excelled. Nicholls first took out his licence in 1991 but his training career took off in 1999 when he bagged three wins at the Cheltenham Festival, including the Gold Cup with See More Business. He was crowned Champion trainer for the first time in 2005-06 and, since then, has repeated this feat an amazing dozen further times.
Paul Nicholls Overall Performance Record
Below is Paul Nicholls' win record by calendar year:
Every year during the decade or so in review, his win strike rate has exceeded 20% which is impressive. Also, both his win and each way figures are consistent; both can be seen on the graph below:
Nicholls' overall win strike rate across the 10-year period stands at 23%; the each way SR at 43.2%. Breaking down into five-year groups really demonstrates his consistency:
Not surprisingly, though, given the Ditcheat handler's high profile, profits are hard to come by; and if you had backed all 5693 runners you would have lost roughly 12p in the £ to Industry SP. However, this improves to just under a 3p loss in the £ using BSP - not the worst way to lose a few quid with a high strike rate!
At this juncture it is worth mentioning Nicholls does send the occasional runner over to Ireland, but these are extremely rare. Indeed, just 29 runners have crossed the Irish Sea since 2013 with five winning and a further eight getting placed. Backing all his Irish runners would have seen a steep loss of 40p in the £.
It's time to dig a bit deeper.
Paul Nicholls Performance by Race Distance
When Matt dug into the Nicky Henderson numbers we saw a definite preference for shorter distances. What about his great rival Nicholls?
The distance distinction is not as pronounced as with the Henderson data but Team Nicholls do also seem to perform slightly worse in staying races, both from a win and returns perspective. The each way figures correlate, too, with 3 mile+ runners placing just over 36% of the time compared to the other two distance groups which stand at 46.3% (2m1f or less) and 44.8% (2m2f to 2m6f).
Paul Nicholls Performance in 3 mile+ Races
I want to dig into these 3 mile+ races in more detail as I think it is equally important to share negative angles as positive ones; avoiding poor value bets will clearly help our bottom line in the long run.
When we split these longer races into handicap and non-handicap races we get some very interesting results:
One might expect some difference in the win strike rates in favour of non-handicaps, due to quality biases and field size, but it is the returns that stand out. In non-handicap staying races, blanket support would have nudged into BSP profit; whereas in handicap races, losses of 31.58% (SP) are steep and, even using BSP, this only improved to a loss of 23.5% (23.5p in the £).
Here are the splits for 3m+ handicap chases and handicap hurdles:
Here we see similar win percentages, Impact Values and Actual vs Expected (A/E) indices; handicap chases have lost a little less money, but I would suggest these races are generally worth avoiding, unless you have a good additional reason to get involved.
Paul Nicholls Performance in Handicaps at 2m6f or less
Having seen some relatively poor stats for staying handicaps, let me share some more positive data.
As can be seen, Nicholls has recorded much higher strike rates, A/E and IV indices and, in the case of handicap hurdles, the smallest of profits even at starting price. At BSP, however, those profits would be just above the £200 mark to £1 level stakes – this equates to excellent returns of 22p in the £.
Despite this positive performance in handicap hurdle races of 2m6f or less, it is interesting to see the varying win strike rates at different courses. Below are all courses where Nicholls has had at least 40 runners:
There is quite a range here: one might expect lower strike rates at Ascot and Cheltenham due to the competitive nature of the races and, generally, races at these courses have bigger fields. Despite the low win rate, however, Nicholls has made an SP profit at Cheltenham in this context.
I want to share Nicholls' Taunton data specifically, as it is impressive: 18 wins from 71 runners, with a further 22 placed. Taunton SP profits stand at £27.47 (ROI +38.7%). BSP profits would have been increased considerably to +£47.29 (ROI +49.3%).
Paul Nicholls Performance in Non-handicap races
We have already seen that Nicholls has performed well in non-handicap races of 3 miles or further. Here are his overall non-handicap stats across different race types (all distances):
There are not many hunter chase runners per year (average around 13), but that cohort has made a small profit. However, the profit is hugely skewed due to two big-priced Cheltenham winners at 16/1 and 25/1.
His non-handicap chase figures (excluding hunter chases) also look very solid. Below I have broken down this record by age of horse – and it reveals a clear pattern:
There is a definite drop off in success rate in non-handicap chases as the horses hit the age of 8. Horses aged 7 or younger actually made a 3% profit to BSP; those 8 or older would have lost nearly 19% to BSP.
Sticking with these non-handicap chases (excluding hunter chases) and splitting the performance by starting price gives us the following breakdown:
Clearly horses priced between evens and 9/2 have offered punters good value in the past. The figures in the table above are to Industry SP; using Betfair SP one would have roughly doubled those profits. We can see very good A/E indices, too. In contrast, once starting prices get to 5/1 or bigger, there have been quite significant losses.
Paul Nicholls Performance by Starting Price
We have seen some SP data already, but let us now look at all races as a whole:
The win strike rates go down uniformly as the price bands increase – nothing unusual there. Industry SP losses have been smallest with the shorter priced runners, but the Betfair SP returns on investment are probably more useful to see.
Using Betfair SP sees a much more even return on investment across the price bands (ranging from a high of +1.6% to a low of -7.6%). In contrast to the Industry SP figures, it actually looks more advantageous to focus on runners priced 5/1 or bigger.
Paul Nicholls Performance by Course
I shared a small amount of course data earlier, but I want to dig a little deeper. I am going to look at all courses where Nicholls has had at least 100 runners and break the data down into different subsets. Firstly I am going to look at win strike rate and A/E indices across all races, hurdle races, and chases (again excluding hunter chases). With a ‘par’ A/E index for all trainers at around 0.87, I have highlighted A/E indices of 0.95 or higher (in green) – these are essentially positive. A/E indices of 0.79 or lower (in red) are negative:
There is a good sprinkling of positive A/E indices with not many negative ones; strong overall stats emerge for Fontwell, Newbury and Taunton.
Meanwhile, Haydock fascinates me; here, Nicholls' chase figures are exceptional, showing a 31p in the £ profit to SP, but his hurdle figures at the same course are dire, with a very low strike rate and losses in excess of a bruising 62p in the £. There are some things you just cannot explain!
Now a look at the same courses comparing handicap with non-handicap results using the same colour coding as before:
This time there is a more even split of positive and negative A/E indices. Fontwell and Newbury once again stand out, while Haydock again has hugely conflicting figures – excellent non-handicap results, dreadful handicap ones.
I have dug still deeper at different courses to share with you five positive looking PFN track stats:
At Fontwell in non-handicap chases (excluding hunter chases) the stable has secured 22 wins from 36 (SR 61.1%) for a profit of £9.73 (ROI +27.0%). Using BSP would increase profits marginally to £11.64 (ROI +32.3%);
At Haydock in non-handicap chases (excluding hunter chases) horses that started first or second favourite have bagged 10 wins from 16 (SR 62.5%) for a profit of £14.06 (ROI +87.9%). A slight increase again if using BSP with profits up slightly to £15.44 (ROI +96.5%);
In non-handicap novice hurdles at Wincanton, Nicholls has seen 67 of his 133 runners win securing a strike rate of 50.4%. Backing all runners would have yielded an SP profit of £30.09 (ROI +22.6%); BSP profits stand at £38.38 (ROI +28.9%);
At Taunton if you backed all his runners in hurdle races at 2m1f or less you would have been rewarded with 38 wins from 107 (SR 35.5%) for an SP profit of £19.51 (ROI +18.2%); BSP profits would have been double, at £38.78 (ROI +36.2%);
In handicap hurdle races at Musselburgh, Nicholls has sent only 22 runners on the long trek to such events but nine have won with a further five placing. Returns of over 90p in the £ were achieved to SP; to BSP this increases to 108p in the £. When Harry Cobden has ridden, he has managed five wins and two places from just eight runs.
Paul Nicholls Performance by Horse Run Style
As regular readers of mine will know, running style data is something I believe can often be an important piece of the betting puzzle. To begin with let us see the proportion of runners that fit a specific running style. Geegeez breaks running styles into four:
Led – front runners; horse or horses that take an early lead;
Prominent – horses that track the pace close behind the leader(s);
Mid Division – horses that race mid pack;
Held Up – horses that race at, or near the back of the field early.
Here are the splits for Nicholls:
We can see the marked preference for a prominent running style, tracking the early pace. That approach has accounted for over 40% of all runners from the stable. The other three run styles are each around the 20% mark.
From here, let us review the win success rate of each running style:
This is a very familiar pattern, with horses that go to the front and lead early (L) winning a far bigger proportion of races compared to other run styles. Front runners from the Nicholls stable are edging towards winning 40% of the time. Prominent racers also do well, hitting around one win in every four races; but horses that raced mid-pack or to the rear have relatively poor records.
I want to look at favourites now to see their success rate in terms of run style:
We see exactly the same pattern here with early leading favourites having an excellent record. By contrast, if you had backed every Nicholls favourite that ended up racing early in mid-division or at the back, you would have lost a whopping 33p in the £ to SP.
We have seen already that 19.61% of runners from the stable lead when we look at all races as a whole; but this figure differs markedly depending on the race type as the table below shows:
It seems therefore that non-handicap chases are the race types where we are most likely to see a Nicholls horse front run: out of trouble. However, it should be noted that the figures are skewed somewhat as non-handicaps (both hurdle and chase) tend to have slightly smaller average field sizes when compared to handicaps. To mitigate for that, I have chosen an arbitrary field size band so that we can more easily compare ‘led’ percentages across race types. I've selected races of 6 to 8 runners only to see what happens:
So in races of 6 to 8 runners we can see that non-handicaps are still much more likely to see a Nicholls runner at the front of the pack early compared to handicaps. The gap has narrowed but it is still significant. Perhaps the most interesting finding here is that front runners in National Hunt Flat races have increased considerably in these relatively small fields. There were 81 qualifying NH Flat races and Nicholls runners led early in 30 of them. Of these, a good proportion (43.3%) went onto to win.
This is a good time to mention that statistics can be really useful and informative but, naturally, it is important to see the bigger picture as possible. Sometimes stats in isolation can be a little misleading and we need context as much as possible.
Paul Nicholls Performance by Jockey
Onto some jockey analysis now. The table below shows all jockeys to have ridden at least 50 times for Nicholls since 2013, with the proviso that they have had at least one ride for the stable in 2022. I have ordered them by number of rides starting with the most:
Stable jockey Harry Cobden has a very good record on favourites scoring nearly 46% of the time for a break even scenario to SP (profit of 4p in the £ to BSP). However, the stand out here is Bryony Frost – a strike rate of around one win in every four and a profit to boot. If betting every runner of hers at BSP the profits would have risen to £113.87 (ROI +26.8%).
She has done especially well in non-handicap chases thanks to 28 wins from 65 runners (SR 43.1%) for an SP profit of £55.11 (ROI +84.8%). At BSP these returns increase by a few pence to 92p in the £.
Here are three more Frost / Nicholls stats to be aware of:
Their combined record at Ascot, Cheltenham and Kempton is impressive considering the competitive nature of the races at these tracks:
When Frost has taken an early lead, she has won on over of 40% those runners. On hold up horses, though, she has won less than 10% of the time (SR 9.3%);
Frost has an excellent record on horses she has ridden before. 68 winners from 245 rides (SR 27.8%) for a profit to SP of £87.53 (ROI +35.7%); profit to BSP of £127.01 (ROI +51.8%).
Frost is back in the saddle after a lengthy spell on the side lines so hopefully she will continue her success for Nicholls during the remainder of this season and beyond.
Paul Nicholls – Extra stats and nuggets
With the main body of the article complete let me just share with you some extra stats or nuggets that may be of interest:
Nicholls' longest losing run over the ten seasons stands at 29. He has had 29 losers in a row on five separate occasions
He has saddled back to back winners (e.g. one horse winning and then his next runner winning also) on 340 separate occasions
There are punters around who occasionally back their favourite trainer or favourite jockey and put their selections in doubles, trebles etc. Hence I thought I would look at what would have happened if you had backed all Paul Nicholls runners in trebles on the days when he had exactly three runners. He has had exactly three runners running on the same day 212 times; the treble would have been landed seven times. However, due to the fact that most prices were quite short, if you had placed a £1 win treble on all 212 days you would have lost £96.59 (ROI -45.6%). Even worse would have occurred on days where he had exactly four runners – if you had backed all four runners in a win fourfold accumulator on each of those days, you would have landed a winning bet just once, losing a whopping £136.09 (ROI -76.9%). I am not saying punters cannot be successful with these types of bets, but the odds are generally stacked against us
Just over 400 horses have run at least five times for Nicholls – of these horses 85% of them have won at least one race
In handicaps the time to catch Nicholls runners is when they have had five or fewer previous runs in a handicap. This cohort has combined to win 291 of their 1624 races. Backing them at BSP would have secured a healthy profit of £243.35 (ROI +15.0%)
Paul Nicholls – Main Takeaways
Below is a summary of the key findings from my research above. It's a handy 'cut out and keep cheat sheet' for those who like such things.
Every year Nicholls has secured an overall win strike rate of over 20%
Distance wise, Nicholls has a relatively poor record in handicap races of 3 miles or more
Handicap hurdle races at 2m 6f or less have seen impressive returns to BSP of 22p in the £
In non-handicap chases (excluding hunter chases), horses aged 7 or younger have produced a small 3p in the £ profit to BSP
Several course stats have been highlighted; three of the strongest being in handicap hurdles at Musselburgh, non-handicap chases at Fontwell, and non-handicap novice hurdles at Wincanton
Over 40% of PFN runners take a prominent position early, of which just over 25% go onto win. His best run style performance comes with front runners / early leaders: they have won 38.5% of their races
Bryony Frost has a good overall record and she has excelled in non-handicap chases
Look for horses in handicaps who have previously had five or fewer handicap runs
Paul Nicholls is an incredibly successful trainer and this article has unlocked a few angles that have proved to be positive in the past. Hopefully they will continue that way for at least some time in the future, too! Also there some negatives that we need to be aware of.
I hope you have enjoyed this piece and I’ll be back next week with a drill down into the stats of another National Hunt trainer, Mr Daniel Skelton.
- DR
https://www.geegeez.co.uk/wp-content/uploads/2022/11/Frodon_BadgerBeer.jpg319830Dave Renhamhttps://www.geegeez.co.uk/wp-content/uploads/2022/10/geegeez_banner_new_170x78.pngDave Renham2022-11-22 09:30:272022-12-07 09:52:17Trainer Profiles: Paul Nicholls
geegeez.co.uk uses cookies to improve your experience. We assume that's OK, but you may opt-out from the settings. Cookie settingsACCEPT
Privacy & Cookies Policy
Privacy Overview
This website uses cookies to improve your experience while you navigate through the website. Out of these cookies, the cookies that are categorized as necessary are stored on your browser as they are essential for the working of basic functionalities of the website. We also use third-party cookies that help us analyze and understand how you use this website. These cookies will be stored in your browser only with your consent. You also have the option to opt-out of these cookies. But opting out of some of these cookies may have an effect on your browsing experience.
Necessary cookies are absolutely essential for the website to function properly. This category only includes cookies that ensures basic functionalities and security features of the website. These cookies do not store any personal information.
Any cookies that may not be particularly necessary for the website to function and is used specifically to collect user personal data via analytics, ads, other embedded contents are termed as non-necessary cookies. It is mandatory to procure user consent prior to running these cookies on your website.