
An in depth look at draw bias over 5 furlongs
I must admit that this is my favourite time of the year for two reasons, writes Dave Renham. Firstly, I am starting to think about the sunnier and warmer weather to come in the next few months; and secondly, the flat turf season is now upon us.
From a betting perspective I prefer the flat because traditionally I have had a better betting record in flat racing compared to National Hunt. The flat also has a special place in my heart because the first book I published was a flat racing one. That book was about draw bias and back then, in the late nineties, draw bias offered astute punters a real edge. Nowadays that edge has diminished somewhat.
Primarily, that is because there are fewer biases due to either better course management or rail movements, or indeed both. Also, draw information is more accessible these days so it can be difficult to find an angle that is not widely understood. However, having said that, up to date accurate bias data is still important because biases are constantly evolving; we must not blindly stick to what we have known in the past.
Introduction
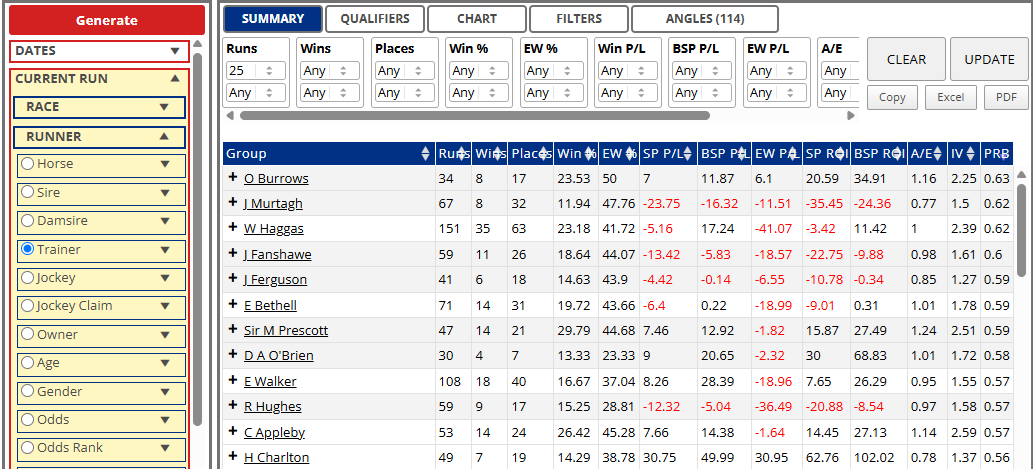
One of the beauties of Geegeez is that we have the Draw Analyser tool which means we can check all course and distance combinations in terms of recent draw bias changes. In this article, then, I will share the most up to date draw bias information for UK racecourses over the 5-furlong distance, concentrating on those tracks where the statistics seem to indicate there has been a recent advantage to one part of the track or another. Data have been taken from 2021 to 2025 with the focus being handicap races as they give us more reliable draw data. I am also ignoring races with very small fields so only including those with seven runners or more.
When analysing each individual race, I have split the draw into ‘thirds’ - those drawn in the bottom third (low), those drawn in the middle third, and those drawn in the top third (high). It should also be noted that the draw positions are adjusted when there are non-runners – for example if the horse drawn 3 is a non-runner, then the horse drawn 4 becomes drawn 3, draw 5 becomes 4 and so on.
On a completely fair course the winning percentages for each "third" of the draw should be around 33% each. The differences in the percentages will help to determine the strength of the bias. I’m also going to share the PRBs (Percentage of Rivals Beaten) when there seems to be a potential bias to help give us a more accurate overall view.
In my experience, I consider there to be two types of draw bias. One is a clear bias towards a specific section of the draw; this is the strongest possible bias. The other is a bias against a specific section of the draw.

I will work through the qualifying courses in alphabetical order.
Ascot 5f
The round course at Ascot sees horses run right-handed so on the straight course where 5f races are run, the highest stall is drawn closest to the nearside stands’ rail. There have been 40 qualifying races, and the draw third splits have been as follows:
![]()
Low draws seem to have struggled a little in terms of wins over the past five years. That is at least partially because the centre of the course tends to ride a little slower than the ground closer to the stands rail. A look at the PRBs now:
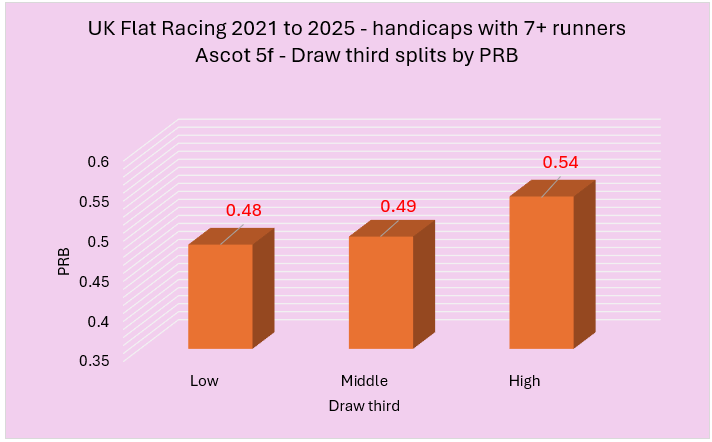
The PRBs suggest that higher draws have an edge. My own experience is that lower draws have indeed been at a disadvantage, and the highest draws have a very slight edge over the middle. However, biases can change at Ascot throughout the year, so we need to keep an eye on developments.
Ayr 5f
To the west coast of Scotland now and Ayr's five-furlong strip. Like Ascot there have been 40 qualifying races over the past five years. The draw splits in terms of wins are as follows:
![]()
High draws have really struggled from a win perspective. Let me share the PRB splits:
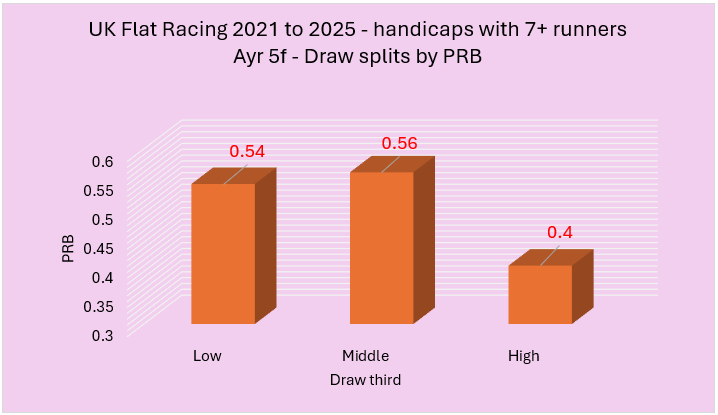
The PRBs correlate extremely well with the win third percentages, corroborating that high has been at a considerable disadvantage over this 5f trip in recent years.
Bath 5f
Bath has two 5f distances, and we are concentrating on the shorter of the two - the bare minimum. This C&D has plenty of races annually and in the past five years there have been 57 qualifying contests in total.
![]()
Horses drawn low seem to have enjoyed a solid advantage, winning twice as many races as those drawn high. Will the PRBs correlate? Let’s see:

The PRBs also indicate that lower draws have enjoyed quite a decent edge. If we had backed every single low drawn runner blind over the past five years we would have secured a BSP profit of £85.53 (ROI +51.5%).
Beverley 5f
Thirty years ago, Beverley over 5f had one of the strongest draw biases in the country. That is no longer the case, but it is still perceived that horses near to the far rail (low) retain a slight edge.
![]()
There have been 99 qualifying races over the past five seasons - an excellent sample size - and low draws have enjoyed a small edge in terms of wins. High draws continued to get the worst of it. The PRB figures suggest that the bias is a little stronger than the raw win third percentages suggest, and largely against high:
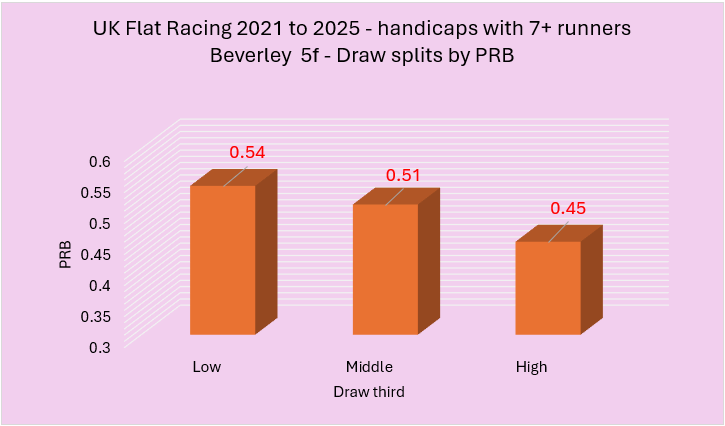
It is well worth noting that 28 of the 99 races have been won by one of the two lowest drawn horses. Moreover, horses drawn 11 or higher have really struggled, winning just five races from 98 with losses equating to 57p in the £.
Catterick 5f
There have been plenty of qualifying sprints at Catterick – 83 to be precise, and the breakdown was thus:
![]()
Based on the win stats, middle draws seem to have been at a slight disadvantage. This is also reflected in the PRB figures:
![]()
The key, though, to Catterick is the ground. On better ground lower draws have an edge; on softer ground that reverses and high draws often prevail, as when there has been plenty of rain the near side rail seems to possess the fastest strip of ground.
On good or firmer ground 19 of the 42 races have been won by horses drawn in the lowest third (45.2%), and their PRB has been clearly best at 0.55 (middle was 0.46, high 0.49). There have been 21 races on soft or heavy of which the top third have won 10 (47.6%). The PRB figure for the top third of the draw was 0.54.
Chepstow 5f
Over to Chepstow now starting with the win strike rates:
![]()
The numbers suggest that higher draws may have a small edge. Do the PRBs correlate?
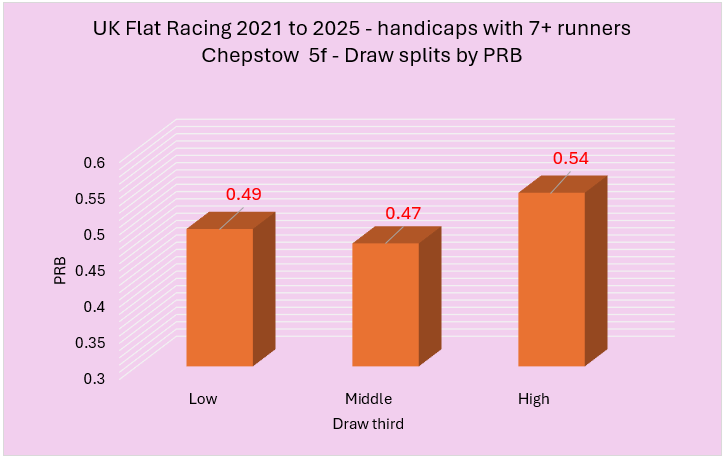
The PRBs back up the likelihood that there is a small advantage to being drawn high. This has been especially true on good or firmer ground as 17 of the 32 races (53.1%) were won by horses drawn high, with a PRB of 0.55. Overall, if given the choice, one would prefer to be drawn higher than lower, especially on better ground.
Chester 5f (& 5½f)
Chester has traditionally had one of the strongest sprint biases in the country. However, in recent years, with the introduction at some meetings of a false rail at the top of the short home straight, the bias has been less potent and the strike rates back that up.
![]()
High draws still struggle a lot, but middle draws have been almost as successful from a win perspective as low draws over the past five years. The reason for this is almost certainly due to course officials moving the inside rail for some races. In fact, two thirds of these races saw rail movement of some distance or another.
The PRBs correlate well with the win stats:
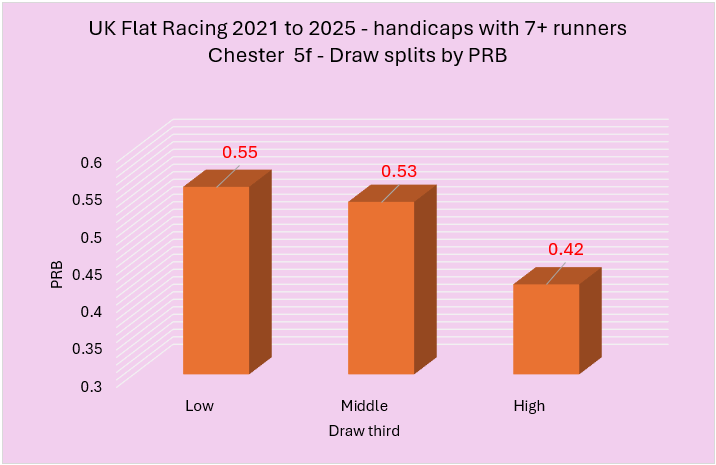
In the past five years, the value has been with those drawn in the middle. Backing all middle draws ‘blind’ would have produced a small profit to BSP of £13.67 which equates to 10p in the £. The middle third A/E index also stood at a healthy 1.13 indicating good value.
This is an example of what I discussed earlier: that we need to be aware of recent changes and not assume a historical draw bias remains as strong as it was previously. I suspect that the market is yet to fully adjust to these changes so, for the foreseeable future, middle drawn runners should continue to offer the best value.
Goodwood 5f
Down to the South coast next and my favourite track from which to watch racing. There have been 30 qualifying races over the past five years which is one of our smaller samples. The win percentages for each third were as follows:
![]()
17 of the 30 races were won by horses berthed in the lowest third of the draw. Based on this alone the bias looks strong. Let’s see what the PRBs have shown:
![]()
This is one of the reasons it is always good to focus on more than one statistic, especially with smaller sample sizes, as we should reasonably have expected a PRB of around 0.57 or 0.58 for the low third based on the win stats. Here, we have 30 races and hence only 30 winners – a relatively small sample. However, the PRB figures give some sort of score to all 310 runners – providing a much broader, and potentially more accurate, set of numbers.
So where does that leave us with Goodwood’s 5f trip? Well, I think low drawn runners do have an edge. The ground tends to ride quicker in the centre to far side than it does near side where the high drawn runners are positioned. Also, there have been some clear examples of low draw bias in certain races – one such being the Buccellati handicap run at the Goodwood Festival meeting on 1st August 2024. The first five home were:
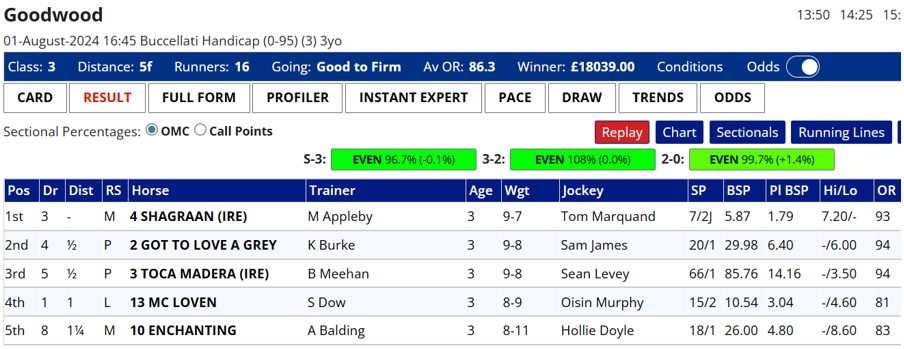
As can be seen, in this 16-runner race, low draws dominated the finish with four of the lowest five draws occupying the first four finishing positions. The trifecta paid nigh on £3,600 for £1.
Overall, I’d take low over high again this year.
Musselburgh 5f
Back into Scotland and to the Edinburgh shores for Musselburgh's minimum. There have been 102 qualifying races over the past five years. The win percentage breakdown for each third of the draw was as follows:
![]()
Horses drawn high have been virtually twice as successful as those drawn low from a win perspective. High draws are located close to the nearside stands’ rail, so it seems the ground has generally been riding quicker nearer to that rail than out in the centre if the win stats paint a fair picture. There is also a slight dogleg on the straight which kinks away from the lower drawn horses on the flank.
Let us see if we get better correlation with the PRBs than we did with Goodwood given to the much larger 102-race sample:
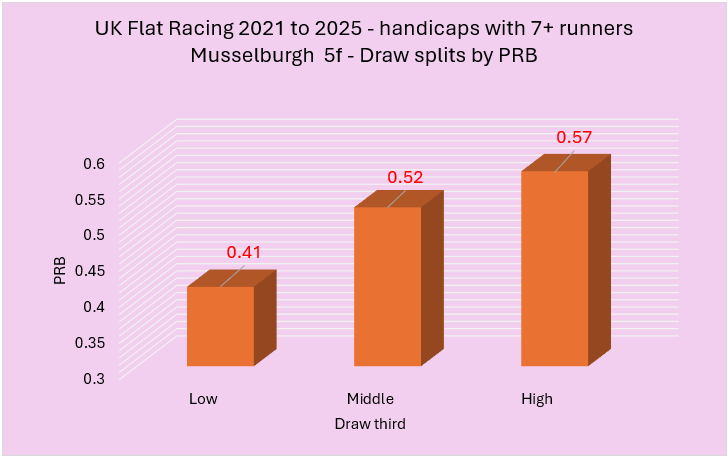
The PRBs correlate strongly with the win figures and, therefore, it seems that there has been a decent high draw rail bias in play over the past five years. This result from early last season is a good example of this:
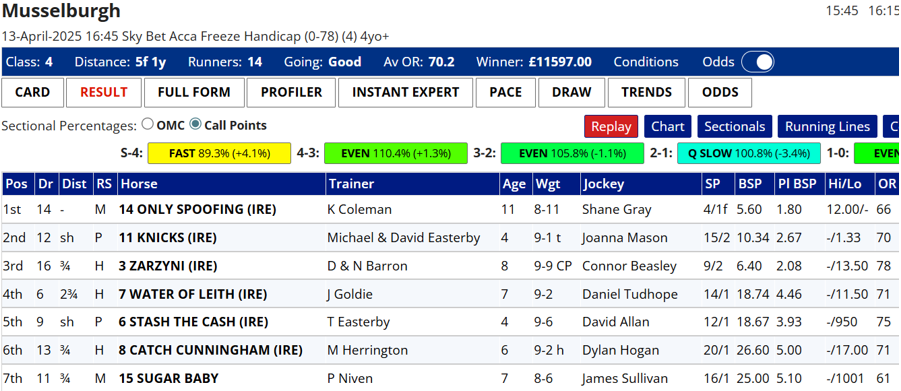
High draws dominated this one with those drawn one to five nowhere to be seen. Ideally, then, any horse we feel has a strong chance here should be drawn high.
Pontefract 5f
Pontefract next. With the 5f track turning left one would assume lower draws might have some sort of edge. The splits for the 46 races were thus:
![]()
There definitely seems to have been an advantage to horses drawn low and hence near the inside rail. Let’s look at the PRBs:
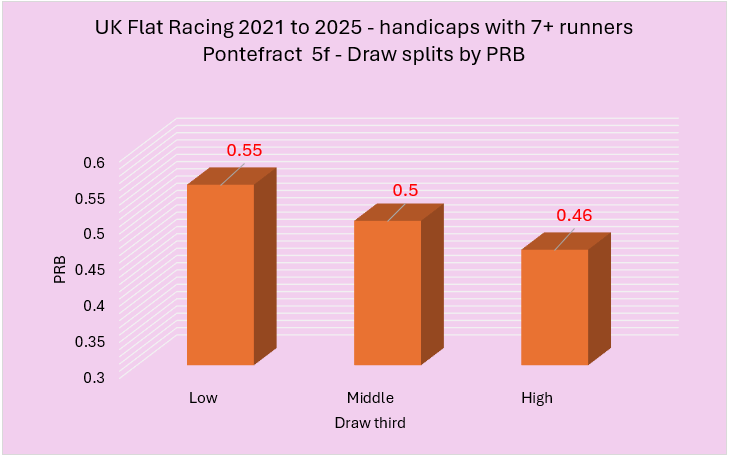
The PRBs confirm that lower draws have indeed held sway. It is also worth noting that horses drawn right on the inside (stall one) have won 10 of the 46 races showing a BSP profit of £30.15 (ROI +65.5%). Very high drawn runners, those exiting stall 11 or higher, have really struggled with 0 wins from 26 and only one of those 26 making the frame.
Redcar 5f
There have been 49 qualifying races over the minimum trip at Redcar with the following win strike rates by draw third:
![]()
Nearly half of the races have been won by horses drawn in the lowest third. Let’s look at the PRBs to see if they corroborate this possible low draw bias:
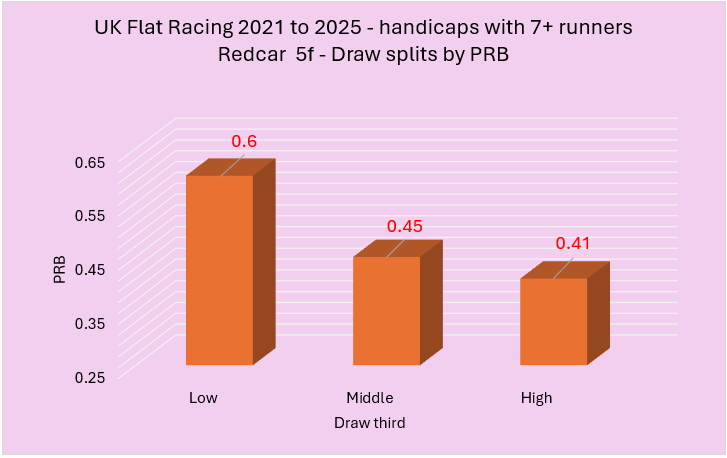
These figures confirm we have one of the strongest biases seen to date. 21 of the 49 races were won by one of the two lowest drawn horses. Backing both stall 1 and stall 2 ‘blind’ would have secured similar returns for each at around 60p in the £. My advice: keep an eye out for 5f handicaps here as the draw might help us find some value selections.
Ripon 5f
46 races to analyse at Ripon with the following splits:
![]()
A strong edge it seems for middle draws which is surprising considering how horses tend to gravitate to the near rail (high). Do the PRBs show a similar pattern?

![]()
The PRB figures back up the win stats to some extent, although with a 50%-win rate I would have expected a higher PRB for the middle third. This course and distance is a tricky one for me; I am not convinced there is a strong bias here, even though the stats point to middle draws having the edge. Maybe the ground a few horse widths away from the rail rides slightly quicker. Not sure.
Thirsk 5f
Back in the 80s and 90s the Thirsk high draw rail bias was as strong as any in the country. That is not the case any more, but do higher draws retain an edge? Here is what the 60 race sample threw up:
![]()
High draws have performed best, albeit not by much. Lower draws, however, have really struggled from a win perspective. Onto the PRBs:
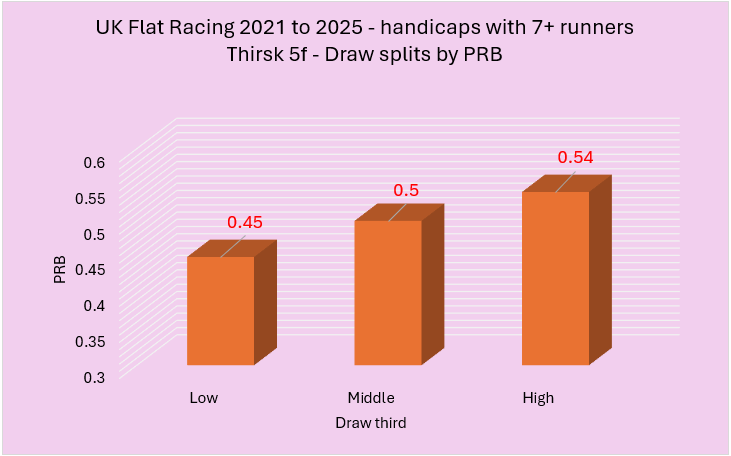
These figures suggest the high draw edge is slightly stronger than the win stats implied. They do also confirm that lower draws have been at a disadvantage. One more nugget to share is that on good to soft or softer ground the PRB for the lowest third was just 0.41. It seems the bias against lower draws strengthens as the ground eases.
Yarmouth 5f
42 races at Yarmouth to dissect now; firstly, with the win splits:
![]()
Lower draws may have a slight edge based on these figures, and the PRBs confirm that there has been a bias in play over of the past five years:
![]()
0.56 for low draws is a solid number. It seems that if betting at Yarmouth over five this year, we should definitely prefer to be drawn lower than higher.
York 5f
Finally, we come to York. There were 58 races with 7+ runners on the Knavesmire over the past five seasons with the following breakdown:
![]()
The lowest third of the draw has accounted for half of the winners. Do the PRBs correlate positively with the above numbers?
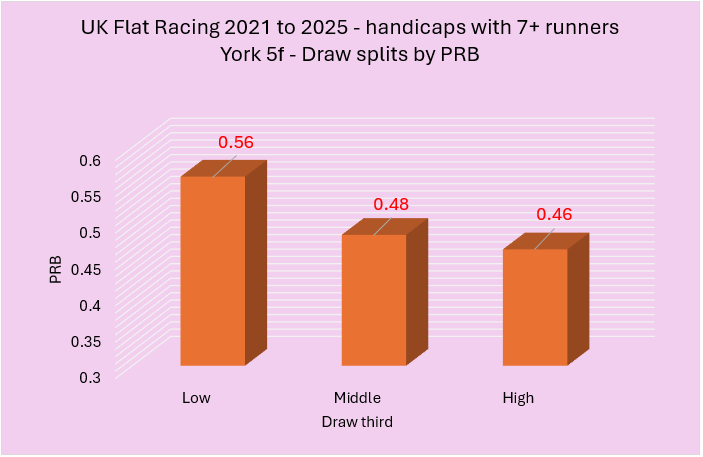
Yes, the low PRB of 0.56 confirms the advantage low draws (far side) have enjoyed here.
I should also mention that this low draw edge has looked even stronger in bigger fields. Races with 15+ runners saw the winner emerge from the lowest third of the draw 19 times in 31 races (61.3%). Further, horses drawn 15 secured just one win in 31 attempts, while horses drawn 16 or higher have won 0 races from 90! Very high draws are definitely best avoided.
*
Draw bias in 2026 is not as prevalent or as strong as it once was. However, in this piece I have reviewed 15 tracks at the minimum distance where post position does seem to make a difference; and, in some cases, a significant difference.
Before closing, I need to flag the impact that the run style of a horse will have on any potential draw bias. Normally the combination of a good draw and early speed increases the win rate and, looking across the five-furlong handicap front-running stats from 2021 to 2025 for these courses, that has been the case more often than not.
Beverley, however, has been a course where low drawn front runners actually underperformed, and that has been the case with low drawn runners at Chester, too. My guess is that some drawn low have gone off too quickly at these courses as jockeys try to take best advantage of their stall position at what have historically been renowned draw bias tracks. For the record, there were 27 low drawn front runners at Chester of which only three have won.
There were two tracks where front runners drawn in the best ‘third’ have absolutely excelled. Firstly, low drawn front runners at Pontefract won 9 times from just 18 qualifiers (50%); while at Thirsk, of the 11 high drawn front runners, 8 won (72.7%). Two other tracks also saw well drawn front runners perform extremely well and they were Redcar (8 wins from 23; 34.8%) and York (10 wins from 28; 35.7%).
I hope this article has demonstrated that, while perhaps not the same as in the golden years around the turn of the century, draw bias can still make a real difference in 2026.
- DR
p.s. for much more in depth commentary on draw biases in the UK and Ireland, see our 'Articles' archive here.
Other Recent Posts by This Author:
- Combining Pace and SR Ratings, Part 2
- More on Combining Pace and SR Ratings
- A Look at Summer All-Weather Racing
- 3yo+ First Time in a Handicap: An Analysis
- Royal Ascot 2026: Must Know Betting Angles


I get 177 qualifying races for the 5 furlongs at Musselburgh for the period 2021-2025. Please check your stats. These were derived using the historical results section on Horse Race Base website.
There were 102 7+ runner handicaps at Musselburgh since 2021 (5 years).
That number is consistent on both HRB and in our Query Tool.
Respectfully, you should always check *your* stats before posting a comment like you did 😉
Matt
My apologies, I have checked and you are indeed correct. My variables were slightly skewed and I chose the wrong tabulation. Apologies to you and the team. My bad
No problem Gotcha, thanks for your reply.
Matt
Hi Dave / Matt – Another fascinating article – thank you. I’m a bit of a ‘draw’ nut and it is always useful to have up to date information on this subject, as I am sure Clerks of the Course are probably trying to obviate biases in various ways – some more successfully than others! One thing that would be very interesting to know is how the going affects the draw bias at specific courses. As a starting point it would be useful to look at courses that stage Class 2 and 3 sprint handicaps that attract lots of runners (Ascot, Goodwood, Epsom, Newmarket, Ripon etc). As an example, Goodwood 5f and 6f races run on Soft and Heavy tend to favour high drawn horses where there is a strip near the stands rails that is drier as the course slopes away from there. Any research you might do on the draw bias related to going conditions might throw up some interesting information. Cheers. Tony
Hi Dave, All of your articles are outstanding, thank you for all of your hard work.
I spend a lot of time on Course/ Course and distance winners. It seems logical to me, that the further the distance, the more likely a preference for a course would be to a horse. For example, a flat track sprint, where there are countless, is going to produce multiple winners, whearas Sedgefield or Chepstow which are quirky, will suit some horses much more, especially over longer trips. I just wanted to plant that seed in your brain in case it was something you could use for an article (unless you have done it before and I missed it)! Thanks again Dave.
Hi Richard
Just a quick reminder, if you didn’t know, that we’ve added course characteristics to QT now – so this is something you can actually research for yourself, too.
Matt
Thanks Matt.
I am only a Lite subscriber so won’t have access to QT. I like to support Chris at HRB as well, so the cost of the two are about right for me. Lite fulfils most of what I need on Geegeez so thanks for establishing it. There are a couple of extras that I miss such as some Reports, or Pace every day, but it is a great tool.
That makes a lot of sense Richard, and fair enough.
Thanks for your continued support.
Matt
eddie hear matt big thank you for your stats matt your a genuine man not common in todays
world of sport you went to a lot to be able to send us this report im very greatful matt
might be joining geegeez in the very near future has soon has the flat settles down
once again thanks for all the stats today god bless geegeez eddie
Thanks for checking in, Eddie, good to hear from you. And thank you also for the kind words. As you say, we’ve been around a long time – and there’s a reason for that 🙂
Appreciate your message, and I hope you’re keeping well.
Matt
Winners keep popping in at Catterick.
Charlie
Leave a Reply
Want to join the discussion?Feel free to contribute!