
A four-week trial of combining Pace with SR Ratings, Part 2
This the second in a double header where I am sharing a very simple ‘system’ which I tested over a four-week period from May 1st 2026 to May 28th 2026, writes Dave Renham. Before reading on, it would make sense to read the first piece if not done already and that can be found here.
Not everyone is a fan of systems, but my racing journey was enriched by reading books and articles by the racing systems ‘king’, Nick Mordin. Hence, although I don’t tend to use rigid systems per se when selecting my bets, there are systematic elements that I do lean on within the whole process.
It should be noted that in order to find these system selections, a Geegeez Gold membership is required as that includes access to some of the key data needed.
To recap here are the ‘system’ rules:
- UK Handicap races only
- Race Distance 5f to 1m1f
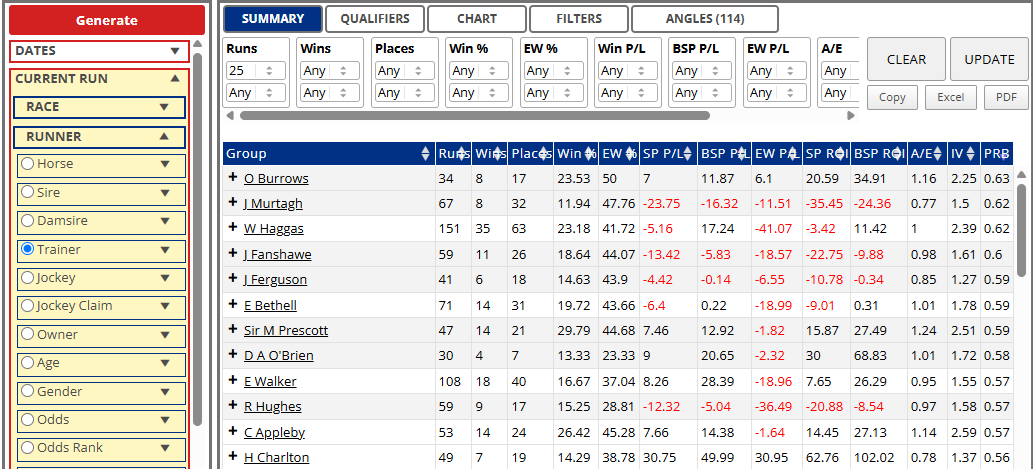
- The Percentage of Rivals figure (PRB) for the ‘led’ group on the pace tab for the specific race conditions must be 0.60 or higher
- Horse must have one of the top three pace scores for the race
- Horse must have one of the top three SR ratings for the race
Note that if there were two joint third rated pace horses then both would potentially become a qualifier if either or both of their SR rating positions were also in the top three. If there were three or more joint thirds, then I would count the two with the highest most recent race pace scores. In terms of SR rating joint thirds, I need to include them all as I have no way of splitting them. Also, if a horse had only three previous pace race scores, I would use their pace average figure to compare with the four race averages that most horses have. In this case, the horses with the three highest averages across either three or four past races would count. I did not consider horses with one or two past scores.
I mentioned in the first article that I am only using handicap races, as they give us the most reliable results for this type of idea.
In that first part I shared the results for weeks one and two. Again, just to recap, these are below with profit/losses based on BSP (Betfair SP) less 2% commission.
Week 1


Week 2

First two weeks combined

So, all in all, the first fortnight delivered some positive early findings. Of course, the sample size at this juncture was still relatively small. However, a further positive after these 49 races was that there had been 11 second places as well.
Time to move into week 3.
Week 3
The results for the third week were as follows, with winners highlighted in red. There were four qualifiers where the PRB ‘led’ sample size was small and those horses have an asterisk next to their name:
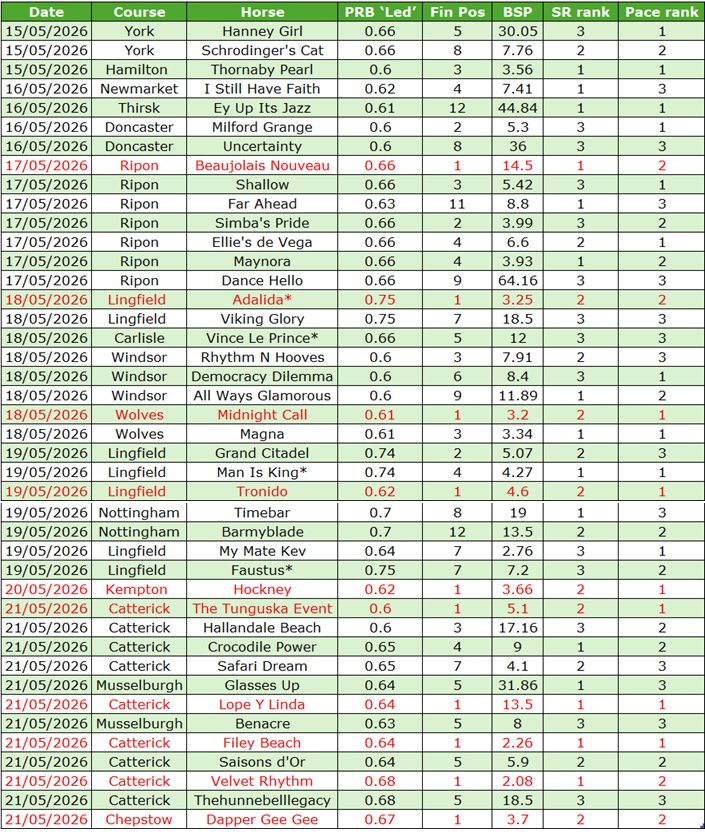
The last two days of the third week (20th and 21st) saw an excellent run of results with six wins from just 13 qualifiers. Previous to that there had been four winners from 29 showing a small loss of £3.88. The overall figures for the week ended up like this:

We saw the best weekly strike rate to date, but there were less near misses with only three second places (five thirds). Hence, there could be a valid argument that this week was a tad lucky, with so many winners. However, as we know it is better to be lucky than good. Although even better to be lucky and good!
I was three weeks in now and the overall results read as follows:

All three weeks were consistent with win rates around the 20% mark and solid profits each time. Will we see a similar pattern in week four? Well, let’s find out.
Week 4
The results for the final week are shown in the table below with winners once more highlighted in red:
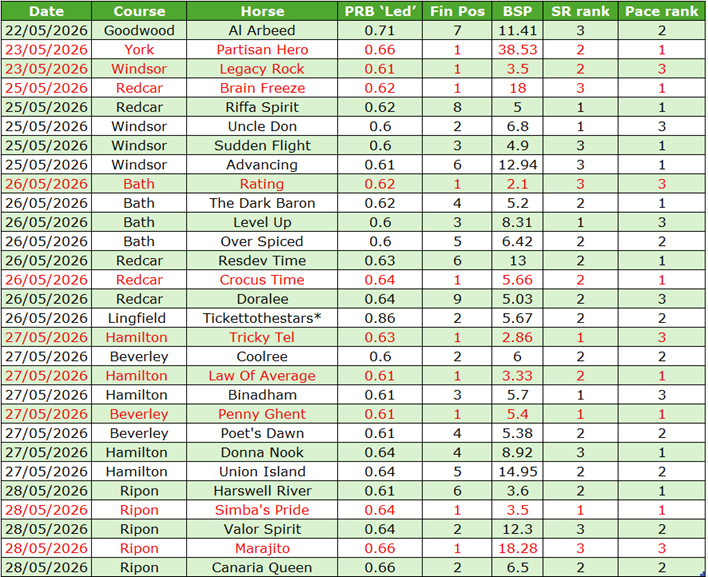
The final week of the four-week experiment went with a bang rather than a whimper with ten winners from 29 runners. There were five seconds, too, so over half of the qualifiers finished in the first two. The profit and loss figures are shown below:

A huge profit and returns across the seven days of over 242 pence in the £. Yes, this bottom line was helped by a BSP winner priced 38.53 in Partisan Hero, but even if we take that winner out, after commission, profits still stood at +33.56.
With the four weeks up, I can now share the final totals:

This has been a pretty amazing run of results across the 28 days to create such figures. Of course, we cannot get too carried away, as 120 bets across four weeks is essentially a snapshot. However, it is a snapshot that makes me want to expand my research to other weeks and months and see what they bring.
So far, I have shared just the results without doing any additional digging into the underlying numbers; I'm sure there are some extras for us starting with the average PRB figures for the system qualifiers week by week. The graph below shows the splits:
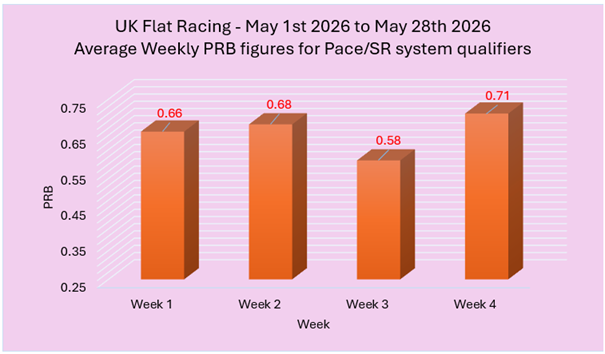
When analysing PRBs we need to appreciate that the average figure for all runners in all races is 0.50. This is the benchmark to judge against. Anything above 0.55 is usually seen to be positive and once we get to 0.60 and above then we have a strong positive. Therefore, for three of the four weeks to have average figures for all qualifying horses of over 0.65 is exceptional. Even week 3’s figure of 0.58 is very decent. These findings give me much more confidence in the small four-week sample I have looked at.
PRBs are a useful metric because in many respects they expand sample size by considering all runners in each race. For the record the overall average PRB for qualifiers across all four weeks was a very strong 0.65.
I want to focus now on the 30 winners and see which run style they employed in the individual races where they came home in front. Being in the top three of the racecard pace figures for their specific races means I would have expected a led or prominent style in the race to be more likely than a mid-division or hold up one. The graph below shows the splits in terms of percentage of runners within each run style group:

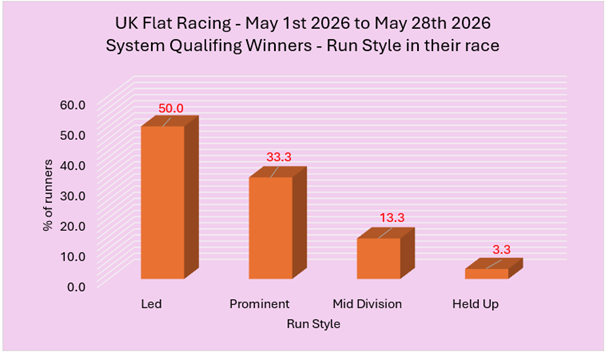
As predicted (and hoped), we see that most of the winning qualifiers had a led or prominent style; in fact, five from every six winners did. This helps cement further how effective the four racehorse pace figures in the Geegeez Racecard are in terms of helping to predict run style.
Finally, I wanted to look at the results based on their actual ranking within the SR rank and pace ranks. Hence top rated in both would count as a 1,1 in the table below.
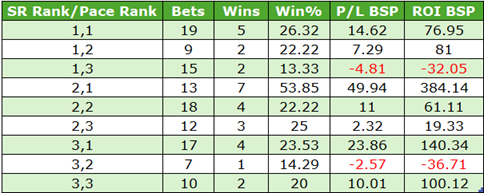
Of course, as we have nine combinations the sample sizes for each are very small. However, what was interesting was when I split the results up comparing those where at least one of the two rankings was top (e.g. 1/1, 1/2, 1/3, 2/1 and 3/1) compared with those that weren’t. Here are the splits:

Those with at least one top ranked position did much better. Again, the important caveat is that the samples are quite modest. However, there is a big difference between the PRBs for each group with the 'top ranked' group averaging 0.67 and the other at 0.59.
*
That's enough for this two-parter but I hope, if nothing else, the performance of this Geegeez Gold system, albeit over just four weeks, has provided food for thought. Personally, I will be doing more digging into this system, that is guaranteed!
Until next time...
- DR
Other Recent Posts by This Author:
- More on Combining Pace and SR Ratings
- A Look at Summer All-Weather Racing
- 3yo+ First Time in a Handicap: An Analysis
- Royal Ascot 2026: Must Know Betting Angles
- Analysing Racing Post Ratings (UK Flat)




Leave a Reply
Want to join the discussion?Feel free to contribute!