
The Ebor Festival at York – A statistical look back over the past ten meetings
The Ebor Festival at York Racecourse is one of the crown jewels of the British Flat racing season, writes Dave Renham. Indeed, I would argue it is the third most prestigious meeting of the year behind Royal Ascot and Glorious Goodwood. It takes place across four days in the middle of August and starts on Wednesday, blending championship‑level Group 1 racing with the famous Ebor Handicap, Europe’s richest flat handicap. The meeting is often described as “the Royal Ascot of the North”, which probably does it a slight disservice as it is truly a superlative event in its own right.
Across the week, York will showcase some of the sport’s most iconic races.
Introduction
The Juddmonte International, run on the opening day, is perennially one of the highest‑rated middle‑distance contests in the world, won by greats such as Frankel and Sea The Stars.
The Yorkshire Oaks brings together elite fillies and mares, with champions like Enable and Love adding their names to the roll of honour.
Friday’s feature, the Nunthorpe Stakes, is a blistering five‑furlong sprint that crowns the fastest horses in Europe. Then on Saturday comes the meeting’s namesake: the Ebor Handicap, a huge-field staying race that has produced some surprising results from time to time and remains one of the biggest betting events of the summer.
York’s wide, galloping track is known for fairness, giving top-class horses the chance to show their true ability. However, as we will see, there are biases, notably draw and run style, that can affect the outcome at certain distances. In this article, I will be looking at data covering the last ten Ebor meetings with profits calculated to Betfair SP (BSP) less 2% commission on winning bets.
Let's get cracking!

The Betting Market
Our first port of call is the market. Here is the record of different market positions as determined by their Betfair Starting Price (BSP). The first five positions are shown individually, while horses sixth in the market or bigger have been grouped together.
| Market Rank (BSP) | Runs | Wins | Win% | BSP P/L | BSP ROI |
| Favourite | 269 | 79 | 29.37 | 8.99 | 3.34 |
| 2nd favourite | 270 | 48 | 17.78 | 32.31 | 11.97 |
| 3rd favourite | 267 | 35 | 13.11 | 23.13 | 8.66 |
| 4th in betting | 265 | 21 | 7.92 | -54.98 | -20.75 |
| 5th in betting | 260 | 24 | 9.23 | 77.62 | 29.85 |
| 6th+ in betting | 2150 | 63 | 2.93 | -161.25 | -7.5 |
As the table indicates, the market has been an excellent guide when we look at the meeting as a whole. The top three betting positions have all produced blind profits to BSP, as has position five. However, as far as horses fifth in the betting are concerned my guess is that this has been partly due to happenstance.
Those sixth or bigger in the betting have performed poorly despite the losses standing at just 7.5 pence in the £. This figure has been skewed somewhat because one of the winners was priced at BSP 538.81.
If we take that winner out of the ‘6th+’ group, losses for the remaining runners stands at a touch more than 32% (32p in the £). Indeed, if we compare ROI percentages (return on investment) for BSP prices 18.0 and lower compared with 18.01 to 500 we see the following:
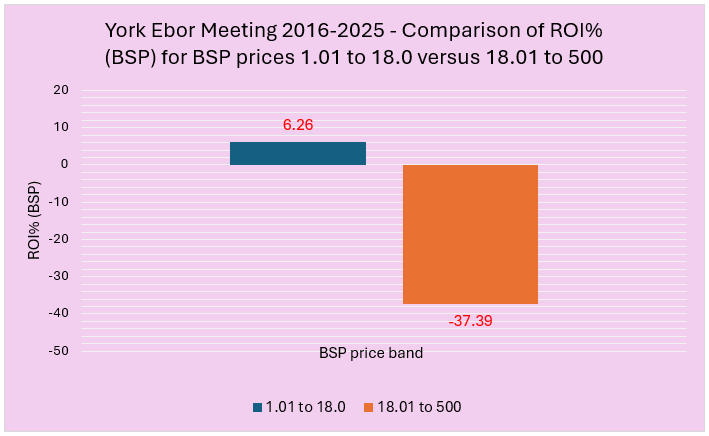
That 538.81 winner mentioned earlier lies outside the 18.01 to 500 band to help emphasise the strong market bias we have seen at this meeting over the past ten years. I now want to drill into favourites in a bit more detail as well as the top three horses in the betting, so let me start with the market leaders.
York Ebor Meeting Favourites
Backing favourites blind would, somewhat surprisingly, have yielded a profit in six of the ten years. Below is a breakdown of handicap favourites versus non-handicap ones.
| Race Type | Runs | Wins | Win% | BSP P/L | BSP ROI |
| Non-handicap | 140 | 55 | 39.29 | 11.86 | 8.47 |
| Handicap | 129 | 24 | 18.6 | -2.87 | -2.23 |
We would expect to see a much higher strike in non-handicaps, and we do. From a returns perspective, non-handicap favourites delivered a profit to the tune of better than 8p in the £.
York Ebor Meeting Favourites by Race Class
What about class of race? In the table below we see the results for favourites in Group 1, 2, 3 and Listed races, as well as all other races which were Class 2 level.
| Race Class | Runs | Wins | Win% | BSP P/L | BSP ROI |
| Group 1 | 31 | 15 | 48.39 | 1.87 | 6.02 |
| Group 2 | 46 | 19 | 41.3 | 3.32 | 7.22 |
| Group 3 | 23 | 6 | 26.09 | -5.14 | -22.36 |
| Listed | 20 | 7 | 35 | 3.75 | 18.74 |
| Class 2 | 149 | 32 | 21.48 | 5.2 | 3.49 |
Favourites have been fairly consistent across the five levels with only Group 3 jollies showing a loss.
I have two additional market leader stats worth sharing. The first is the performance of favourites in 3yo only races: they won 12 of 36 races (SR 33.3%) for a profit of £10.78 (ROI +29.9%).
The second is when Exchange favourites were aged five or older. They won an impressive 42.6% of the time (20 wins from 47) for a healthy profit of £23.26 (ROI +49.5%).
Top three in the York Ebor meeting markets
Next I'll group the top three in the Exchange market together.
| Runs | Wins | Win% | BSP P/L | BSP ROI |
| 806 | 162 | 20.1 | 64.43 | 7.99 |
Backing all of the top three market positions blind in every single race over the past ten years would have made a solid profit. In terms of handicaps vs conditions races we see the following results:
| Race Type | Runs | Wins | Win% | BSP P/L | BSP ROI |
| Non-handicap | 421 | 100 | 23.75 | 4.75 | 1.13 |
| Handicap | 385 | 62 | 16.1 | 59.68 | 15.5 |
Based on what we saw earlier when looking solely at favourites, it is clear that second and third market choices in handicaps have performed extremely well. Indeed, backing the two in every handicap race would have produced a very healthy return of over 24 pence for every £1 bet.
We saw earlier that Exchange favourites when aged five and older fared very well, and extending these 5yos to those that were in the top three of the betting improved matters still further. This older cohort produced 38 winners from 131 runs (SR 29%) for a significant profit of £72.15 (ROI +55.1%). It should be noted that the bigger returns were seen in handicap races (72p in the £), but even in non-handicaps older horses returned 35p in the £.
Course last time out (LTO)
A look now to see whether the location of a horses' previous race course outing made any difference. Here are the data, with qualifying courses need to have had a minimum of 40 qualifiers.
| Course LTO | Runs | Wins | Win% | BSP P/L | BSP ROI |
| Ascot | 457 | 38 | 8.32 | -78.35 | -17.14 |
| Ayr | 46 | 2 | 4.35 | -21.15 | -45.98 |
| Chester | 85 | 3 | 3.53 | -53.88 | -63.39 |
| Curragh | 114 | 18 | 15.79 | -0.18 | -0.16 |
| Doncaster | 69 | 6 | 8.7 | 39.52 | 57.28 |
| Goodwood | 837 | 65 | 7.77 | -232.55 | -27.78 |
| Hamilton | 47 | 3 | 6.38 | 6.6 | 14.04 |
| Haydock | 148 | 11 | 7.43 | 6.35 | 4.29 |
| Musselburgh | 44 | 1 | 2.27 | -18.5 | -42.05 |
| Newbury | 127 | 13 | 10.24 | 0.57 | 0.45 |
| Newcastle | 59 | 0 | 0 | -59 | -100 |
| Newmarket | 300 | 27 | 9 | 25.93 | 8.64 |
| Pontefract | 68 | 3 | 4.41 | 3.76 | 5.53 |
| Ripon | 54 | 7 | 12.96 | 18.18 | 33.67 |
| Sandown | 90 | 12 | 13.33 | 18.72 | 20.8 |
| Thirsk | 71 | 3 | 4.23 | -32.01 | -45.08 |
| Windsor | 60 | 5 | 8.33 | -23.27 | -38.78 |
| York | 252 | 18 | 7.14 | 500.11 | 198.46 |
No prizes for guessing where the 538.81 BSP winner raced last time...!
The main finding for me is the poor performance of horses that ran at Goodwood last time. Of the 837 qualifiers, 833 had raced at Glorious Goodwood LTO so maybe a good proportion of these runners had been primed to peak at Goodwood which would partly explain these disappointing numbers. Even so, to lose over 27p in the £ across so many runners is very steep.
It gets worse still if we focus on horses that finished in the first three LTO at that Glorious meeting – this group of horses scored less than 10% of the time at the Ebor meeting on their next start (32 wins from 331 runners; SR 9.7%). Backing all of them would have seen losses of £137.04 (ROI -41.4%). Wow! Losses of more than 41 pence in the £ is crazy. Even when we extend to horses that finished in the top six at the Goodwood Festival meeting LTO losses were still 35p in the £.
Another point to note is that horses from some of the lower grade Northern tracks have performed poorly, too. I guess this should be expected, but LTO runners at Newcastle (0 from 59), Thirsk (3 from 71) and Pontefract (3 from 68) have particularly struggled. Likewise, horses that raced at Ayr, Chester and Musselburgh LTO found winning tough at the Ebor meeting.
It is not only the positive angles we should be looking for because negative ones can help us narrow down a field and make the selection process far more manageable.
In terms of positives, horses running at the Curragh last time performed quite well. Of their 18 winners, eight came from Aidan O’Brien but his runners actually made a loss of 28p in the £. Combining all other trainers together would have turned a profit, with an overall return of 17p in the £.
York Ebor Meeting Trainer Angles
A look at trainers now, although as with most big meetings, it is hard for even the best trainers to stand out in such a competitive environment. Firstly, I want to share the trainers with the top ten A/E indices, all of which happen to be above the magic 1.00. These are based on Industry SP, so in truth we can upgrade them a little further.
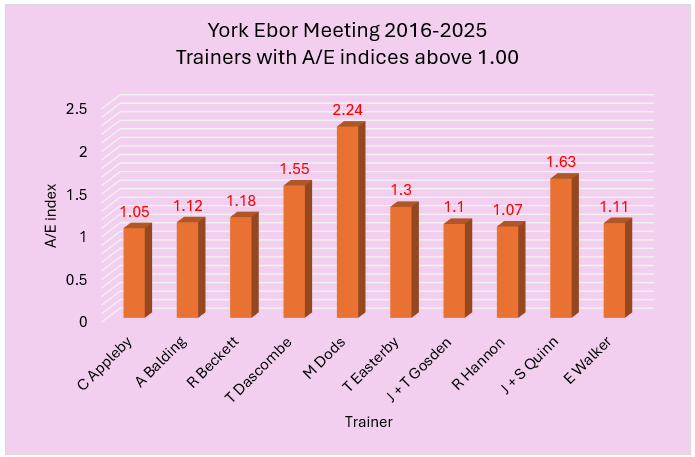
Any score above 1.00 suggests betting value across the trainer cohort as a whole, and Michael Dods stands out with an A/E index of 2.24. A fair proportion of these trainers are ones we might have expected to do well, namely (Charlie) Appleby, Balding, Beckett and the Gosden yard. Here are the full stats for the ten:
| Trainer | Runs | Wins | Win% | BSP P/L | BSP ROI |
| J + T Gosden | 97 | 23 | 23.71 | 11.73 | 12.09 |
| C Appleby | 61 | 12 | 19.67 | 7.55 | 12.38 |
| M Dods | 41 | 8 | 19.51 | 49.54 | 120.83 |
| J + S Quinn | 34 | 5 | 14.71 | 50.31 | 147.97 |
| A Balding | 138 | 19 | 13.77 | 34.05 | 24.67 |
| R Beckett | 86 | 11 | 12.79 | 15.9 | 18.49 |
| R Hannon | 97 | 11 | 11.34 | -17.08 | -17.61 |
| T Dascombe | 46 | 5 | 10.87 | 9.02 | 19.61 |
| E Walker | 40 | 4 | 10 | 16.57 | 41.43 |
| T Easterby | 100 | 8 | 8 | 536.4 | 536.4 |
Nine of the ten stables proved profitable to follow with only the Hannon yard enduring a punting 'reverse'. The Dods stats are strong, as expected off his 2.24 A/E figure, but five of his eight winners arrived between 2016 and 2019. The Gosden yard has been highly consistent with at least one winner in eight of the past ten years. Indeed, in four of those years they managed four victories per meeting. Take note if the Betfair market has a Gosden runner at the head of it, as 15 of their 26 Betfair favourites have won, returning punters nearly 38 pence in the £.
The following table contains data for all other trainers who saddled at least 30 runners at York's Ebor meeting in the past ten years. Again, they are ordered by win rate:
| Trainer | Runs | Wins | Win% | BSP P/L | BSP ROI |
| A O'Brien | 110 | 15 | 13.64 | -45.73 | -41.57 |
| W Haggas | 143 | 15 | 10.49 | -47.85 | -33.46 |
| C Hills | 66 | 6 | 9.09 | -13.82 | -20.94 |
| R Varian | 78 | 7 | 8.97 | -32.04 | -41.08 |
| Clive Cox | 37 | 3 | 8.11 | 9.47 | 25.59 |
| K Burke | 103 | 6 | 5.83 | -16.48 | -16 |
| D O'Meara | 140 | 7 | 5 | -82.36 | -58.83 |
| R Fahey | 154 | 7 | 4.55 | -37.56 | -24.39 |
| K A Ryan | 160 | 7 | 4.38 | -52.17 | -32.61 |
| H Palmer | 54 | 2 | 3.7 | 10.55 | 19.54 |
| I Williams | 38 | 1 | 2.63 | -31.53 | -82.97 |
| B Ellison | 32 | 0 | 0 | -32 | -100 |
| Michael Bell | 32 | 0 | 0 | -32 | -100 |
| C Johnston | 41 | 0 | 0 | -41 | -100 |
As we can see, when looking at the raw figures it seems that the mercurial Aidan O’Brien has not quite mastered this meeting. Losses of over 41p in the £ is steep for all his runners. However, there are two very important caveats. Firstly, he has improved notably in the last three years with nine of his 15 winners in the decade striking; and, secondly, his bigger priced runners have struggled and can generally be ignored: Ballydoyle runners sent off at a BSP higher than 12.0 went 0 from 47 over the past ten Ebor meetings.
William Haggas, too, has very modest overall stats but, like O’Brien, his recent record is much better, with ten of his 15 winners having come in the past four years. Some of that was variance for the proud Yorkshireman and he's had a winner every year since at least 2009 - with the exception of 2021 when, bizarrely, his Percentage of Rivals Beaten (PRB) figure of 64% was his highest since 2015. These are some of the challenges when trying to make sense of small datasets!
York Ebor Meeting Run style / Pace Bias
Onto run style now. I'll kick off by looking at win strike rate by run style across all races.
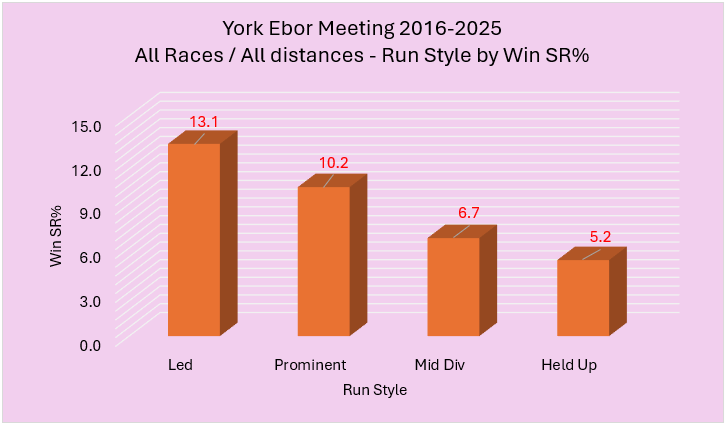
Front runners enjoy a good edge at York, and this type of linear pattern is one we have seen numerous times before where the bars get smaller from left (led) to right (held up). We normally see strong front running biases at shorter distances so the graph below splits the York Ebor meeting data into three distance bands – 5f to 6f; 7f to a mile; and 1m1f+.
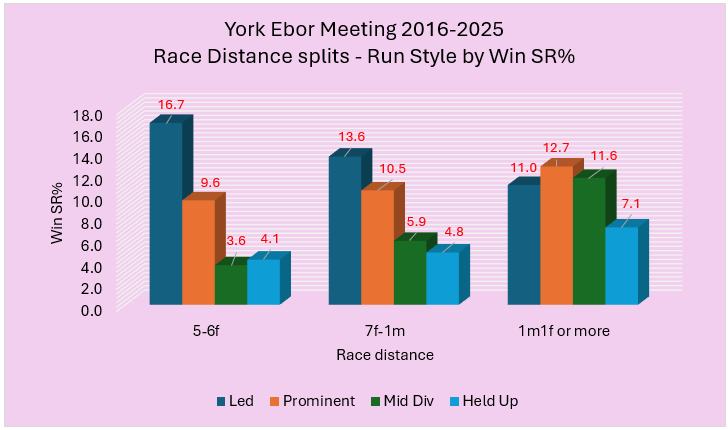
Over 7f and 1m the closer to the early pace the better, but once we get to longer distances it is a much more level playing field, although hold up types have still struggled.

Meanwhile, on the straight track (5-6f) front runners have had a very strong edge in terms of win percentage/strike rate. Looking at PRB in these sprints there is a strong positive correlation with the win rates as the graph shows below:
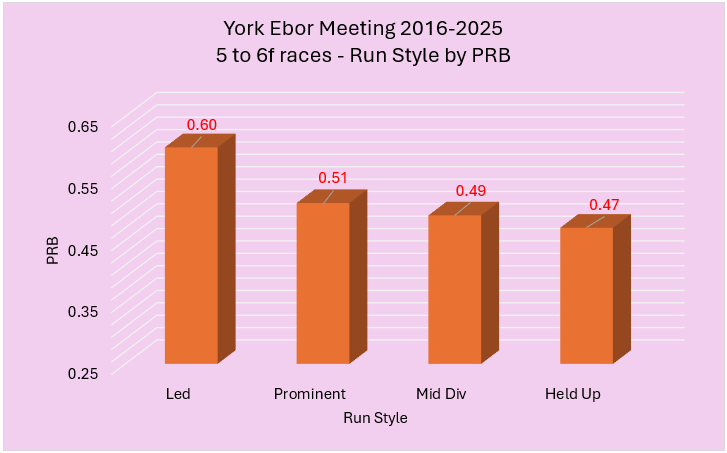
0.60 is a very strong PRB figure and, clearly, we should look out for potential front runners in sprint races. There have been four specific races which stand out:
Wed 1.50 Hong Kong Jockey Club handicap (5f) – in eight of the last ten years this race was won by a horse that either raced prominently or led early (6 wins for Prom; 2 for Led). 132 horses were either held up or raced mid-division and only two won. However, for the record these two winners came within the past three renewals.
Wed 5.20 Sky Bet Nursery (6f) – four of the last ten races were won by the early leader and, considering nine of the last ten renewals were contested by at least 16 runners, this is extremely noteworthy. There were four further wins for prominent racers, meaning - again - those racing in the second half of the field early on were left fighting for scraps generally.
Thu 1.50 Lowther Stakes (6f) – four of the last eight renewals have been won by the horse that took the lead early.
Fri 3.35 Nunthorpe Stakes (5f) – there have been eight wins for prominent racers and one for the front runner in the last decade. Hold up horses were 0 from 54.
York Ebor Meeting Draw Bias
I want to finish up by looking at whether any draw biases are likely to occur. Generally at York, there is a low draw bias over 5-6f and also at a mile. Below I've combined 5f and 6f races first to analyse the draw data from all York sprint handicaps of 14 or more runners since 2021. I have used a small part of the excellent Geegeez Gold Draw Analyser tool for this:

I have chosen 14 or more runners because more than 80% of the sprint handicaps at this meeting over the past ten years have seen at least 14 runners line up. Low draws have definitely had the best of it at the track in the past few years based on the metrics shown in the table.
Moving up to a mile and there will be two handicaps at the distance again this year, almost certainly with very big fields. For the record, 16 of the 20 1-mile handicaps at this meeting over the past ten years has seen at least 16 runners line up. So I have set the Draw Analyser parameters to look at 16+ runner handicaps run at York (any meeting) going back to 2021 in order to illustrate what has transpired.

Low draws have dominated and high draws have really struggled. It should be noted that mile races are contested on the round course and a berth closest to the inside rail in these races has proved a real advantage. Indeed, this is a trend that goes all the way back to the 1990s.
Looking at the ten-year draw trends for each 1-mile handicap:
On Thursday at 3.00, the Sir Kevin Sinfield 7 In 7 Grand Finale Handicap has seen five of the last ten renewals won by horses drawn four or lower, with eight going to horses drawn eight or lower.
The 1.50 on Friday, the Sky Bet Mile Stakes, has resulted in seven of the last ten winners emerging from stall five or lower; all bar one of the ten were posted seven or lower and, therefore, in the bottom half of the draw.
*
I hope this article has offered some useful pointers for the four excellent racing days at York this week. The best of luck to you if you're playing.
- DR
Other Recent Posts by This Author:
- Billy Loughnane: ‘The Kid’ in Numbers
- Course Topography: Uphill Finishes
- The Impact of Last Time Out Run Style
- Combining Pace and SR Ratings, Part 2
- More on Combining Pace and SR Ratings





Leave a Reply
Want to join the discussion?Feel free to contribute!