
Preparing for the Jumps - Part 3, Handicap Chases
In this third article in a series looking forward to the National Hunt season we'll continue last week's chase theme, this time focusing on non-novice handicap chases, writes Dave Renham. That is, any handicap chase without the term ‘novice’ in the title. As before, data has been taken from 1st January 2018 to 31st August 2025 with profits and losses calculated to the Betfair Starting Price (BSP) with a 2% commission applied on any winning bets. Only UK NH races have been researched, so this does not include Irish racing.
We have a good number of qualifying races per year, usually between 850 and 900; in total, then, this equates to nearly 6500 races. I will start as I always do by examining the betting market.
Market factors
I have used Betfair to determine market rank and the table below shows performance by position in the Betfair SP market:
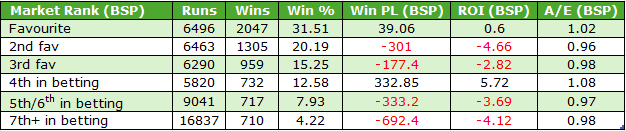

Favourites performed well and even made a small blind profit. Concentrating on the other market positions, horses ranked fourth in the betting made a solid profit which is a big outlier when comparing to other market positions in the table whose ROI%s are all in the same ballpark. It is interesting that if backing horses fourth in the betting year in year out, a blind profit was achieved in six of the eight years.
Personally, I do not see backing horses fourth in the market as a strategy this coming season because I am assuming it is down to variance. Having said that, I looked back on the previous eight-year subset (2010 to 2017) and horses fourth in the market made a profit then, too. The ROI% was +3% in that time frame. I’ll leave you to decide how to interpret that...
Returning to favourites for a slightly deeper dive, here are the yearly ROI% numbers:
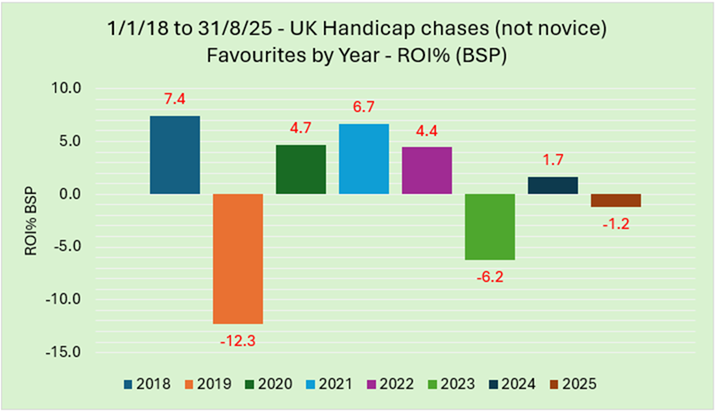
As we can see, there were flucatuations from year to year ranging from 2018, the year showing the best returns at +7.4%, to the year showing the worst returns (2019) at -12.3%. This is a good example that even annual results for a similar type of horse are rarely uniform. It is something as bettors we really need to appreciate. It’s like the tossing a coin analogy where the first ten tosses see seven heads and three tails, and the second ten see the script flipped somewhat with two heads and eight tails. The previous ten tosses are usually not a statistical or mathematical guide to the next ten. We know over a long period of time that the percentages for the number of heads compared to tails is going to trend towards 50-50, but over shorter periods we will get significant fluctuations.
Moving on, and still with favourites, here is performance by race class.
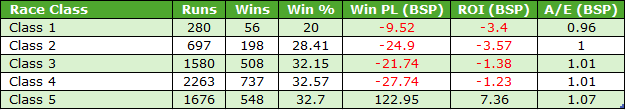
As we can see there are far more handicap chases when we get to Class 3 level or lower. The strike rate for Class 1 handicaps was lower than the rest and this was simply down to bigger average field sizes. The lowest class (5) has seen the best results with six of the eight years turning a profit, and the A/E index of 1.07 was extremely solid.
Having looked at the market, it is time to look into other areas. As with the first two articles, I am going to impose a BSP price limit of 20.0 or lower from now on, to avoid any winners at excessively big odds potentially skewing the bottom line. It still includes nearly 40,000 runners so the sample size remains huge.
Sex of horse
There will always be more male runners than females but how did their stats stack up against each other? Let me see:

In terms of performance, both sexes performed in a comparable way across all the key metrics so there was no real edge to either.
Age of horse
Moving on to age data now, and I'll begin by sharing the A/E indices across different ages:
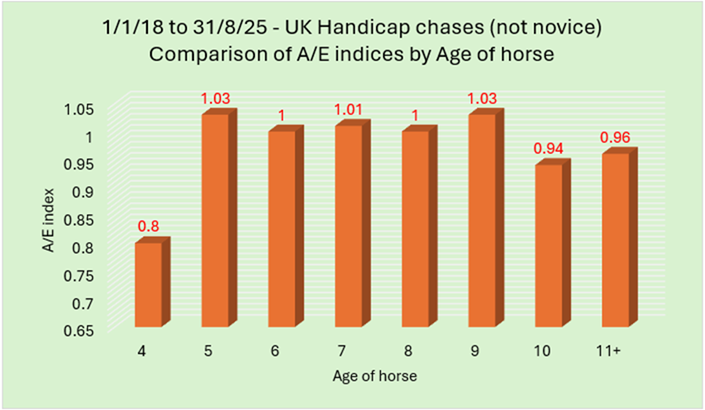
The 4yo stats are based on just 127 runners so, concentrating on the bigger samples of horses aged five and older, there seems nothing much in it between the ages of five and nine, but once we get to handicap chasers aged ten or older we start to see a dip. Here is a fuller view covering other key metrics:
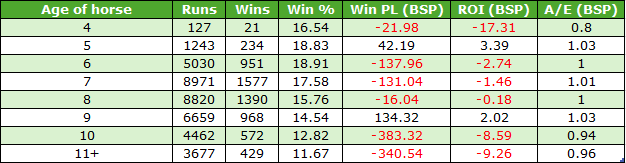
When looking at the data as a whole, there seems to be the same age bias as we saw in the graph in play here: lower win rates for horses aged 10 and older, and much poorer ROI percentages too. Even when focusing on horses aged 10+ that started favourite or second favourite, their record was relatively poor in comparison to the other market stats we saw earlier. This cohort of older favs won 374 races from 1671 runners (SR 22.4%) for losses of £160.48 (ROI -9.5%); A/E 0.93. Logic dictates therefore that in general we should concentrate on horses aged five to nine.
Country of Breeding
Changing tack to breeding and specifically the country of breeding, below is a breakdown for the four main breeding entities - British, Irish, French and German-breds:
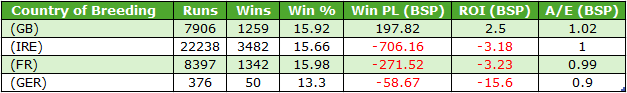
We have similar strike rates for the three main countries, Britain, Ireland and France. German-bred runners are less common and have performed below the level of the other three.
There are interesting stats for French bred runners when we split their data into different age groups. Combining five- and six-year-old runners together they produced 400 winners from 2056 qualifiers (SR 19.5%) for a small profit of £52.94 (ROI +2.6%); A/E 1.05. Moreover, backing all qualifiers to place on Betfair also nudged into profit to the tune of £36.58.
Compare this to the record of French-breds aged 10 and up. This older cohort produced 168 winners from 1324 runners (SR 12.7%) for a hefty loss of £150.30 (ROI –11.4%), A/E 0.94.
British-bred runners aged eight or younger combined to produce a good set of figures: 832 wins from 4545 runners (SR 18.3%) for a healthy profit to BSP of £420.95 (ROI +9.3%). The A/E index of 1.08 suggests these runners have offered good value. British-bred older runners, though, performed even more poorly than their French counterparts, hitting a strike rate of just 11.6% (229 wins from 1973) for losses of £277.60 (ROI -14.1%); A/E 0.89.
Position Last Time Out (LTO)
A quick mention of the most recent piece of form in terms of finishing position LTO. There were no clear patterns that I found but here are three stats that I thought were reasonably interesting.
Firstly, LTO winners performed reasonably well, making only a small loss of 1.5 pence in the £. They won 21.6% of the time, so with a bit of extra digging there may be some value to be found in certain last time winners in handicap chases.
Secondly, horses that fell or were unseated LTO did not perform well. They collectively achieved 201 wins from 1520 (SR 13.2%) for a loss of £114.44 (ROI -7.5%); A/E 0.93.
And thirdly, horses that were pulled up LTO but started favourite next time had a good overall record. Clearly, not a high percentage of horses that were pulled up LTO go off favourite on their next start, but when they did, 71 won from 201 runners (SR 35.3%) for a decent profit of £48.02 (ROI +23.9%); A/E 1.25.
Weight
In handicaps of course horses carry weight based on their Official Rating, although it is rare to find anything significant overall as the handicapper does such a good job rating and weighting horses. It can difficult sometimes to decide how best to analyse weight. Weight carried or weight rank are two obvious options, and I have used both many times before.
For these data I have chosen a new idea by comparing different groups in relation to the average weight carried in the race. As Geegeez has recently added the average OR for each race in their racecards it seems a good idea to take this approach. I have split the runners into three groups:
- Horses carrying 4lb or more than the race average.
- Horses carrying 4lb or less than the race average.
- Horses weighted within 4lb of the race average.
Here are the A/E indices of the three groups:
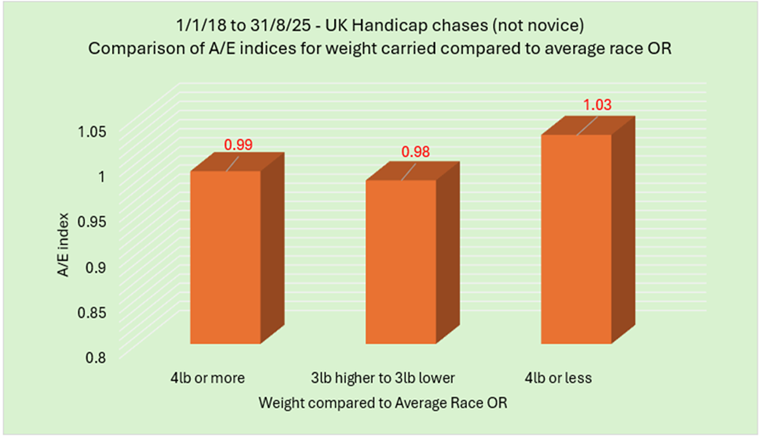
Horses carrying less weight offered the best value within the timeframe and the ‘4lb or less’ group turned a small profit of £238.04 (ROI +2%). Overall, this group contained 11,106 runners of which 1676 won (SR 15.1%). The other two groups lost 4p in the £ across 14,284 bets and 13,599 bets respectively.
Race Class change
A look at change in class next. Here are the splits:
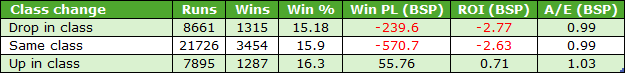
Horses upped in class did best, albeit by a smallish margin given the number of runners within each group.
Trainer Angles: Overall
The final port of call for this piece is to look at some trainer data. Let me start by flagging those trainers with the highest win rates (who saddled at least 150 runners during the time frame). This is a big table containing over 50 trainers. They are ordered alphabetically:
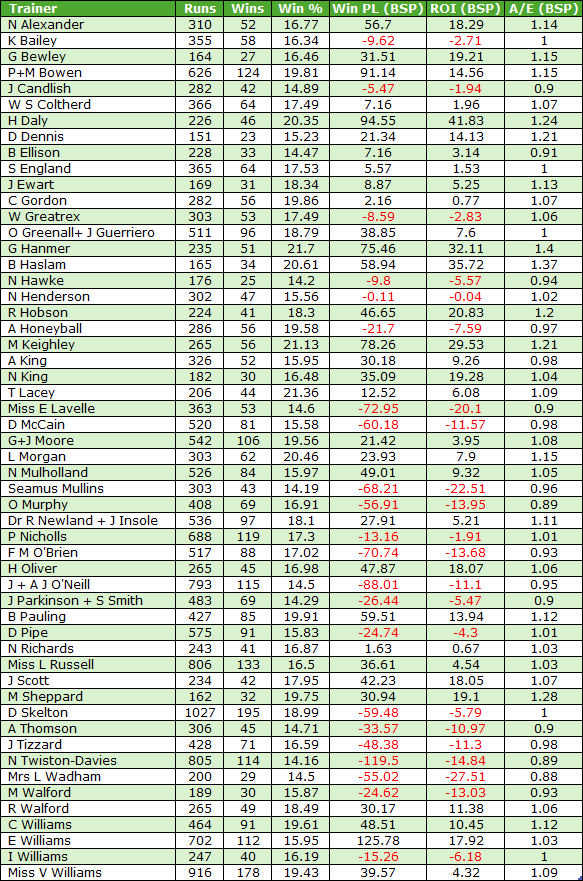

32 of the 54 trainers made a blind profit which is a higher number than I had expected, while seven had A/E indices of 1.20 or higher – these trainers are Gary Hanmer, Ben Haslam, Matt Sheppard, Henry Daly, Martin Keighley, David Dennis and Richard Hobson. That septet appears to have gone under the radar somewhat. Here are some additional positives for some of those trainers:
- Ben Haslam seems to excel with older horses. Those aged 9 or older won 25 times from 107 (SR 23.4%) for a profit of £51.98 (ROI +48.6%); A/E 1.48. There were a few multiple winners but 11 different older horses came home in front so Haslam seems to have good knack of rejuvenating veteran runners.
- Henry Daly did especially well in races of three miles or more. In these contests he saddled 31 winners from 154 (SR 20.1%) for a huge £103.14 profit (ROI +67%); A/E 1.33.
- Sticking with Daly, his runners won just three times in 47 attempts in Class 1 or 2 events. However, in Class 3 or lower his record was 43 wins from 179 (SR 24%) for a profit of £111.44 (ROI +62.3%).
- Martin Keighley has shown excellent consistency when we compare his record across the year. When we split the year into four groups of three months (Jan to Mar, Apr to Jun, Jul to Sept and Oct to Dec), his win strike rates were as follows:
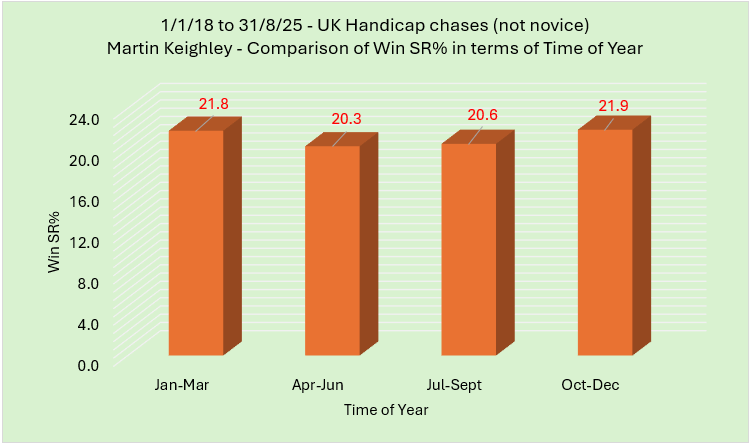
Not only was Keighley consistent, he also secured returns of at least 14p in the £ in each of the four quarterly groupings.
- Richard Hobson produced a profit in seven of the eight years. Hobson’s record with favourites should also be noted – 16 wins from 37 (SR 43.2%) for a profit of £20.09 (ROI +54.3%); A/E 1.48.
Trainer Angles: Comparative Data
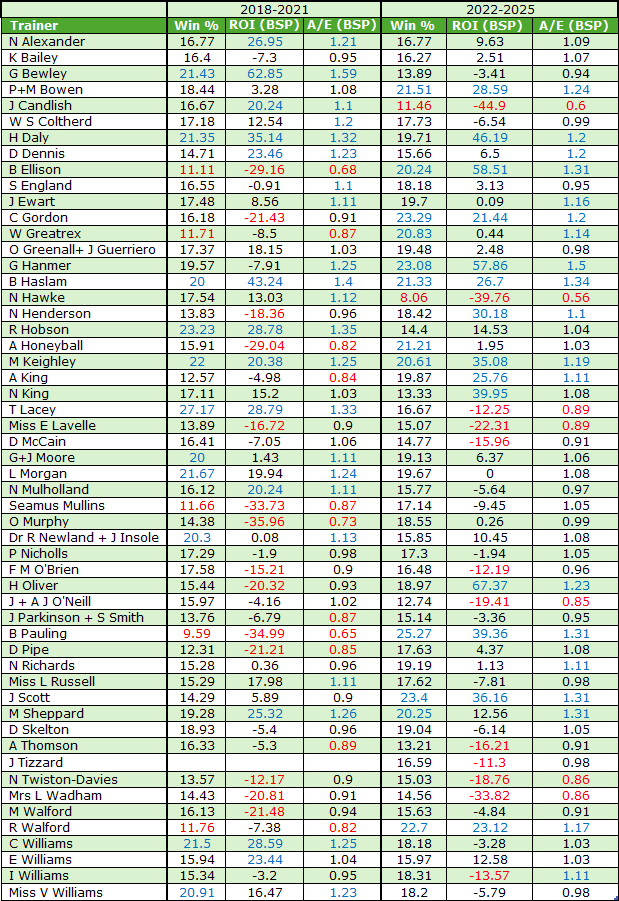
The final data for these 54 trainers that I would like to share shows their results split into two groups – 2018 to 2021 and 2022 to 2025. I have placed the comparative data in a table covering win strike rate, ROI percentage and A/E indices. Anything highlighted in ‘blue’ is a positive, anything in ‘red’ is a negative. My criteria for each, was as follows:
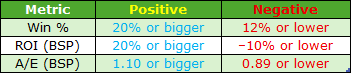
By colour coding the table I hope that it helps to compare the data a little more easily. Here is the table:
Some points I would like to highlight:
Firstly, there is a statistical quirk which, when I saw it, I took a double take. Notice the two strike rates for the different groups of four years for Nick Alexander – they both are 16.77%, but what makes this even more remarkable is that the wins to runs ratio for both timeframes was 26 wins from 155 runners!
Other key points to note:
- Messrs. Daly, Haslam, Keighley and Sheppard, four of the seven positive trainers noted earlier, managed to be consistently good across both time frames.
- Brian Ellison, Warren Greatrex, Alan King, Ben Pauling, Jeremy Scott and Robert Walford have all shown a significant uptick in performance in the more recent four years.
- Nigel Hawke and Tom Lacey have both struggled more recently, well down on their stats for the 2018 to 2021 period.
- The Greenall / Guerriero stable, along with the Moore stable have both had decent results in both timeframes. We could say the same about Neil King and Evan Williams.
**
And that concludes my handicap chase analysis ahead of this jumps season. There's plenty to go at in there and I hope some of the stats will assist you in finding some good value handicap chase winners between now and the spring.
- DR
Other Recent Posts by This Author:
- The Impact of Last Time Out Run Style
- Combining Pace and SR Ratings, Part 2
- More on Combining Pace and SR Ratings
- A Look at Summer All-Weather Racing
- 3yo+ First Time in a Handicap: An Analysis


As always, a very interesting analysis
My stats based on 11 years data have the following key facts
Horses that are NOT distance winners 3,550 from 28,745, AE 1.03, ROI 3%
Weight less than 11st 3lb 2,914 from 25,800, AE 1.03, ROI 4%
Age less than 8, 3,008 from 18,736, AE 1.02, ROI 3%
UK bred, 1,527 from 11,631, AE 1.04, ROI 10%
Not finished 1st or 2nd last time, 4,304 from 38,774, AE 1.02, ROI 2%
Whether these trends continue is always the big if !
Leave a Reply
Want to join the discussion?Feel free to contribute!