Tag Archive for: Catterick draw bias

Top Draw Biases for the 2024 Flat Season

Over the past week I have finished collating thousands of stats, and crunching most of them, in order to be primed and ready for the new turf flat season, writes Dave Renham.

The first things I always update in the close season are draw statistics for each course and distance. If possible, I want to stay ahead of the crowd by noticing whether biases seem to be strengthening, weakening, or potential new biases are emerging. When analysing draw bias, I tend to focus on handicaps only with at least eight runners (generally the more runners the better). A good chunk of the data shared in this piece will be from 8+ runner handicaps only.

While draw bias may not have the overall impact it had twenty to thirty years ago, there are still enough edges in play to give shrewd punters a leg up. However, it is crucial to fully understand how strong any biases are and whether the market has compensated, or in some cases over-compensated. It has been two years since I last looked at draw bias on Geegeez so let’s crack on and review a selection of my recent findings and their potential ramifications.


Ascot 5f to 1 mile (straight course)

The straight track at Ascot is one I keep a close eye on, not just year on year, but meeting by meeting, day by day. Draw biases seem to come and go at the Berkshire track and it is not always easy to predict how strong they will be and which part of the track, if any, will be favoured. Biases are most likely to occur in big field handicaps where the runners tend to split into two or sometimes three groups.

At the Royal Meeting in 2023 there were six straight course handicaps where the field sizes ranged from 26 to 30 runners. The first such contest of the week, the Royal Hunt Cup, produced the following result. The first ten finishers are shown:


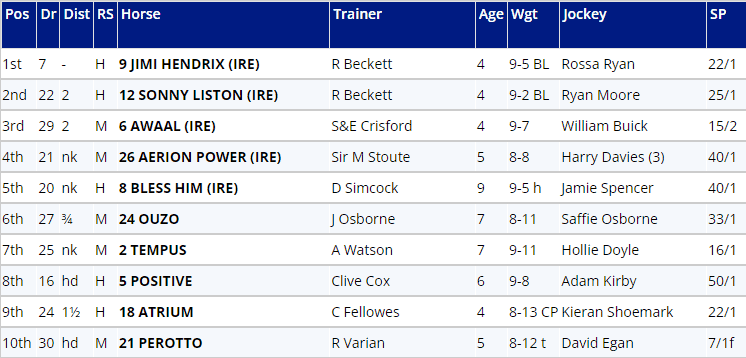
Although the winner Jimi Hendrix was drawn in single figures the next six finishers were drawn in the 20s and eight of the top ten were drawn between 20 and 30. This race suggested that higher draws held a decent edge over middle / low draws. Now, just because one race displays a draw bias like this, we cannot be certain that this will be replicated in subsequent races during the same meeting. However, last year, by the end of the Thursday punters should have been fairly confident that there was a playable high draw bias, as the Buckingham Palace handicap that ended proceedings on the third day of the Royal meeting delivered the first five horses home from stalls 24, 23, 12, 21 and 22.

Indeed, this high draw bias was repeated in all three of the big field handicaps that took place on the Friday and the Saturday. For example, the first six in the Sandringham were drawn 25, 16, 18, 24, 20 and 29, while in the Palace of Holyroodhouse the first six finishers were drawn 25, 16, 17, 20, 27 and 29.

I mentioned earlier that draw biases at Ascot are not always replicated in subsequent races. This comes from watching and punting on many past Royal meetings. There have been times where the draw bias seems to have flip-flopped from race to race. Why this happens is not always clear. It could be that what appears to be a draw bias might in fact be down to a pace-based bias. As punters we need to make an informed judgement whenever we see what appears to be a draw bias at a specific meeting, to decide whether it actually is one or not.

The Royal Meeting, though, does provide the best opportunity to profit from draw bias at Ascot. Essentially, for me there are three ways I tend to play the draw at Royal Ascot on the straight course:

  1. Split the stalls into three and focus solely on that part of the draw from which I think there will be an advantage. If I am right, then by eliminating two-thirds of the runners, my chances of profiting increase considerably. I can take this view before any big field handicaps have taken place or I can wait for one or two to give me a steer.
  2. Wait for the first race or two and if one or both races have shown a strong bias, take the contrarian view and focus on what looks to be the unfavoured side. Bookmakers will be aware of the previous races and are likely to shorten up the expected ‘favoured’ side and push out prices of those drawn on the presumed unfavoured side. If the bias flip-flops, as mentioned earlier that it can do, then we have secured have excellent value. This is a risk-reward approach.
  3. Back horses on either flank – one high, one low. Or if the field is in the mid-20s or higher I often play two either side. Alternatively, I go one high, one low, one middle. This is a hedging approach and I probably use this method the most taking the view I have more options covered and can still get value prices backing three or four runners due to the big field sizes.

Certainly 2023 was high draw friendly at Ascot on the straight course. If we look at all handicaps across the year with 14 or more runners we see the following draw splits:


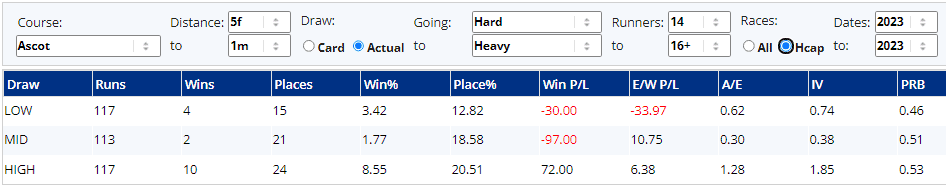
As can be seen, high draws dominated the win strike rate, the P/L bottom line, PRB, A/E indices and Impact Values.

Will high draws dominate in 2024? Only time will tell. However, with big fields we should be able to get some value prices especially if the draw turns out to be in our favour.


Brighton 1 mile

Two years ago, when I wrote a series of articles on the draw, I mentioned the 1-mile Brighton bias in the third article. At the time, I had not previously been aware of this bias. In that piece the draw data from 2016 to 2021 suggested that high draws held an edge with low draws being at a disadvantage. Looking at the 2023 figures for handicaps with 8+ runners we see the following:


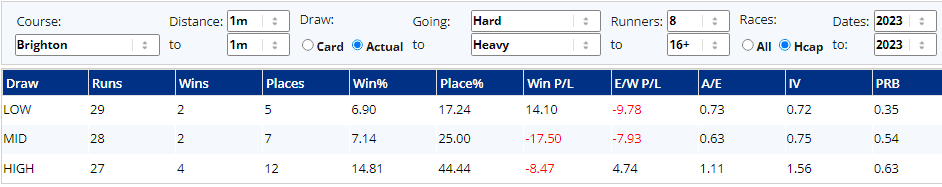
Obviously, the sample size of eight races is tiny, but the PRB figures are especially potent in terms of suggesting a bias still exists. Indeed, combining last year’s results with 2022 we get a bigger sample and the same pattern:


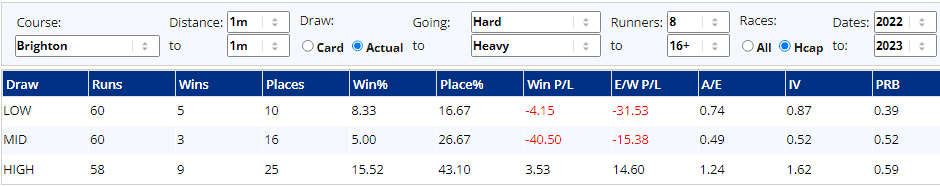
So, in the two years since sharing the high draw bias with Geegeez readers, we can see nothing appears to have changed. In fact, one could argue the bias looks slightly more pronounced. There are two additional findings I would like to share. Firstly, horses drawn 11 and higher have a PRB figure of 0.65 over this 2-year period. Secondly, if you had permed the highest three draws in combination forecasts you would have secured an 18.63-point profit.


Catterick 5f

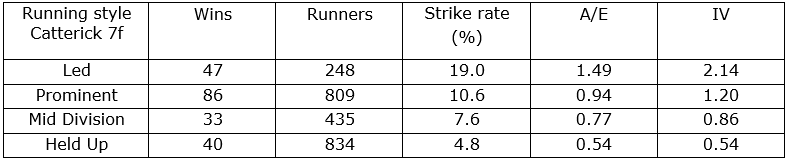
About 15 to 20 years ago Catterick offered draw punters two biases – a low draw bias on good or firmer, and a high draw bias on soft or heavy. These days, for whatever reason, the low draw bias on firmer ground does not seem to exist. However, when the going gets soft, higher draws still have an edge. This is because the ground is better the wider you go in the straight. There have only been seven qualifying races in the past two seasons, but the figures strongly favour high draws as the table below shows:


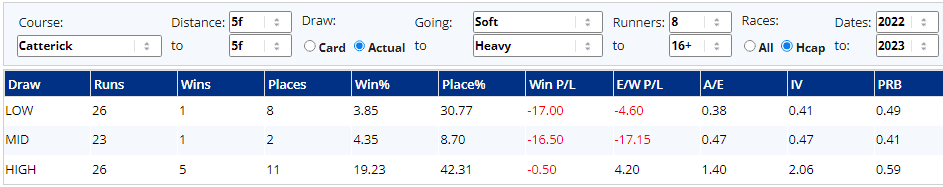
Five of the seven races have been won by high draws, with good correlation across the A/E indices, Impact Values and the PRB figures. A good example of how strong the bias has been under these conditions can be seen by looking at the result of the Millbury Hill Country Store Handicap which took place on October 25th 2022:


As you can see the first three home were drawn in the top three stalls, the first five home were drawn in the top five stalls, the top seven home came from the top seven stalls, and those who finished in the final five spots from 8th to 12th came from the lowest five stalls.

Going further back in time to give us a bigger sample (2016 to 2023), we see the following:


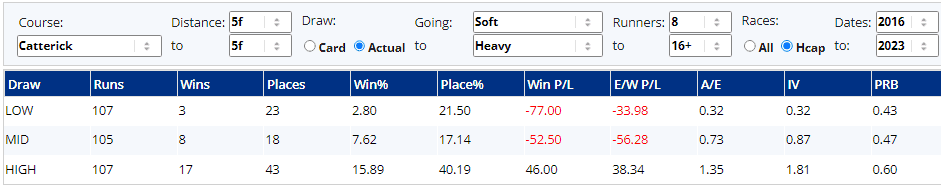
These figures indicate that soft ground bias at Catterick over 5f gives punters a playable bias to work with. Indeed, you could have backed the highest three draws ‘blind’ over these 28 races and secured a profit to SP of £27.00 (ROI +32.1%); to BSP it would have been £43.44 (ROI +51.7%).

Before moving on, let us look at a smoothed-out graph of stall positions based on PRB figures from soft/heavy 5f handicaps from 2016-2023 using the Geegeez metric PRB3:


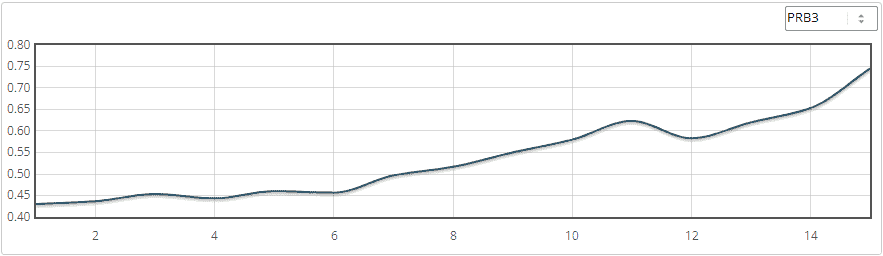
This gives us excellent correlation with all the other stats for this C&D on soft/heavy clearly showing the bias.


Goodwood 7f

Goodwood was the first course I ever visited in terms of going racing and I fell in love with it then and still love it to this day. I have been there more times than all other racecourses combined. Back in the 1990s I made huge profits in 7f handicaps as horses closest to the inside rail enjoyed a massive edge. Course officials eventually cottoned on to the bias around 2005/2006 and they have managed to even the playing field to some extent since then. However, low to middle draws still tend to hold sway with very highest draws finding it difficult to win. If we look at the last two years the 8+ runner handicap splits are as follows:


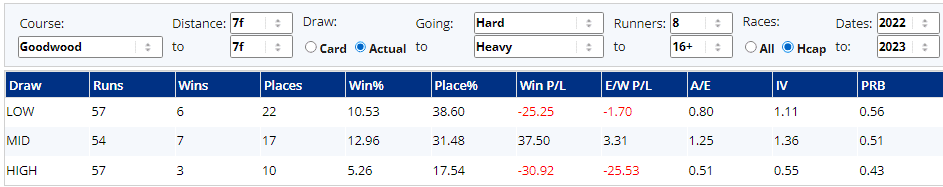
During this time frame middle draws have edged it in terms of wins and have secured decent profits. Low draws have performed well in terms of places, and they comfortably have the highest PRB figure. Now some people looking at these stats will acknowledge that higher draws seem at a disadvantage, but they may dismiss it as a course where the draw bias is not potent enough to be of interest. However, I would like to compare the performance of horses drawn 1 to 6 with those drawn 7 or higher:


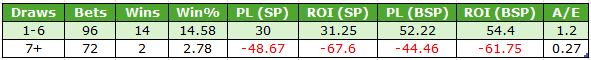
This data seems to demonstrate there has been a strong draw bias at work in the past two seasons. It also demonstrates that as punters it is worth analysing data in different ways to build the most accurate picture we can. This is especially true when we are looking at small to medium sized samples.

Before moving on here are the basic draw splits for Goodwood 7f handicaps (8+ runners) since 2016:


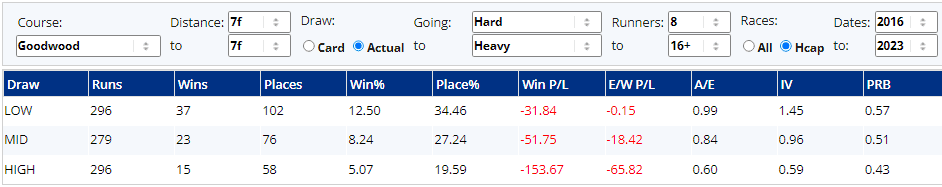
This longer-term data set shows that the bias is something that we do need to consider.  The value lies with lower draws as they have provided roughly 50% of all winners (from 33.3% of the total runners) although one still needs to find the right horse(s) as they are not profitable to follow blindly.


Gowran Park 7f

Over to Ireland now and the 7f trip at Gowran Park. This course and distance was highlighted in the same draw series of two years ago showing a decent low draw bias especially on good or firmer going. Since then we have had 15 more qualifying races similarly quick turf with the following draw third splits:


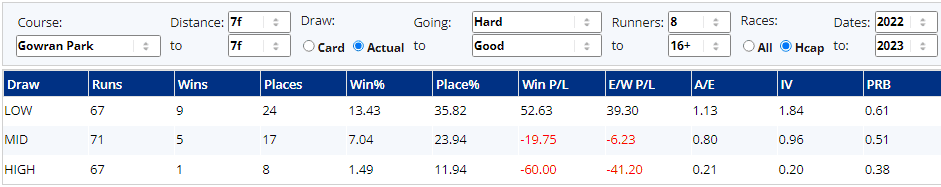
Those are strong figures, backing up the data shared previously. To save you having to scroll through past articles here are the 2016-2021 stats I shared then.


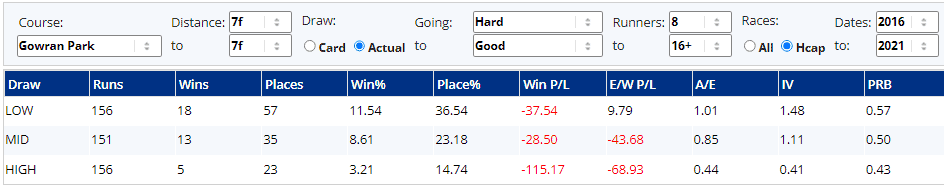
Again, we can see excellent correlation between both tables: not only have low draws enjoyed a strong edge, but higher draws have had a very poor time of it. In fact, combining all horses that were drawn 9 or higher in the past eight seasons under these conditions would have seen just six wins from 260 runners! Losses of 71p in the £ to SP just underlines the difficulty these higher draws have.

For fans of perming lower draws in forecasts, you would have made hay in 2023 thanks to one race. The first division of the Coast to Curragh Charity Cycle Handicap on 16th August 2023 saw The Fog Horn (drawn 1) win with Kodihill (drawn 2) coming second. A £1 reverse forecast on these two lowest draws would have yielded a monumental return of £976.71; the reverse exacta would have paid even more at an eye-watering £1674.50 return for a £2 stake.

Gowran Park is a course where I will be looking for draw-based opportunities in 2024.


Pontefract 1 mile

This mile trip at Pontefract has offered a strong low draw bias for many years now. Over the past two seasons there have 28 handicaps with 8+ runners, of which half of them (14) were won by one of the three lowest stalls. Here are the draw results for all stalls during this time frame:


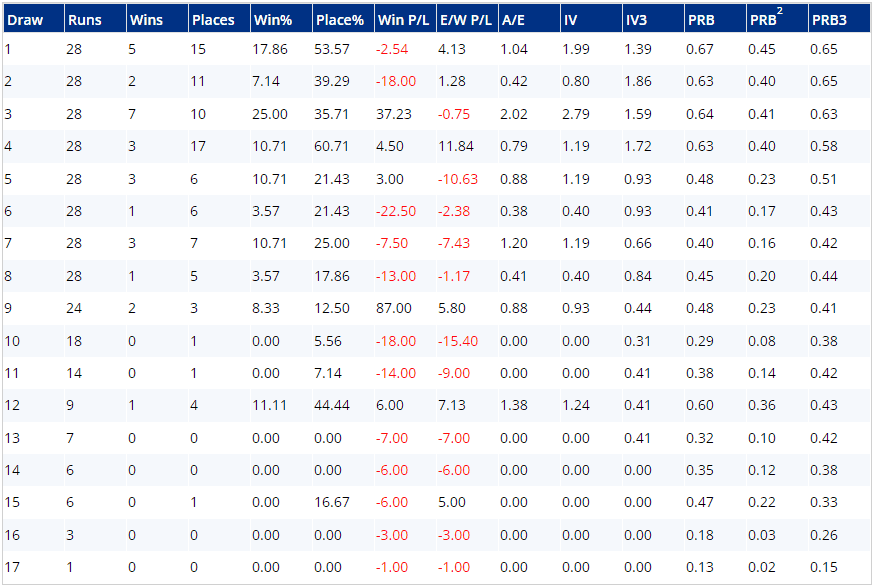
These results clearly show the strength of the bias – just look at the PRB figures and the placed percentages for the lowest draws. If we include stall 4 with the bottom three stalls, we get the following splits in terms of placed percentages:


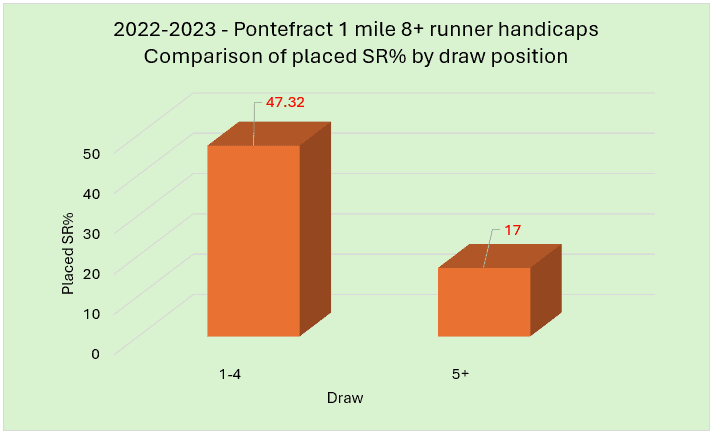
That is getting close to three times the number of placed runners from the inside four stalls. In terms of PRB figures the difference is equally significant:


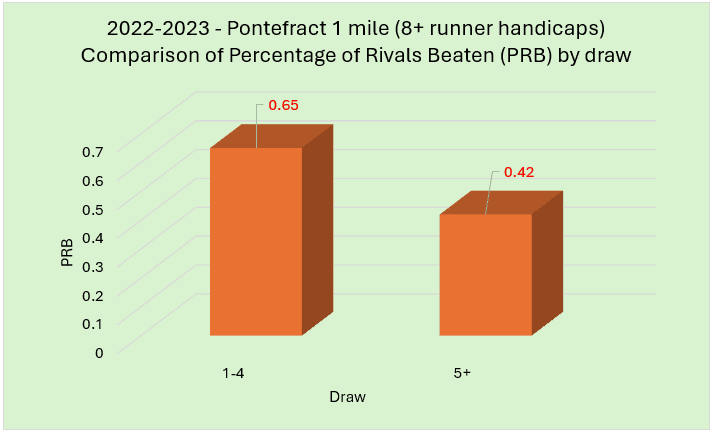
My strategy over this track and trip has long been to focus on the lowest draws. I have tended to concentrate on stalls 5 or lower, with the lower the better. The good news from a punting perspective is that the market has still not adjusted fully and there remains some value to had with these lower draws.

*

I hope this article has shown you that draw bias is still alive and well albeit at a handful of course and distances. This is not an exhaustive list but hopefully there has been enough here to give you some useful and profitable pointers for the season ahead.

- DR

Catterick Draw & Pace Bias

Racing at Catterick racecourse dates back to the mid 17th century so this North Yorkshire circuit is steeped in tradition, writes Dave Renham. It is a left-handed undulating track that is considered quite sharp: its circumference is a mile and a furlong with a run in of around three furlongs. Races over five furlongs start from a separate chute with a shallow turn into the home straight; all other races are raced on the main round course.


As with previous articles in this series I am using some of the tools available on the Geegeez website, those being the Draw Analyser, Pace Analyser and Query Tool. The main data set covers 11 years from 2009 to 2019, but as usual I will also examine a more recent grouping (2015 to 2019) where appropriate. The focus is once again on 8+ runner handicap races.


Catterick 5f Draw Bias (8+ runner handicaps)

Since 2009 there have been 151 qualifying races over the minimum distance. Here are the 11 year stats:

An even looking split with lower draws faring marginally best. Looking at the A/E values, these show a correlation with the draw win percentages:

The 5f trip at Catterick did display a relatively strong bias around 15 years ago for five or six seasons. I will use the five-year comparison data method I used in recent articles to illustrate how the bias has changed over the years. To recap, using five-year datasets is a way to try and compare stats more effectively than simply looking at the figures for single years. This method also highlights whether/when patterns are changing, as well as giving more reliable sample sizes. So here are the Catterick 5f figures going right back to the first data set (1997 to 2001):

I have highlighted in green where the low draw bias seemed prevalent from 2004 to 2009. The bias coincided with a significant increase in the number of races and personally I did well during this period. During these six seasons, if you had permed the three lowest drawn horses in 6 x £1 straight forecasts you would have been in profit to the tune of £401. If just concentrating on the two lowest draws and having a reverse £1 straight forecast in each race (2004-2009) profits would have been £340 – not bad considering the outlay would only have been £124 and you would have got that £124 back too.

Perming favoured draws is something that can still make you money today but there are seemingly less opportunities. Having said that, despite low draws not dominating like they did 15 years ago, in the past eleven seasons you would have still made a profit by perming the two lowest draws in reverse forecasts, and quite a profit: £539 to be precise!

There were eight winning forecasts over the 11 years and four of the dividends were decent creating the sizeable returns. In addition, from 2009 to 2019 if you had also permed the three lowest draws in 6 x £1 tricasts you would have secured four winning bets producing a profit of £1160. Admittedly there was one winning tricast in excess of £1000, but that is what tricasts can pay. Exotic betting using draw positions is a patience game but with huge potential for relatively small individual race outlays.

Looking at the 2009-2019 data the most important factor in terms of the draw is ground conditions. The going does seem to make a significant difference to draw bias, so let us look at the results for races on good or firmer going. There have been 81 races which have provided the following draw splits: 

Lower draws have a clear advantage when the ground rides good or faster with high draws at a fairly significant disadvantage. Draws 1 to 5 have been roughly 2.5 times more likely to win than draws 6 or wider.

The A/E values for these ground conditions correlate clearly too:

As you probably have guessed by now, the bias seems to switch when the going gets softer. There have been 70 races under softer conditions with the following draw results:

Under these conditions high draws have the edge. The A/E figures back up the draw stats:

What seems to happen when the going gets softer is that the ground closest to the far rail becomes slightly slower than the middle to stands side of the track. A good example of the high draw bias came on 19th August 2019 in a race won by The Grey Zebedee on soft ground. All the horses stayed away from the far rail and most made a beeline to the nearside and the stands’ rail. If you watch the race it is easy to understand why five of the first six home were drawn 11 (1st), 10 (2nd), 14 (3rd), 13 (4th) and 15 (6th). Watching races is important and as a statistician I do appreciate that numbers alone do not always tell the complete story.

One has to be careful, however, and we cannot blindly assume low draws have little chance in soft conditions, as there will be occasions when the far rail is not slower for whatever reason. Indeed in a race won by Count Dorsey on 19th October last year the far rail was actually quicker that day with the first four home drawn 3, 4, 2 and 1. Again, it is not just the numbers that suggest this; if you watch the race the ground next to the far side rail is clearly quicker.

This race actually is important to mention from another draw angle, something I first read about back in the 1990s. The angle is ‘negative draw bias’, a phrase I believe was coined by none other than new Geegeez writer, Russell Clarke. Negative draw bias looks to highlight horses that have run well from a poor draw with a view to possibly backing them next time, or certainly within the next three races.

In this race dominated by low draws the horse who finished fifth, Teruntum Star, was drawn 12 and did best of the horses that raced in the centre of the track. Not only that, but the race was dominated by horses which raced close to the pace, and he was 13th heading into the final two furlongs. Moreover, he lost momentum and ground when having to switch around three horses in the final furlong. Thus, Teruntum Star was a horse that had run well having been disadvantaged by the draw, but also by how the race was run. Six days later Teruntum Star hosed up at Newbury, winning by two lengths at a tasty price of 14/1.

It is time now to look at each five furlong draw position broken down by individual stall number for the 11 seasons. I use the Geegeez Query Tool to give me the relevant data:

As you might expect given the shifting ground-dependant nature of bias there are no real patterns here, so actually it makes more sense to look at this individual draw data by splitting it into good or firmer results and then good to soft or softer results. Let’s look at the individual draw figures for races run on good ground or firmer:

A blind profit for draws 1 and 2, and the A/E values for draws 1 to 5 help to further demonstrate the low draw advantage on faster ground. This is a definitely a better way to the view Catterick’s 5f individual draw stats.

The individual draw positions on slow ground (good to soft or softer) are below:

Again this paints the picture I was hoping it would: profits for draws 12, 13 and 14 backing up the fact that in general higher draws are favoured under these softer conditions. For the record the three highest stall numbers (not necessarily 13, 14 and 15 of course) won 2.25 times more races than the bottom three draws.

Onto a more recent data set looking at the past five seasons (2015-2019). Here are the draw splits for the 70 races that have occurred during this time frame.

These figures match the 11 year data very closely, as do the A/E values which are all within 0.01 of the long term stats.


Splitting by going over the past five seasons also matches the long term figures:

Catterick 5f Draw Bias, 8+ Runner Handicaps, Good or firmer (2015-2019)

Catterick 5f Draw Bias, 8+ Runner Handicaps, Good to Soft or softer (2015-2019)

So, from what appeared to begin with when looking at the initial 11 year draw stats to be a course with little interest, Catterick’s five-furlong trip is of clear note to the draw punter. I did investigate whether field size made any difference but the data is virtually identical for when comparing smaller fields to bigger ones.

Catterick 5f Handicaps (8+ Runners) Pace Bias

Let us look at pace and running styles now. I have always considered the 5f trip at Catterick to offer a strong front running advantage so let’s see if the stats back up the theory. The overall figures (2009-19) are as follows:

In terms of UK turf courses, 5f handicap races at Catterick show one of the strongest front-running biases of all. from an A/E value and win percentage for front runners perspective, it comes out as the sixth highest; and the IV figure sees it as the fourth highest (for more on A/E and IV, read this post). In addition to that, hold up horses have one of the worst records amongst all UK courses too: hold up horses at the Yorkshire track have the fourth worst win percentage, the fourth worst A/E value and the fourth worst IV figure.

If we look at the effect of going it seems that softer ground (good to soft or softer) slightly increases the win prospects of front runners:

Conversely, on good or firmer ground front runners have fared slightly less well, though they retain a very clear edge:


One cannot be 100% confident that softer going increases the front running bias, but such ground conditions are at least unlikely to negate the front running edge. What is clear is that, regardless of going, you’d rather be watching the race having backed the horse that has taken the lead early than a horse racing in rear.

Looking at field size data there seems to be little or no evidence that number of runners makes any difference to the pace bias.

Finally in this 5f section a look at draw / pace (running style) combinations for front runners over the minimum distance. Remember, this is looking at which third of the draw is responsible for the early leader of the race (in % terms). I would expect the early leader to be drawn lower more often rather than higher:

As expected horses drawn further away from the far rail struggle to get to the lead early. Having said that, of the 23 who have managed it nine went on to win with another eight managing to place. Hence, it seems that it is possible to lead all the way from a wide draw given the chance. For hold up horses it seems an even worse scenario if you are drawn low – just 3 wins from 140 runners (SR 2.1%). Indeed only a further 13 managed to hit the frame which means over 88% of all low drawn hold up horses finished 4th or worse.

Here is the draw/pace heat map sorted by percentage of rivals beaten:

So the Catterick 5f distance is extremely interesting from both a draw and a pace perspective. Considering the even looking draw data shared at the beginning of this piece, I think several useful pointers have been uncovered.


Catterick 6f Draw Bias (8+ runner handicaps)

The six furlong trip is on the round course, starting halfway down the back straight, and from 2009 to 2019 there had been 133 races. Here are the draw splits:


Some even looking figures with middle draws doing slightly better than the rest. Let’s see if the A/E figures offer better pointers:


There is reasonably good correlation here, but it does seem that lower draws are slightly overbet. This makes some sense as the nature of the track being left handed would theoretically offer inside draws (low) a slight edge. For whatever reason this is not the case.

Looking at statistics for the going, the figures remain constant regardless of ground conditions. On softer ground, as with 5f races, the near side generally rides quicker than the far side. Horses more often than not come middle to stands’ side in the straight in these easier conditions, but the higher draws seem unable to take advantage of it due to the turning nature of the trip.

In terms of field size, the maximum number of runners is just 12 so there is nothing to add on that score.

A look at the individual draw positions now:

I must concede that I had not expected the individual draw data to be of much interest, but draws 6 to 8 are all in profit coupled with decent looking A/E values. This table does suggest there may be some value in that area of the draw. Draws 10 and 11 have also proved profitable, while draws 1 and 2 have both incurred significant losses (roughly 44 and 51p in the £). Those profits are backed up by increased win and place percentages.

It is unlikely the more recent data will paint a different picture but here are the stats from 2015 to 2019:

76 races is a decent sample and middle draws are best once again with a slightly higher win percentage in the last five years compared to the last 11 years.

Onto the A/E values for 2015-2019:

The middle third once again boasting a value figure of 1.00 or more which is a positive.

Now a look at the individual draw figures for this latest five-year period. It will be interesting to see how stalls 6 to 8 have fared over the shorter time frame:

Draws 6 and 7 have proved profitable in the win market over the past five seasons, while stall 8 has essentially broken even (did make a small each way profit). Once again draws 1 and 2 have lost decent sums, as have draws 3 and 5.

Catterick 6f Pace Bias (8+ Runner Handicaps)

Let us now turn to pace and running styles. Here are the overall figures going back to 2009:

These figures show that front runners have an edge of a similar degree to the one enjoyed by pace setters over 5f, albeit slightly less potent. However, we know that front running pace bias is generally stronger at five furlongs than six, and essentially this bias is a strong one for the distance. In terms of win percentage, Catterick’s front runner figures rate as the third strongest amongst UK turf courses (6f), while the A/E value puts this course and distance in fourth overall.

In terms of going, there does seem to be more of an edge for front runners on better ground. Let us examine the stats for 6f handicaps run on good going or firmer:

These are some impressive figures for front runners, which win close to one in every four races; meanwhile, hold up horses are at the opposite end of the scale winning less that 5% of the time on quick ground.

Onto good to soft or softer going now:

Prominent runners have an equally good record to front runners on this easier ground, but it should be noted that it seems even more difficult to win if racing mid-pack or at the rear early.

The penultimate tables in this 6f section looks at draw / pace (running style) combinations for front runners in 6f handicaps (2009 – 2019). I would expect lower draws to lead more often than higher ones simply due to the left handed configuration:

Higher draws do lead least often, but it is interesting to note that middle drawn horses have got to the lead slightly more often than lower drawn horses closer to the inside rail. It is also worth noting that hold up horses drawn low, just like at 5f, find it virtually impossible to win – just 4 have prevailed from 146 such runners.

Finally a look at the draw/pace heat map for Catterick's six furlongs, again sorted by percentage of rivals beaten (PRB).

The messages already shared are underscored by this image. Front runners have a solid edge almost regardless of draw, though those drawn middle to wide fare best of the trailblazers. Hold up horses have a lot to do, especially when drawn inside.

In summary, 6f handicaps at Catterick offer real interest from a pace perspective. Front runners enjoy a powerful edge which is strongest on good or firmer ground. Hold up horses have a very poor time of it. In terms of the draw one could argue there is some value in horses drawn in the middle with stalls 6, 7 and 8 seemingly best.


Catterick 7f Draw Bias (8+ runner handicaps)

The seven furlong trip is raced on the round course with low draws once again positioned next to the inside rail. 209 handicap races have been run with 8 or more runners since 2009. Here is the draw breakdown:


Clearly 7f is a very level playing field in terms of the draw. Onto the A/E values:

As with the 6f figures, A/E suggests that low draws are marginally overbet.

Field size potentially makes a small difference with very high draws finding it slightly harder to win. Races of 13 or more runners give these figures:

In truth however, it is nothing to write home about.


Ground conditions also offer no notable edge so let's move on to the individual draw positions:

Nothing clear cut although draws 7 and 8 have again secured a blind profit.

Time to check out more recent data, from 2015 onwards. There have been 88 qualifying races since the start of 2015, giving the following draw breakdown:

This shows a very similar perspective to the 11 year stats with a level playing field in terms of the draw. Below are the A/E values, which correlate well with the draw figures:


Onto the individual draw positions for the past five seasons:

Again, there is nothing clear cut although both draws 8 and 9 have secured a profit. Ultimately, it is probably fair to say that there is little interest from a draw perspective over Catterick's 7f trip.

Catterick 7f Pace Bias (8+ Runner Handicaps)

Onto pace now, and first a look at the overall pace data now (2009-2019):

The 7f distance does has a decent front running bias which, considering the lack of draw bias interest, is pleasing to report. As with the 5f and 6f trips, hold up horses really struggle.

Looking at how the going affects the results, and as with the 6f trip it seems that front runners over 7f do better when going gets firmer. Let me look at the stats for 7f handicaps run on good going or firmer:

The win percentage for front runners is again high, edging close to 23%.

As expected, on good to soft or softer front runners perform less well:

There is still a small edge for front runners but it is essentially only moderately significant.

A quick look at the impact of field size in 7f handicaps: in smaller fields over 7f (8 to 10 runners), the front running win percentage is 23.3% (A/E 1.62); in races of 13 or more runners the win percentage is 13.9% with an A/E of 1.37. So smaller fields are slightly better from a front running point of view.

Before closing, a look at draw / pace (running style) combinations.

First, the split for front runners in 7f handicaps (2009 – 2019):

Lower drawn horses are more likely to get to the front early. As with 5f and 6f races, low drawn horses that are held up have a poor record, this time notching just 10 wins from 259 runners (SR 3.8%).

Here is the draw/pace heat map through the prism of PRB:

The seeming irrelevance of draw is matched only by the consistently gradual impact of run style, from led (best) and prominent to mid-division (no edge) and held up (notably under-perform).

*

Catterick is a strongly pace-orientated track where handicap races from five- to seven-furlongs see front runners having much the best of it. Hold up horses really struggle and this is accentuated if they happen to be drawn low.

Indeed, of the 548 horses held up from a low draw in 8+ runner handicaps over seven furlongs or shorter since 2009, just 17 (3.1%) managed to win.

Specifically at five furlongs, the going is key from a draw perspective, with low dominating on good ground or firmer, and high faring best on softer ground. Over six furlongs, middle draws may have a slight edge, while over 7f there is no draw bias - though still a pace bias - under any conditions.

- DR