How to Compose a ‘Horses to Follow’ List
I am guessing that around 70% of the people reading this bet on horses on a regular basis, writes Dave Renham. By ‘regular basis’, I mean either daily or weekly. Regardless of how many bets you may have in a day, week, month, year or lifetime, the aim for the majority is probably to be profitable. Plenty do it just for fun and if they make a few quid from time to time that’s a bonus. And the smart ones combine those two reasons: profit, and fun.
For me I put myself mainly in the first category. There are two reasons for this, firstly a sense of arrogance, I guess; wanting to prove myself and outwit / outcompete the bookies. Secondly, I like having more money. Simple as that!
Introduction
To achieve the goal of long-term profits we all follow a slightly different path, not just in terms of how many bets we average a week / year but in how we go about the process. I think time is one of the biggest factors for many. It certainly is for me – gone are the days when I was able to spend all day, every day solely devoted to betting. I did that for roughly six years straight when I was running a tipping service from 2001 to 2007. I was in my mid-thirties when these 12-hour days dedicated to horse racing and betting was the norm. Nowadays, the thought of a 12-hour shift just makes me feel tired! Not only that, but I also cannot devote that sort of time to it even if I wanted to. Alongside my life in racing, I teach private online Maths lessons, have family commitments, etc, etc.
As it stands, at this point of my life, I would guess that on average there are probably three or four days in the week where I can give some time and thought to betting. That may be 4-5 hours on any given day, that may be as little as an hour. Hence, I have had to adapt my betting methods from those I employed between 2001 to 2007. Back then I focused on 5f to 6f sprint handicaps, as well as the occasional 7f contest. I would analyse every single qualifying race in significant depth. Some races would offer up bets, some would not. Spending a few hours on one race is fine if you can pinpoint a value selection – not so much fun when you can’t!
Fast forward around 20 years, and my pathway to finding bets is somewhat different. In the rest of this article, I’ll share some of my approach…
I wonder how many readers keep a list of horses to follow. That is something I have always done, but now I am far more reliant on it than I was back in the day. In fact, it has become the first thing I look at on the days when I have time to analyse some races. If I have a horse to follow declared to run, then my first port of call will be to look at the race in which it is running and assess its chance. If I have no daily qualifiers from my list, I will head to my ‘comfort blanket’ of shorter distance handicaps, looking primarily for any race where there is potentially a run style bias, a draw bias, or ideally both.
Going back to my horses to follow list I am going to share what types of things I look for in terms of how a horse can make it on to my list.
Horses that run well against a pace bias (Negative pace bias)
This type of idea is something I discussed in a two-parter for Geegeez back in November 2020. Here’s part one, and here is part two. In the article I picked ten races which seemed to show a pace bias and looked at the subsequent performance of horses that had ostensibly run well against the bias. The research for those two articles inspired me do much more digging. After writing those pieces I spent a few months fine tuning what I will call my negative pace bias method, and by April 2021 I was using it to highlight horses to follow for my personal betting.
In terms of determining a race which has the potential to throw up pace bias qualifiers that could make my horse to follow list, I use just two methods, both of which rely on a basic criterion or starting point. I want to share one of these ideas with you and my ‘in’ in terms of looking for this group of qualifiers is as follows:
- Race distance of 5f to 7f
- Race must be handicap with at least 10 runners
- The first three finishers must have either been given pace abbreviations of L or P, or first three must have been given pace abbreviations of M or H.
On the third point, this stipulation allows me to explore two pace scenarios. Firstly, when there is bias to more prominent racers; and secondly an off the pace bias when mid-pack or hold up horses fill out the first three placings.
This initial starting point means I can trawl through recent results to find some qualifying races. It does not mean I will find a horse to follow in every race that passes my basic criterion. However, permit me to walk you through one example that did. It was a 7f 10-runner handicap at Southwell from January last year. Here are the first seven finishers with comments in running, run style (RS) abbreviations and sectionals:

As you can see, the first three home raced close to or up with the pace (see 'RS' (run style) column - L, P, P) as indeed did the fourth placed finisher. Another thing to note is that in terms of positions given from the running lines (the set of five bold font numbers - in-race position - and superscript - distance behind the leader/ahead), all four of these runners maintained a position in the top four throughout.
A further key fact staring us in the face thanks to the sectional data was that the first part of the race was slow (note the blue colours in the left hand side 'blobs' and especially in the first race blob above the result. Generally, if the early pace is slow in a shorter race, then those positioned near the front have an even greater advantage than usual. It means that in these early stages they are not exerting themselves too much and thus they can be expected to have more in the tank at the business end of the race. This makes it harder for horses in midfield or at the back early in the race to pass them late on. That certainly seems to have been the case here and the final telling sign is that, according to the sectional blobs, the final two furlongs were run FAST or VERY FAST compared with par, suggesting there was indeed plenty in the tank for those horses that had raced prominently.
All the pointers in this race suggest that the first four home were strongly favoured by how the race was run in terms of pace. Titan Rock, on the other hand, which finished fifth, was not favoured by how the race was run. He was held up early in 8th, maintained a similar position for much of the race before finishing fastest of all in the last two furlongs. Not only that, he ‘took keen hold’ early which would have expended some additional energy. He finished best of the midfield/held up runners and was a horse that I felt had run well against a pace bias. Another positive was that, priced 22/1, he had also outrun his odds. He was a horse that I put on my horses to follow list.
Zip, who finished 6th, and Witch Hunter, 7th, were also of interest as both were settled off the pace early; and Titan Rock only beat Zip by a nose, who in turn was only a neck in front of Witch Hunter at the line. Zip had been favourite, so I downgraded his run a little as he was unable to make up any ground in the final furlong or two. Witch Hunter was of more interest than Zip because he, like Titan Rock, had been keen early, but had also been forced to switch left two furlongs out losing him some vital time. Hence Witch Hunter made my list as well as Titan Rock with Zip missing out.
Now we are all familiar with the phrase Sod’s Law... well, Zip won on his very next start at the juicy price of 11/1. So, I potentially had missed out on a big priced winner having failed to put him on the list. In better news I backed Titan Rock on his next two starts, which are shown below along with that original Southwell run:

A win at 13/2 arrived two runs after Southwell - when racing closer to the pace – that did help ease the pain of missing out on Zip’s win! Witch Hunter on the other hand was less of a success from a personal perspective. Here are his next seven runs and once again I’ve included the original Southwell result at the bottom:

As you can see Witch Hunter did eventually get his head in front at the huge price of 50/1 (7 runs and 5 months after Southwell), but I had removed him from my list by then. I ended up backing him on his next four runs, hitting the post twice at 5/2 and 14/1. I kept him on the list despite a poor 20th out of 22 showing at Doncaster. This is because he had never raced on heavy ground and was trying a mile for the first time. In hindsight, maybe I should have skipped this race and waited for the next one.
There is no fixed number of races a horse will stay on my list. Having said that, it is rare that I retain one for more than three or four runs. Likewise, I will not back every horse to follow that is declared to run. I will put my money down if I perceive the horse to offer me value.
In many respects it would be much easier if I had a hard and fast rule that stated, for instance, that any horse on my list to follow should be backed three times and then removed from the list. However, for me, that becomes more systematic which is not how I operate. That might be an idea for some – it would certainly save time and help with discipline; but I still like individual race analysis and trusting my judgement.
I could offer many more examples of horses that have ended up on my list via the pace bias route – some winning soon afterwards, others not. As with any approach it is not bombproof. The decision about the races you pick and the horses you list are personal to you. That's part of the fun!
I have been using this method for nearly three years now and it is one I will be continuing to use in the coming months and years, which probably tells you that I think it is a worthwhile one!
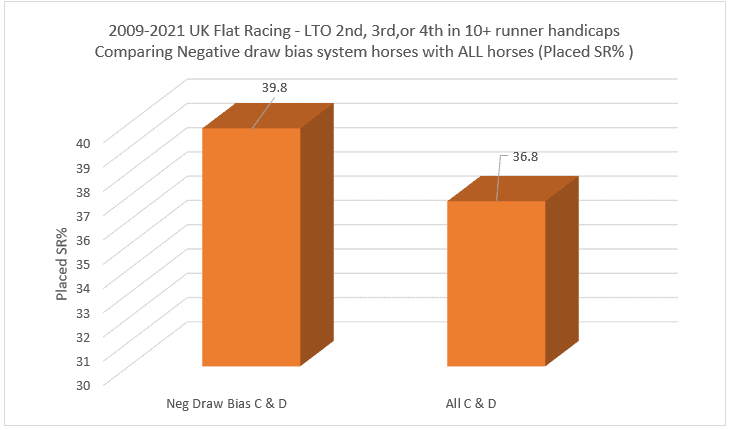
Horses that run well against a draw bias (Negative draw bias)
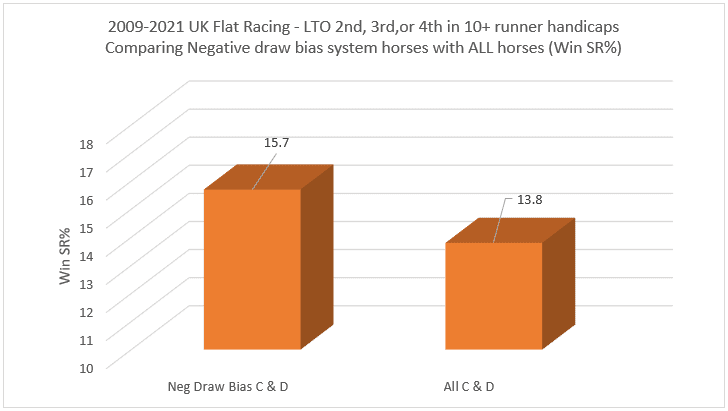
Negative draw bias attempts to highlight a horse or horses that ran well from a poor draw and hence in theory have run better than their finishing position may have initially indicated. Essentially, this is using the same premise as I did with horses that had run well against a pace bias.
I discussed the general theory of negative draw bias before back in May 2022 and, despite writing about it there, I think it is important to emphasise that this idea continues to produce future winners on a regular basis. Now, draw bias per se is not as potent as it once was and much, if not all, of the value has gone in terms of backing well drawn horses. However negative draw bias is alive and continues to kick and I want to keep it firmly in the minds of readers as you can definitely profit from this. Allow me to share with you how I pick what makes it to my horses to follow list.
There are two ways a horse could be flagged up on negative draw bias. Firstly, horses which run well from a known poor draw, for example a horse drawn 10 at Chester over 5f finishing within a length or two of the winner. And secondly, a race where the numbers seem to indicate one side of the draw was strongly favoured. This primarily occurs on straight courses with big fields (circa 15+), usually when such races see the field split into two or more groups.
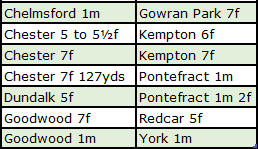
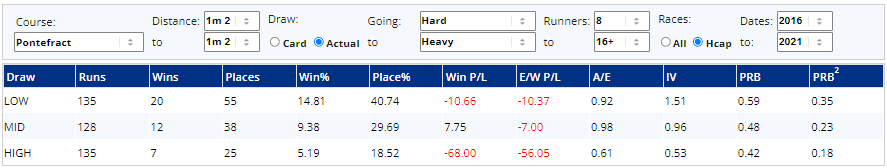
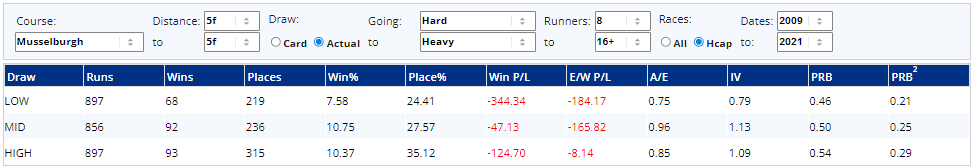
Let's look at the first one – horses that run well from a 'known' poor draw. The criterion for 'poor draw' varies from course to course and distance to distance. For example, at some track/trip combinations a horse drawn 10 or higher is drawn poorly, at others a horse drawn 7 or higher is drawn poorly. I use a small but select band of course and distance pairings, namely:

As with the pace bias races, I tend to stick to handicaps and in general the bigger the field size the better. In terms of distance beaten or finishing position for potential list qualifiers, it depends on the individual race and my perception of the strength of the bias.
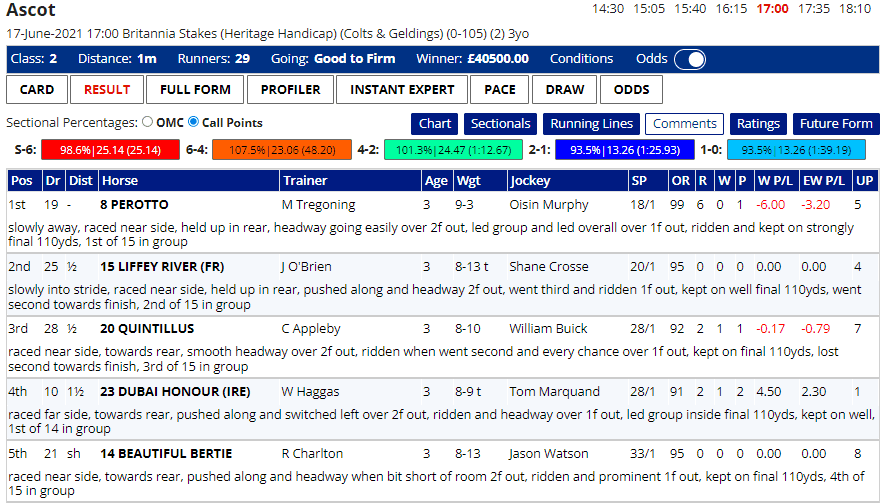
The second approach takes longer to establish potential list qualifiers as I need to examine every big field handicap to see if one part of the draw has seemingly been strongly favoured. Below is a race where I found three horses that made it to my horse to follow list:

This was a Chester sprint over five and a half furlongs, so low draws tend to be well favoured. The first horse that caught my attention, then, was Evocative Spark who had started from stall 8. Chester sprints I always re-watch a few times on video, and I watched this race back at least five times viewing different horses. I don’t always check the race video regarding potential list making horses but track position at Chester can be crucial due to its very tight nature.
Horses drawn 8 or wider at Chester over 5½f have a PRB figure of around 0.41, so the 8 post for Evocative Spark in this field of eleven was a poor one. Also, the horse finished really well having been short of room – he was the fastest horse in the final furlong (note his 1-0 split of 12.26s). This was a definite for my list. Likewise, Count D’Orsay, who finished a neck behind Evocative Spark in 5th was drawn even worse in 10 (DR says 12 but stalls 9 and 10 were non-runners). Not only that but he raced wide losing important ground on such a tight track. He also finished very well (3rd fastest horse in final furlong clocking 12.41s) and he too made my list.
There were two other horses I considered, the first of which was Dare To Hope. Draws 1 to 4 are by far the best draws here so the 7 box for Dare To Hope I still classed as a negative. He ran better than his finishing position of 7th suggested, but not quite well enough to make my list. The other horse I considered was the winner Call Me Ginger. It is rare that I will consider a winner as a potential horse to make my list but, having watched the race a few times, I realised that Call Me Ginger was value for more than his winning margin. Starting from stall 6 he ended up racing three wide most of the way before being shuffled about seven horses wide on the final turn. He ran much further than ideal so I reckoned that if he hadn’t been wide for so long, he would have won by two or three lengths rather than a short head. Hence, Call Me Ginger was the third horse to make my list from this race.
So, what happened in subsequent races? I’ll start with the horse that didn’t make my list, Dare To Hope. Next time out, having been dropped 2lbs in the weights, he finished second at 17/2, before winning two starts later at 14/1. This is a bit of déjà vu – first Zip and now Dare To Hope!
Meanwhile, Evocative Spark came out next time and won easily.

However, before readers pat me on the back, I did not back the horse as I was put off by his draw in 9. A wide draw over 7f is not as bad as over 5½f but it was enough to put me off. The words ‘missed’ and ‘boat’ spring to mind once more.
In happier news, Call Me Ginger was back racing seven days later at Ascot and I did back him: he won at 11/2.
Count D’Orsay came second in his next two starts, both of which carried my money. I backed him one more time, but he finished 8th and was taken off the list.
*
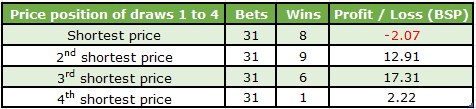
Let's now switch to big field handicaps where a draw bias has seemingly occurred, and there were three similar examples at Royal Ascot last year: two on Friday and one on Saturday. The first race indicating a strong draw bias was the Sandringham with the first ten horses home as follows:

The draw seemed to play a huge role in the outcome of this race with the first seven home drawn 25, 16, 18, 24, 20, 29 and 19. High to middle draws totally dominated the finish and the first seven all raced on the stands’ side (near side). Magical Sunset (drawn 5) and Lady Alara (drawn 3) were the first two home from the low draws on the unfavoured far side. This race screamed out that both these horses had run far better than their finishing position suggested. Hence both were added to my list of horses to follow.
Later that day in the 5f Palace Of Holyrood Handicap the same pattern emerged with high to middle draws dominating the race. The first eight finishers were drawn 25, 16, 17, 20, 27, 29, 13 and 23. Harry Brown (drawn 7) finished 9th, best of the low draws and far side group. The second horse home on the far side was The Big Board who finished 11th. Of the two, Harry Brown made my list but as The Big Board finished a further 2¼ lengths behind Harry Brown I decided not to add him.
The next day the Wokingham Handicap replicated the middle to high draw pattern making 5th placed Fresh (drawn 4) and 9th placed Kings Lynn (drawn 2) potential horses for the list. These were the only single figure drawn runners to finish in the first 17 horses over the line! Fresh was two lengths behind the winner and Kings Lynn a further length back. Both had done enough in my opinion to be followed.
In hindsight perhaps I should have reconsidered adding The Big Board to the list given that these races, which had been so close to each other, had both shown such a strong and consistent bias. However, I didn’t, and you guessed it, déjà vu reared its head again. The Big Board won its next two starts at 4/1 and wait for it... 22/1.
Of the five listed horses I backed Fresh three times before taking him off the list after a best effort of 5th of 17. Kings Lynn finished 6th next time, not beaten far, but after finishing well down the field in the Stewards Cup (22nd of 27) he was removed, too. Harry Brown I backed twice with disappointing finishes of 8th and 10th before binning him. Lady Alara also won two races later at 25/1, but I had scrubbed her from the list after a poor run at Sandown. Ouch! Magical Sunset proved more fruitful: she finished 7th next time but was beaten less than two lengths. I kept her on the list which proved a very good decision as she won next time at 18/1.
Using negative draw bias to pinpoint horses to follow is a method I have used for over 25 years. So, a lot longer than I have used my negative pace bias methods. Back in the late 1990s and early 2000s I felt these horses would offer value in subsequent races, and I still believe that now. As with negative pace bias such horses won’t always win for you, and sometimes you will drop horses from your list that a run or two later make you feel a fool by winning. I have also shown examples above of horses that I considered but did not ultimately appear on my list and who went on to win soon afterwards. Moreover, I have shared times when I have not backed a horse from the list only for it to win. This is part and parcel of betting I’m afraid – those ‘if only’ moments, those ‘déjà vu’ moments. You win some, you lose some.
Maybe, after all, I should experiment on paper at least, backing all negative pace and draw qualifiers on their next three starts and see how the outcome would differ. Can I be a 'system' man after all?!
Race Watching / Race Replays
While discussing the Chester sprint earlier, I mentioned I re-watched the race several times. Reviewing past races is something I have done for years, but I wish I had done more of it especially going back in time. In terms of negative pace or draw bias races, I tend to watch back all the potential negative pace bias races, but not all the draw biased ones. I tend to skip re-watching big field straight course handicaps which look draw biased – over the years I have found that using the draw positions and the comments are good enough, plus the fact many of these races I do watch live.
Although I bet far more on the flat, I do also bet on National Hunt racing, primarily in chases. National Hunt chases are the races I watch back more than any other race type, including flat races. My focus is generally on novice chases, and I try to steer clear of the bigger meetings or more high-profile young chasers. One time of the year when I watch a lot of NH racing is in the summer. Evening jumps meets are more accessible for me in terms of being able to watch racing live, so I find that a useful avenue when searching for horses to add to my list.
I want to use an example of a horse I noted back in the summer of 2017, namely Adrrastos. I saw him win at Worcester in a novice handicap chase on 18th July of that year. What impressed me was his jumping – he was fluent, jumped straight and when push came to shove his athleticism seemed to stand up well to pressure. That was his chase debut and, looking back on his hurdling career, he had won once and been placed a further five times in seven starts. His two bumper races also saw him pick up a pair of places. Hence, for the level he was at, he had been consistent over the smaller obstacles / on the level which I took as a positive. I also liked the fact that he led from start to finish. As readers of my articles will know I like front runners in chases. Another positive was that his trainer, Jamie Snowden, was faring better with his chasers than his hurdlers at the time (Chase A/E index was 0.88; hurdle one was 0.65).
Adrrastos had done enough for me to make my horses to follow list. I backed him next time in a four-runner chase at Stratford. He won comfortably by ten lengths (SP 7/4) leading from start to finish and jumping cleanly bar a slight nod on landing at the final fence.

Now, chasers can stay on my list for several races, especially young improvers, and Adrrastos as a five-year-old was in that category. His next run saw him upped in class into to a £13,000 handicap chase back at Worcester and it was his first time outside novice company racing against more experienced chasers. I decided to swerve this race from a betting perspective. I thought his price was a little tight (SP 7/2) given the class rise.
As it turned out I made the right decision. He was taken on for the lead this time and raced mainly in second. Coming to the last there were five horses within a couple of lengths. He showed a good attitude to finish close up in third, beaten 2¾ lengths. That effort was plenty good enough to keep him on my list but I did notice a couple of times he was jumping slightly to the right. Not badly, but enough for me to make a note. This was a left-handed track and horses that jump out to the right consistently are at a disadvantage especially if the jumps are on a bend. I was hoping therefore to see him race right-handed soon as this jumping trait would not potentially be an issue.
He headed to Plumpton next and was back in novice company and back down in class (£6,000 race). These were big positives for me; the only negative was being upped in trip from two miles to 2½ miles. I was not sure this increase in distance was what he needed. However, after looking at the race in detail I decided if I could get 8.0 or bigger on Betfair then that would represent value, and I managed to nick 11.0 just before the ‘off’. Adrrastos led but made his first serious jumping error in four starts and was pulled up soon afterwards, just before the second last. To be fair, despite leading at the time, I am not convinced that he would have gone on to win without the error. I think it was the extra distance that was his undoing.
The question now was should I keep him on my list? My answer was yes, but with caveats. I was now looking for very specific conditions for this horse. Back to two miles, ideally on a right-handed track, ideally likely to front run, and below Class 2 company.
Adrrastos did not reappear on the racecourse for 502 days! I had pretty much forgotten about him until his name was flagged up again. In this race, three of the four conditions were met – track was Hereford which was right-handed, it was over two miles and it was a Class 3 event. One downside was when I looked at the pace tab on Geegeez:

In the LR/2LR/3LR/4LR (last run, 2nd last run, etc) columns, 4 means 'led'. It didn’t look like Adrrastos would have it all his own way in front. Dicosimo was another genuine front runner while Envole Toi had also front run in his previous three races. Hence three of the four conditions had been met, the other was iffy.
The other potential downside was this huge break. I assumed though that if the trainer was running him again, he was ready to go; whether he would be fit enough was another matter. I looked at his trainer’s record with horses coming back from a long break – with chasers it was not too bad although to get a decent sample I looked at breaks of six months or more.
As with any potential bet from my horse list, I had to decide whether the price available offered me value. Taking all things into account I felt he should be priced somewhere around the 10/1 to 14/1 mark. 20s was available on Betfair and so I felt that represented a viable bet.
Dicosimo won the battle for the lead with Adrrastos racing in second, but Adrrastos jumped well and was still in contention three out and travelling nicely. He took the lead at this point and never surrendered it. The ideal outcome! Adrrastos stayed on my list for a further six months in which time he ran on eight further occasions. Of those eight, I backed him in four, winning once at Kempton (right-handed track where he led from start to finish), and coming 4th, 3rd and 3rd in the other three. It is rare for me to keep a horse on my list for so long, but there will be occasions when it makes sense to do so. I felt this was one such horse.
I have given you one detailed example of how I have deployed watching race replays in the past. This is one of many examples I could have chosen. Not all have gone as well as this of course, but I specifically chose that one because I wanted you to appreciate that horses can stay on the list for more than a few races. If, that is, there is good reason!
Watching past races is not for everyone but I find it very useful. Yes, I will spot things that 99% of others will, but there will be occasions when I spot something that most do not – I just have to make sure these ‘spots’ are insightful ones!
Sectional Timing
This is a relatively new area for me. Sectional timings are now a part of my pace and draw research at the courses we can get them. Clearly, sectional timing is linked inextricably to pace bias. I used some of the sectional data in the Southwell race discussed earlier in the negative pace bias section. I also used it when looking at the Chester draw race. The beauty of sectionals is it gives us more numbers to play with, as opposed to just race comments, pace abbreviations, etc.
In the last 12-18 months I have been experimenting with a variety of sectional timing ideas that I hope have the potential to find horses for my 'to follow' list. I am still learning what might work and what definitely doesn’t, but it is a fun process as it is something I have not looked at in depth before. I am not quite at the stage yet when I can confidently say a specific sectional timing idea is likely to be profitable, so no horses have been added to my list to this point. However, let me share an example of one of the ideas I’ve had that may have potential.
So, I have been looking at big field handicaps and specifically at well fancied runners (favourites / strong second favourites) that were well beaten, with the idea of trying to use sectional timing to find reasons for their poor run. If the reasons are compelling enough, then perhaps these horses could be worth following. Each of these race studies/analyses of sectionals will be slightly different depending on exactly how the race panned out and how the favourite ran.
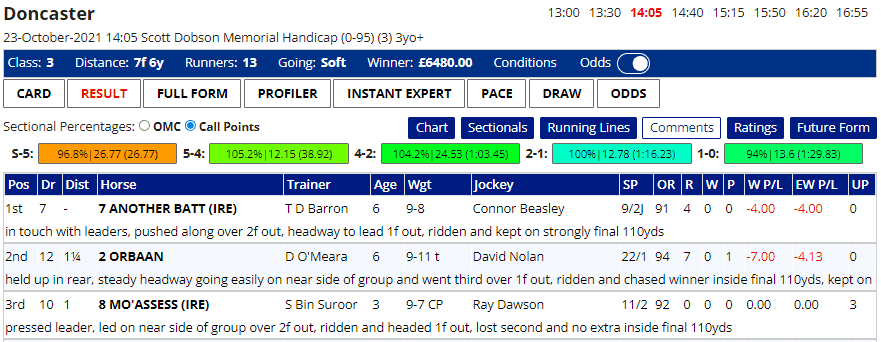
Here is an example race from Ascot last year (I have excluded the in-running comments to get a big enough screenshot). The first ten finishers home are below:

The favourite, Perotto, finished 10th, so on the face of it a disappointing run. However, if we look carefully, out of the top ten finishers, nine of them were positioned in the back half of the field early (after two furlongs) - note the first bold number, representing race position, and the superscript denoting distance behind the leader. Perotto is the only one of the those that was positioned in the top ten early, 3 lengths off the lead (103).
The first part of the race (S-6, start to six furlongs out) - see the blobs above the result grid - was FAST compared with par, the last part (1-0, the final furlong) Q SLOW (quite slow), so everything was pointing to a pace collapse, or at least a notable deceleration, late in the race. If we focus on Perotto’s path through the race, he was challenging for the lead two furlongs out (3hd) having been five lengths off the lead at the 4-furlong pole (135). Maybe this effort was not his optimum strategy, and from there he started to drop away again.
At this point I wanted to dig further by using some of the numbers the sectionals gave us. Because the horses that were placed in the top ten positions early all finished 10th or worse, I thought it would be a good idea to compare the final furlong splits of these ten horses. I have highlighted the times (red squares) and positions/lengths behind leader (blue squares) in the screenshots below:


Perotto’s final furlong time of 13.94s was over half a second quicker than any of the horses that had raced in front of him early. The next fastest, Ghaly, was clocked at 14.53 (0.59 seconds slower). My assumption therefore was that, considering the early pace, Perotto did well to finish that quickly.
Taking all the sectional evidence into account, I feel that Perotto’s run was better than it looked. Now I’ve stated earlier that no horse has yet made my list by sectional ideas such as this one. My thinking is still not fully formed as I have intimated. I suppose I could argue that this race could be considered a negative pace bias race, which technically it was, but it did not meet my criteria to qualify on pace bias grounds. It would have done if it was over 7f as opposed to a mile.
On this occasion, it would have been a sound decision to list the horse as Perotto has raced three times since and won twice, at 5/1 and 10/3.

I am hopeful that in the next few months I will be confident enough with at least one of my sectional timing ideas to begin putting it into practice.
Those of you interested in sectional timing should really check out the data on the Geegeez site and Matt’s excellent content which can be found from the Articles tab at the top of any page and scroll down to the Sectional Timing area – there are 17 articles dedicated to it.
**
This has been a long article and it's time to wind things up. I do have other ways horses qualify for my to follow list, but that will have to wait for another time.
Please share any ideas for horses to follow lists in the comments below – it would be great to hear your thoughts.
- DR