
Royal Ascot 2026: Must Know Betting Angles
Royal Ascot – Exploring a variety of angles
Royal Ascot 2026 is less than a week away, writes Dave Renham. It's obviously one of the biggest meetings of the year and it is one of my favourites, in my top three along with Cheltenham and Goodwood. In this article I will delve into Royal Ascot results data going back ten years (2016-2025) in preparation for the upcoming five days of the festival. I will be looking at some areas I have not previously publicly examined in depth, so I'm excited to get cracking. Profit/ loss figures have been calculated to Betfair Starting Price (BSP) less 2% commission.
Last year For Royal Ascot I looked at Group 1 races and in 2024 I focused on the mile handicaps. In this piece, as the title indicates, I am going to look at a variety of angles. Let’s get started.
Royal Ascot Draw Bias
Straight Track Drawn Bias (up to a mile)
Where horses are berthed in the stalls often has a big say in certain big field races on the straight track. Below are some recent examples, starting with the 2023 Sandringham Handicap run over a mile. The first nine runners home, along with their post positions, were:
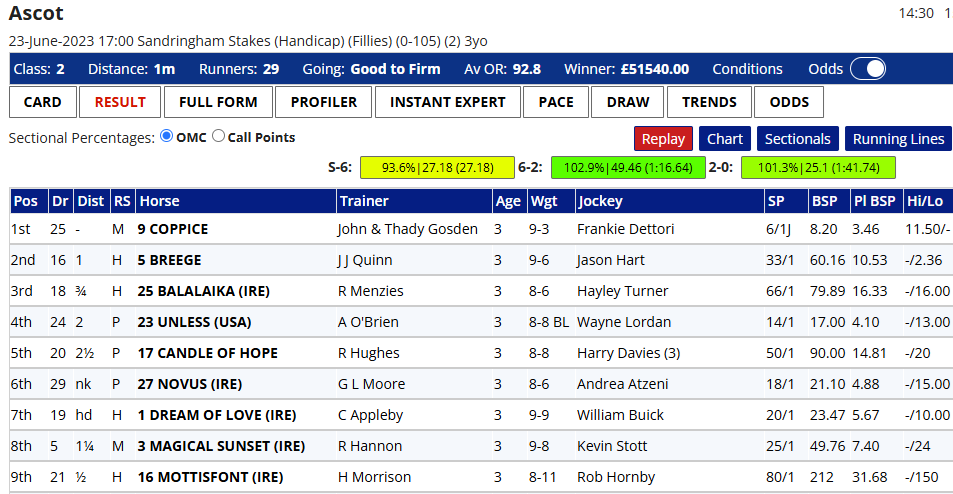
There was a clear high to middle draw bias in this race with eight of the first nine home, and all of the first seven, racing stands’ side. Not only that several of these runners were big prices with a 33/1 second, a 66/1 third and a 50/1 in fifth.
The next example occurred in 2024:
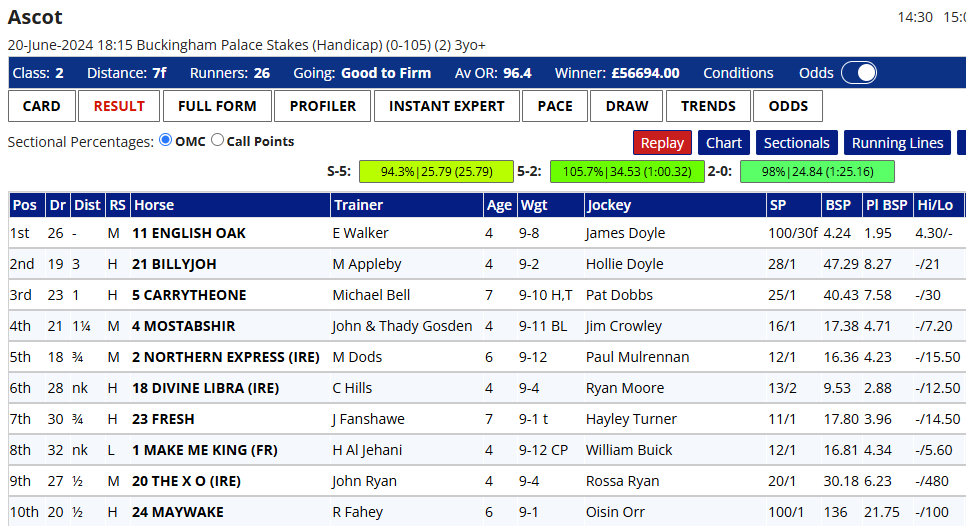
This renewal of the Buckingham Palace Handicap, run over a furlong less than the Sandringham, again witnessed a very substantial bias in favour of high to middle berthed runners. The first ten home were drawn 18 or higher and all raced stands’ side. And the second and third placed horses were 28/1 and 25/1.
Last year's edition of the same race saw a near carbon copy occur as the result below shows:
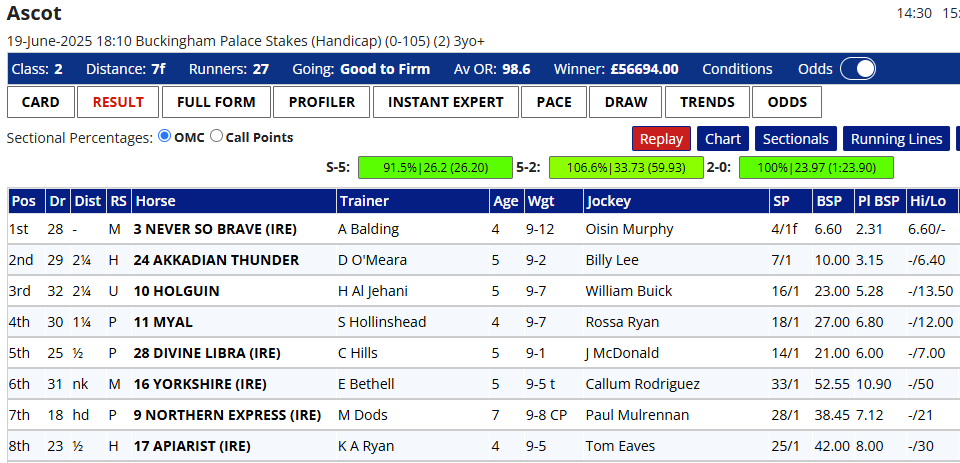
The first four home exited from the highest five stalls. Indeed, it should also be noted that the 2023 renewal of this contest also favoured high to middle drawn runners (best finishing position of a horse drawn in single figures was ninth). Based on these recent races, when they line up in the Buckingham Palace Stakes this year it will be tempting to completely ignore those runners drawn low.
However, although we get some handicap races on the straight course that show a significant draw bias, when we look at all such races over the past ten years, the draw breakdown by ‘thirds’ are probably more even than might have been expected.
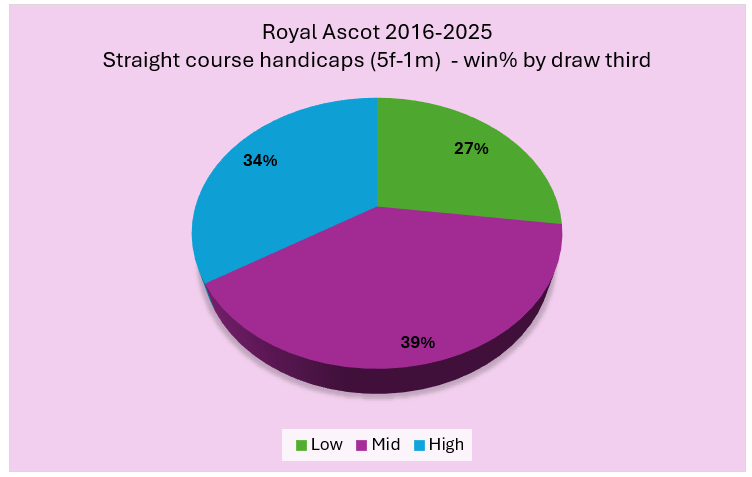
Lowish draws have won the smallest percentage, but I must admit I had expected a figure at least five percentage points lower. Middle draws have been the most successful in terms of wins at least, perhaps because plenty of the big field races are contested down the centre of the track thus meaning no lost ground manoeuvring for position.
Of course, we can view this draw data in a different way by looking at Percentage of Rivals Beaten (PRB). This potentially gives us a more accurate picture as it considers all runners in all races, not just the winners. Here were the splits across the 59 races:
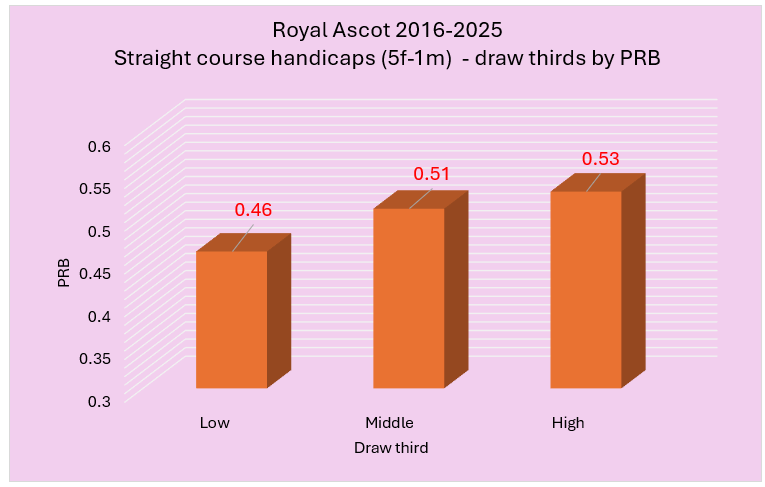
This is more the type of pattern I was expecting with high edging it over middle and low a few points behind. 46% of rivals beaten on a sample this size is material: it's quite tough for the low drawn horses.
Royal Ascot Round course Draw Bias (1m4f)
If you were thinking draw bias only has the potential to impact straight course races, think again. Over 1m 4f we have seen a strong draw bias, albeit from a smallish sample of 20 handicaps run over this trip over the past ten meetings. Let me share the win splits by third of the draw first:
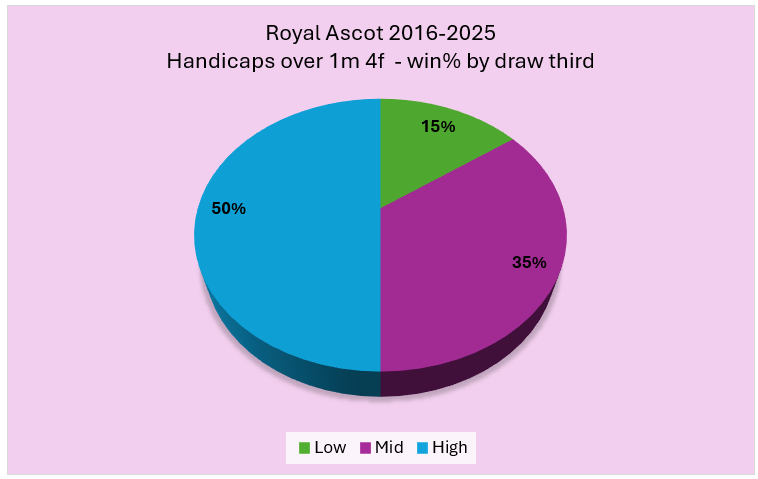
Low drawn runners have struggled, winning just three of the 20 races even though they ostensibly have the shortest distance to travel having been drawn closer to the inside running rail. Meanwhile, high draws won half of the sample races, with seven wins for the middle third. If we focus on the four lowest drawn horses versus the four highest drawn horses, we get this dichotomy:
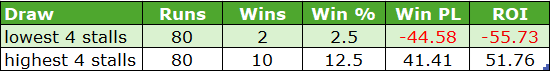
These numbers are quite powerful and are at least partially corroborated by the PRB figures:
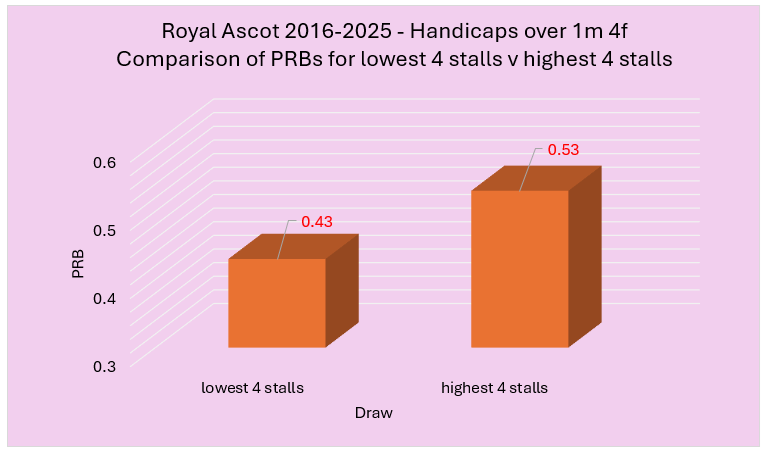
Based on these stats, it is a challenge to be berthed in draws one to four, perhaps because one either has to use petrol to hold a position or else take back and ride for luck buried in the ruck. Middle to high draws hold sway with 13 of the 20 winners coming from the top half of the draw.
OK, moving on from the draw let’s now look at...
Odds Movement at Royal Ascot
Early Morning odds compared with Opening Show odds
One would assume market movements at Royal Ascot differ slightly compared with your average meeting. I was expecting the early morning odds (EMO) for most runners to be more accurate than usual, for example. Below are the percentages for horses that lengthened/drifted in price from EMO to Opening Show (OS), those that shortened, and those that stayed the same price. For the record, the EMO prices were taken from around 9.30am and I have used William Hill odds. The OS odds are based on when the market became ‘live’ so usually around 15 minutes before the start of the race.
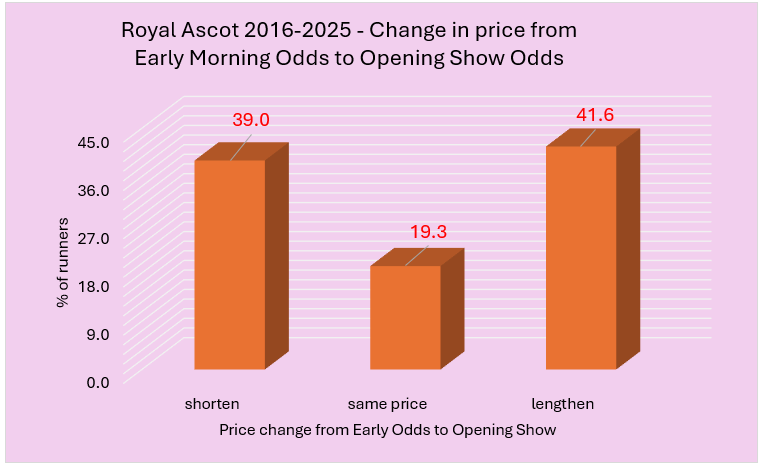
These figures are very different from the figures for all flat races. The control group of 'all UK flat races' saw 52.6% of horses lengthen in price, 36.4% shorten and 11% stayed the same. Hence, at Royal Ascot the market sees far fewer horses lengthen in price with their overall numbers similar to those that have shortened. In addition, far more horses have remained at the same price. Ultimately, I guess this is what we should expect – more accurate morning markets meaning less fluctuations during the day; and, perhaps, fewer horses defensively priced early in the day.
Opening Show odds compared with Starting Price
What about the price shifts in the minutes before the ‘off’? What type of changes do we see from the Opening Show on course to the final SP?
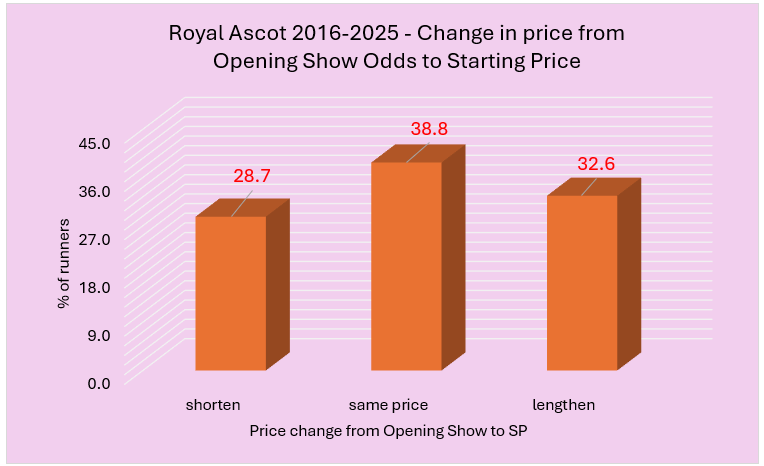
More horses remain at the same price than those that either shorten or lengthen/drift in price. Again, these figures differ markedly from the norm – in flat races as a whole, around 42% of runners drift in price, 24% remain the same price, while around 34% shorten. For those punters who bet close to the ‘off’, these stats will be useful to know.
There is one more comparison I would like to share before moving on. In all flat races horses that were clear favourite at early prices remained favourite at the off around 63% of the time. At Royal Ascot, more early morning favourites have retained favouritism at the ‘off’ than has been the norm with their figure standing at 73%.
Royal Ascot: Exchange Markets
BSP prices
I wanted to take a quick look at Betfair SP (BSP) to see if there has been a price band that offered some value. In Class 1 races the sweet spot seems to have been between BSP 5.0 and 10.0. This price grouping has seen 79 winners from 493 (SR 16%) for a profit of £60.67 (ROI +12.3%). Narrowing these Class 1 races down to the cream of the crop, the Group 1s, horses priced BSP 9.0 or lower has been the area to totally focus on. Backing all these runners blind would have seen us make a 16p in the £ on investment. Quite incredible, really.
In handicaps, the 5.0 to 10.0 band which was positive for Class 1 races was far from optimal here, producing just an 11.1% strike rate (27 winners from 243) for losses of £40.38 (ROI -20.3%). The best value in the handicaps was with longer priced horses – primarily those between 17.0 and 60.0. However, the strike rate is down at 4.5% across this huge cohort and hence finding the right horses within this odds bracket would have been tricky to say the least.
In-running betting/trading
Roughly 20% of all money bet on a horse race happens in running. At Royal Ascot, with competitive races, this percentage may edge up a point or two. I analysed some Royal Ascot in-running data in relation to ‘dobbing’. Dobbing or ‘DOB’ means ‘double or bust’. Essentially, dobbing is an in-play trading strategy employed by some traders where they are looking to double their original stake if their trade succeeds. Conversely, if the trade/DOB is unsuccessful they ‘bust’ or lose their stake.
I have written about dobbing before but for those who have not heard of it, I will offer a quick worked example. Let us imagine we back a horse at 10.0 for £10; in order to create a potential DOB we try and lay the horse at half the odds for double the stake – so we set a lay at 5.0 for £20. If the horse hits 5.0 or lower in running, our lay bet will be matched and regardless of the result we will win £10 (less commission).
The basic mathematics behind it are shown in the table below:
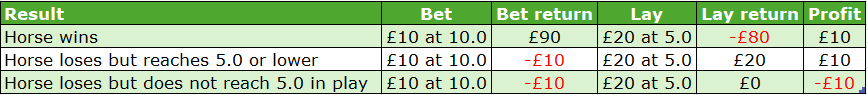
For dobbing to be profitable long term, we are probably looking to have a success rate of around 53% or more. This figure has to be a bit higher than a 50.1% baseline as we need to take commission into account.
Scene set, here are some Royal Ascot dobbing data. Mainly, I wanted to see if the price of the horse made a difference. Below is a graph that shows the dobbing percentages for different BSP price bands:
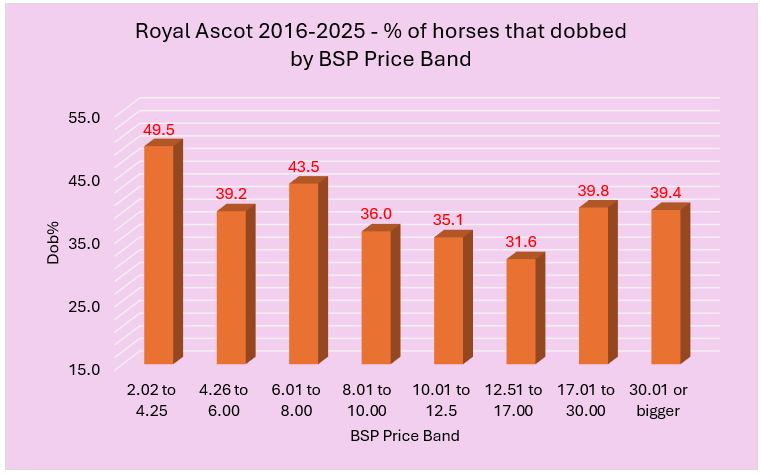
Horses priced under BSP 2.02 cannot ‘DOB’ hence why the lowest price band starts at 2.02. Horses priced between 2.02 and 4.25 have got close to a 50% dob rate, but the rest have been well below the type of figures we would be looking for to make a profit.
What about the distance of the race? Can that make a difference?
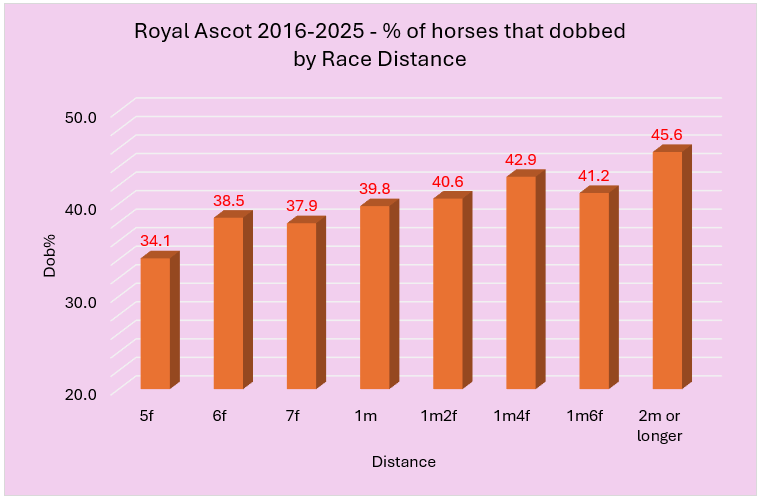
The graph clearly shows that the longer the race at Royal Ascot the more chance a horse has of dobbing. The longest distances of 2 miles or more have hit over 45% but still some way short of that 53% figure we would be looking for to edge towards profit.
If we combine the best BSP price band of 2.02 to 4.25 with races 2 miles or further, we would have hit a 65% DOB rate. However, before we get too excited this comes from a small sample of 23 runners.
Finally, on the in-play front, it should be noted that 80% of all winners traded higher than their BSP in running. So, if as a punter your preference is betting BSP, it may be worth considering setting pre-race a slightly higher figure than the expected BSP for a small proportion of your overall stake. For the record 39 of the 40 winners of 1-mile non-handicaps traded higher in running than their BSP.
Royal Ascot Trainer Form
Top Trainers by Win Strike Rate
Before closing, I wanted to review some Royal Ascot trainer data. With the level of racing being so competitive it is difficult for even the very best trainers to be consistently successful, and the highest win strike rate for any trainer who has had at least 50 runners in the past ten years is just 13.5% - not surprisingly it’s Aidan O’Brien. He has saddled an impressive 48 winners but from 355 runners.
John Gosden, and now with son Thady on the licence, has been the best of the British with 32 winners at a strike rate of 11.5%. No other trainer has saddled more than 20 winners and only three have hit double figures, namely Charlie Appleby (15), Andrew Balding (12) and Roger Varian (11).
To avoid big odds winners skewing bottom lines, let me share the trainer results for horses priced BSP 24.0 or less. To be included a trainer must have had at least 25 qualifying runners:
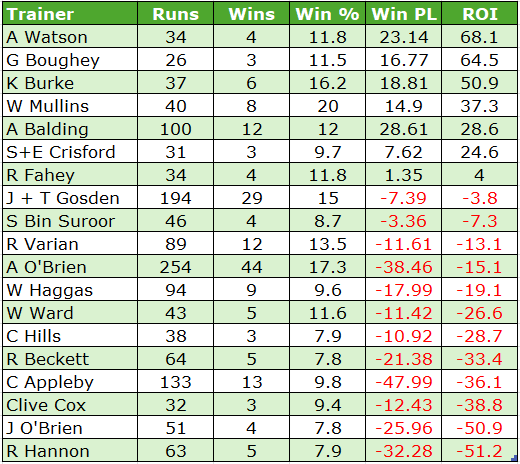
Seven of the 19 managed a profit but for some - notably Appleby, Beckett, Cox, Hannon and Joseph O’Brien - it has been hard going in terms of returns. Even Aidan O’Brien would have lost us more than 15p in the £.
Top Trainers by Percentage of Rivals Beaten (PRB)
It is also worth sharing the PRBs for these trainers with BSP 24.0 or lower priced runners and these were as follows:
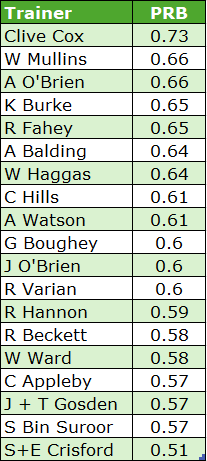
One trainer in particular who we can say has been unlucky is Clive Cox. He has by far the best PRB of any of the trainers at 0.73, but has managed just three winners from 32. That PRB figure, though, does nod to the fact that Cox saddled ten placed runners as well as the trio of winners, and backing all of his Royal Ascot runners to place would have yielded a 25p in the £ profit on the Betfair Place market.
Specific Royal Ascot Trainer Angles
There are some additional trainer stats I wish to share based on the BSP price cap of 24.0.
- The Gosdens in Group 1s have secured a near 30% strike rate thanks to 13 winners from 44. Backing all runners blind would have yielded a return of 64 pence in the £.
- Meanwhile backing all Aidan O’Brien runners priced 24.0 or less would have seen significant losses of over 34p in the £.
- Charlie Appleby has a poor record when saddling the favourite at Royal Ascot with just three winners from 21 (SR 14.3%) for hefty losses of £13.49 (ROI -64.3%).
- Roger Varian has had an outstanding record when his horses have started favourite, winning 61.5% of the time thanks to eight winners from 13. Backing all Varian favourites to BSP would have seen an excellent profit of £20.31 (ROI +156.3%).
- Another poor Charlie Appleby stat is that in handicaps he has had just one win from 43 with losses of 84 pence in the £.
- Keep an eye on NH guru Willie Mullins when he sends a runner here that raced in a NH race last time out. Of the 23 such entries, six have won (SR 26.1%) for a profit of £11.94 (ROI +51.9%). Backing these types to place on Betfair would have yielded a further 20p in the £ return.
Royal Ascot 2026 promises to be an absolute treat for us racing and betting fans. Hopefully there is something in this piece to help you get your nose in front whether you're a backer, a layer or a trader. Good luck to those who will be punting during this meeting. I'll be sharing the race previews with a strong panel of experts next week before returning with my regular column the following week.
Until then...
- DR