
An Investigation into Last Time Out Run Style
In the last couple of weeks, the Geegeez Query Tool has been upgraded with many exciting new additions, writes Dave Renham. To read about these changes click here.
One of the new options means we can now analyse how the run style of a horse last time out potentially affects their next race. The Query Tool includes a set of ‘Last Run’ (and 2nd Last Run) variables, including LTO Pace score, which tells us what run style the horse displayed on their most recent start.
Run style is a topic I have written numerous articles about before; this is simply because it is still an area that is under-researched compared with most others. Furthermore, it is partly misunderstood by some, but most importantly it has the potential to give us punters an edge.
To recap, then, run style data on Geegeez is split into four sections - Led, Prominent, Mid Division and Held Up. Here is a quick explanation of which type of horse fits which type of pace profile:
Led – horses that lead early, usually within the first furlong or so; or horses that dispute or vie for the early lead;
Prominent – horses that lay up close to the pace just behind the leader(s);
Mid Division – horses that race in the middle of the pack but in front of the rear ‘quarter’;
Held up – horses that are held up at, or near, the back of the field.

Geegeez assigns points in regard to which position a horse adopted early in its race. Leaders get 4, prominent runners 3, horses that ran mid-division 2, and those held up score 1.
Up until a couple of weeks ago, these pace or run style scores could only be found in the Geegeez Gold Racecard or within the Query Tool under ‘current run’. Now, as I mentioned in the first paragraph, we can get LTO run style data from the last run, and for that matter, the second last run as well. In this article, I am just going to focus on the last run, but I no doubt will be expanding this research to the last two runs in future articles. Let’s crack on.
So where does early pace give us an edge? Essentially, there is an edge in flat racing to horses that lead the race early. Indeed, horses that track the pace also have an edge over those that race midfield or near the back early. This edge is stronger in some races rather than others, but if we look at all UK flat handicaps from 2021 to 2025, we can see how strong this edge actually is. Below is a table detailing the performance of the four main run styles in all these races:
| Run style | Runs | Wins | Win % | BSP P/L | BSP ROI |
| Led (4) | 29517 | 4750 | 16.09 | 11718.13 | 39.7 |
| Prominent (3) | 48896 | 6296 | 12.88 | 2751.8 | 5.63 |
| Mid Div (2) | 59892 | 5939 | 9.92 | -5237.5 | -8.74 |
| Held up (1) | 68385 | 5692 | 8.32 | -12133.5 | -17.74 |
Across the four run style groups the win and ROI percentages correlate positively, with leaders outperforming prominent racers which in turn outperform mid div runners which outperform hold up horses.
This front running advantage is stronger over shorter distances. The table below helps to illustrate this as it shows the performance of front runners in handicaps across different race distances:
| Distance | Runs | Wins | Win % | BSP P/L | BSP ROI |
| 5f | 4309 | 879 | 20.4 | 2994.78 | 69.5 |
| 6f | 5702 | 938 | 16.45 | 3165.97 | 55.52 |
| 7 | 5110 | 785 | 15.36 | 2128.17 | 41.65 |
| 1m to 1m2f | 8998 | 1372 | 15.25 | 3187.7 | 35.43 |
| 1m3f+ | 5334 | 768 | 14.4 | 224.9 | 4.22 |
Again, we have positive correlation across the metrics once more.
Of course, it is all very well knowing this, but taking advantage of such front running bias is another matter. It is not as if we have clairvoyance that we can unleash before each race to tell us which run style will be employed by each horse. However, past run style is a solid indicator of future run style as the data I am about to share will show. Let me start with a graph and underneath I’ll explain what it represents:
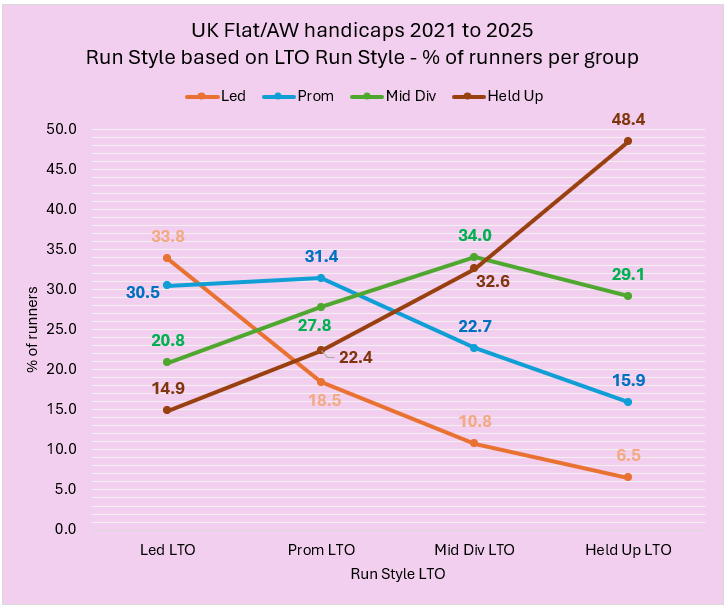
The graph shows the percentage of runners that employed a specific run style based on the run style they showed LTO. Thus, the orange line highlights the percentage of runners that led early in the current race, the blue line is for those who raced prominently, the green one is for those who were mid division, and the hold-up horses are represented by the brown line. We can then match these up with the four LTO run styles shown on the horizontal axis at the bottom. Effectively the graph produces four vertical lines with four coloured dots, where LTO leaders’ line up down the left, moving across until we reach LTO Hold up horses lining up vertically down the right.
Starting with those that led last time out, we can see 33.8% led again next time, 30.5% raced prominently, 20.8% raced in midfield and 14.9% were held up. So LTO leaders are more likely to lead in their next race compared to any showing any of the other three run styles, and there is an almost two in three chance they will lead or race prominently if they led last time.
If we move over to the right of the graph and look at the data for horses that were held up last time, we can see that only 6.5% of these horses led next time, while 15.9% raced prominently, 29.1% raced in mid division and a whopping 48.4% were held up again.
These LTO hold up stats are particularly powerful, showing that nearly half of all horses that were held up on their most recent start show that same style next time. Also, with less than 7% of LTO hold-ups leading next time, when we are trying to predict the front runner of a race, we can fairly confidently dismiss horses that were held up LTO. Overall, this graph highlights that LTO run style can have a significant influence on run style next time in terms of what position they will take up in the race early.
Let me now look at horses that led LTO to see whether we can improve the 33.8% figure for those who went onto lead early next time too. One general finding is that horses that drop in distance lead less often next time out. The table below looks at all handicaps between 5f and 1 mile across the period of study showing the percentages for each run style group focusing on LTO leaders and the distance they raced LTO compared with the current race.
| Distance Change | Led% | Prom% | Mid Div% | Held Up% |
| Same distance | 36.3 | 30.9 | 19.9 | 12.8 |
| Down in distance | 27.2 | 30.7 | 23.3 | 18.8 |
| Up in distance | 37.8 | 28.3 | 18.8 | 15.1 |
As the table shows, horses that led early last time and now move up in distance led again 37.8% of the time. Sticking to the same distance the figure is 36.3%, but LTO leaders dropping down in distance from their last run find it much harder to lead, their percentage sinking to 27.2%.
The highest percentage I found for horses that led LTO which went on to lead again in their subsequent race came when focusing on LTO winners. This group led 42.7% in their next run.
Moving now to horses that were held up LTO, let me look to see whether the distance they raced last time has a bearing in terms of the likelihood they will be held up again next time. For this, I restricted the previous run to being a handicap too as that seemed to make sense. Here are the percentage splits:
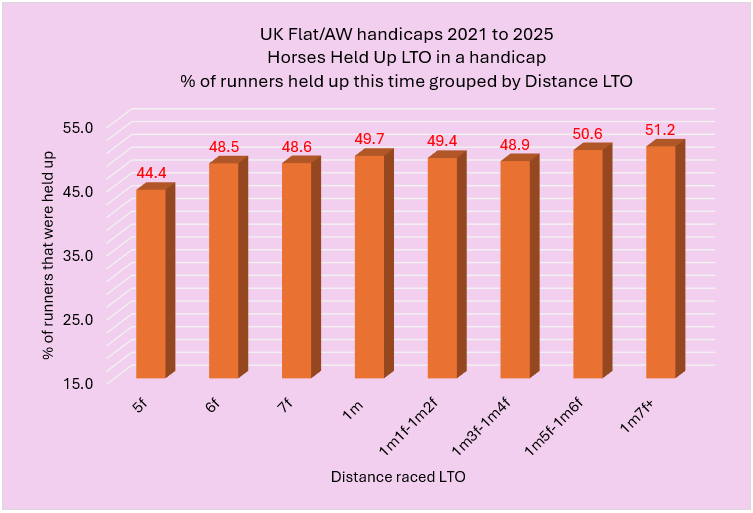
This graph shows that most distances run LTO produce very similar figures to what we saw earlier. The LTO 5f stats have the smallest figure at 44.4%, while once we get to 1 mile 5 furlongs or further it sneaks above 50%. It seems therefore, as the saying goes, 'a leopard doesn’t change its spots'.
There is one more set of LTO hold up stats I want to share. If we focus on horses that were held up LTO in a handicap, aged four or older, the run style breakdown in their next race looks as follows:
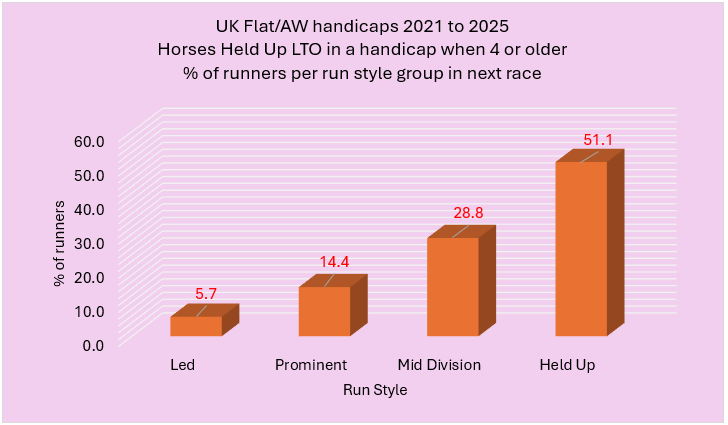
We see that over 51% of older horses that were held up last time, were held up again next time. This slightly higher percentage makes sense as older horses are more likely to have developed a preferred running style. 3yos, and more especially 2yos, have less experience and fewer races under their belt and so are more likely than older horses to switch run styles race to race.
Having dug a little into how the last time out run style potentially affects a horse’s run style in their current race, let me share the bottom lines for each LTO run style. The focus again is on UK flat handicaps spanning the five years from 2021 to 2025, and for this subset I am including LTO runs that were also in UK handicap races (flat/AW).
| LTO Run style | Runs | Wins | Win % | BSP P/L | BSP ROI |
| Led (4) | 25447 | 3130 | 12.3 | 229.58 | 0.9 |
| Prominent (3) | 42895 | 5167 | 12.05 | 291.78 | 0.68 |
| Mid Div (2) | 51331 | 5657 | 11.02 | -2254.62 | -4.39 |
| Held up (1) | 59098 | 5851 | 9.9 | -2890.95 | -4.89 |
As we can see, horses that showed a led or prominent run style LTO produced the best strike rates, and both nudged into profit. LTO mid div runners won more often than LTO hold up horses, while both showed losses of between 4p and 5p in the £.
Therefore, based on these numbers, a more prominent sit early in a horse’s previous race does seem to improve its chances next time out.
I want now to restrict the qualifiers to horses aged four or older as I feel this should improve matters based on the fact that cohort are more likely to replicate a run style from last time out. These are the results:
| LTO Run style | Runs | Wins | Win % | BSP P/L | BSP ROI |
| Led (4) | 16897 | 2053 | 12.15 | 641.29 | 3.8 |
| Prominent (3) | 28485 | 3321 | 11.66 | 178.43 | 0.63 |
| Mid Div (2) | 35332 | 3783 | 10.71 | -1568.39 | -4.44 |
| Held up (1) | 41267 | 3954 | 9.58 | -2636.54 | -6.39 |
The win rates and ROI%s combine once more to suggest that LTO front runners have been the best value, followed by LTO prominent racers, then LTO mid div, with LTO hold ups bringing up the rear... sorry, I couldn’t resist the pun!
Also, if we now split this ‘older runner last time out Led group’ into those that led in an all-weather handicap LTO compared with those that led in a turf handicap LTO we see an interesting split:

| LTO Surface | Runs | Wins | Win % | BSP P/L | BSP ROI |
| AW | 7628 | 867 | 11.37 | 40.12 | 0.53 |
| Turf | 9269 | 1186 | 12.8 | 601.17 | 6.49 |
4yos and older that led early in a turf handicap LTO have performed significantly better than those which led in an AW handicap LTO. I am not sure why that is the case but it a worthwhile nugget to be aware of.
Before wrapping this piece up, it is important to note that a few big priced winners have not skewed the results. If we look at 4yos and older priced 8/1 or shorter when racing in a UK handicap after running in a UK handicap LTO we see the following:
| LTO Run style | Runs | Wins | Win % | BSP P/L | BSP ROI |
| Led (4) | 8483 | 1647 | 19.42 | 236.48 | 2.79 |
| Prominent (3) | 14177 | 2648 | 18.68 | 130.73 | 0.92 |
| Mid Div (2) | 16613 | 2973 | 17.9 | -209.92 | -1.26 |
| Held up (1) | 17567 | 2985 | 16.99 | -702.84 | -4 |
The same pattern emerges once more, with the strike rates dropping from top to bottom (led to held up) and the profits/returns following the same pattern.
*
So, what has this digging helped uncover?
Well, even something as simple as looking at the run style of a horse last time out when contesting a handicap can give us a bit of a steer in a couple of ways.
Firstly, it can help with establishing a horse's most likely run style next time. We saw that horses that led LTO have led again next time a touch above once in every three races; whereas horses that led LTO adopting an early position near the back of the field next time (held up) occurred only around once every seven runs.
An additional point to note is that LTO early leaders in races of 5f to 1m have been more likely to lead in their next race when either racing at the same distance to last time or if upped in distance.
There were even stronger numbers when looking at horses that were held up LTO. This cohort showed the same held up style again in their following race roughly half of the time, whereas only about one in 15 of them went onto lead early in their next race.
Secondly, I found that horses which led or raced prominently LTO had an edge over LTO hold ups / mid div runners from both a win strike rate and a returns perspective. Additionally, horses aged four and up that led LTO had the best figures, particularly if the LTO race was on turf.
Well, that’s all for this one. The natural progression from here is to look at the combination of run style in the last two runs, and that will be coming soon. Until next time...
- DR
Other Recent Posts by This Author:
- Combining Pace and SR Ratings, Part 2
- More on Combining Pace and SR Ratings
- A Look at Summer All-Weather Racing
- 3yo+ First Time in a Handicap: An Analysis
- Royal Ascot 2026: Must Know Betting Angles



Leave a Reply
Want to join the discussion?Feel free to contribute!