
Handicap comparisons: last run to current run (Part 1)
As the title suggests, in this first article of two I will look at some handicap data and compare horses in terms of their most recent run and their current one, writes Dave Renham. I will be looking at changes in a variety of criteria including distance, class, weight carried and official rating to name but four.
I have analysed UK flat handicap races between 2019 and 2024 on both turf and all-weather (AW), with a few caveats as follows.
Firstly, horses must have been at least three years old. Second, they must have had at least six career starts. Thirdly, they must have run in a flat handicap last time out; and finally their price must be 12.0 BSP or lower.
Sticking with horses aged three or more seemed logical as far as handicap races go, and with horses needing at least six career starts to qualify, it means that most of them would have found their niche as it were in terms of distance, class, etc. Using last time time out (LTO) flat handicaps means we can get a proper comparison in terms of changes in distances, official rating, weight, etc., while the price limit avoids bottom lines being skewed by the odd big odds runner hitting the winner’s enclosure. Profit and loss has been calculated to Betfair Starting Price (BSP) less 2% commission on winning bets.
Change in Distance
Let me start by comparing the stats for changes in distance. With nearly 90,000 qualifiers the sample size is significant, and below are the figures for each in terms of BSP A/E indices:

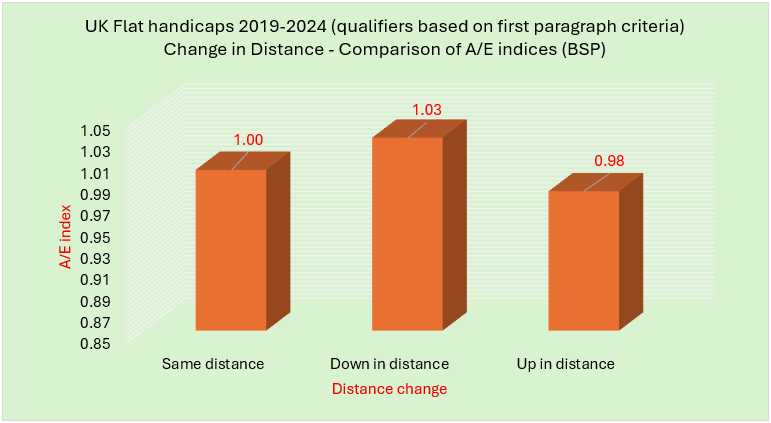
As we can see, horses dropping down in distance have offered the best value and when we look at the profit/loss figures we see the same thing:
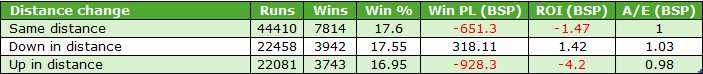
Horses dropping in trip have nudged into profit, while those upped in distance have lost the most, showing the worst returns. It should also be noted that horses upped in distance that ran over five or six furlongs LTO have the poorest record. These runners have won 798 races from 5314 qualifiers (SR 15%) for a loss to BSP of £329.20 (ROI -6.2%); BSP A/E 0.96.
Conversely, horses that have dropped in distance and are running this time over five or six furlongs have provided the following positive results – 1238 winners from 6952 (SR 17.8%) for a profit of £189.89 (ROI +2.7%); BSP A/E 1.05.
Finally for distance move, horses dropping in distance more than two furlongs have produced the following stats – 349 wins from 2034 runners (SR 17.2%) for a profit of £90.85 (ROI +4.5%); BSP A/E 1.05. These are solid looking figures so don’t be put off by horses dropping in trip by over 2f.
Change in Race Class
On to change in class next from their most recent run. Here are the splits:
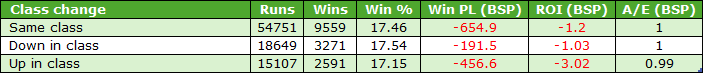
We have very similar strike rates, A/E indices and ROIs. Horses upped in class lost a little more than the other two, and perhaps the most interesting stats come from that ‘upped in class’ group when looking specifically at Class 2 contests.
Class 2 handicaps are the highest level of handicap in the UK and let me first share the record of horses switching up from Class 3 handicaps to Class 2 handicaps: they scored just 14.2% of the time (233 wins from 1643) for hefty losses of £239.49 (ROI -14.6%); BSP A/E 0.88.
However, horses making a bigger leap in class, hence those racing at Class 2 level having raced at Class 4 level or lower LTO, produced a profit of £71.68 (ROI +8.1%) thanks to 156 winners from 886 runners (SR 17.6%). The BSP A/E index stands at a very healthy 1.13. For the record, younger handicappers within this cohort, aged three to five, returned an even healthier 14 pence in the £.
It is interesting to try and decipher why this cohort of runners performed so well. I guess, and it is just a guess, that trainers who are prepared to make such a class leap with their horses must have enough confidence that the horses have sufficient potential to bridge the class gap.
Change in Official Rating (OR)
I would like to look at Official Rating changes next. I will start by sharing the win percentages (win strike rates) for each group shown by the graph below:
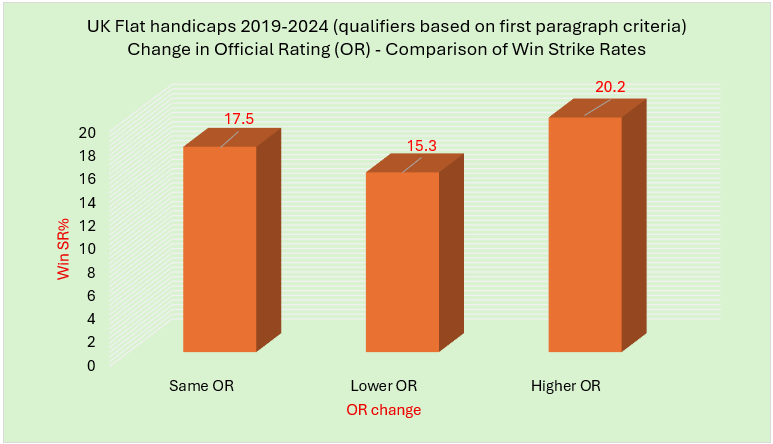
Horses which had a higher OR compared to their last run won around once in every five and were roughly 5% ahead of those whose OR was lower compared to LTO. However, when we compare the returns there is little in it:

Horses that have a higher OR almost certainly performed well last time out and those with a lower one probably performed moderately or indeed poorly. LTO performance has a clear influence on next time out strike rates and that is what I’m sure we are seeing here.
I do have another strong positive stat to share which is connected to horses whose OR was at least 7lbs higher than LTO. This cohort of runners have produced excellent figures with 401 winners from 1683 qualifiers (SR 23.8%) for a very healthy profit of £223.15 (ROI +13.3%); BSP A/E 1.08.
In terms of horses having lower ORs, those runners dropping just 1lb actually snuck into a very small profit returning exactly 1p in the £; those dropping 3lb or more would have lost 6p in the £.
Change in Weight carried
I wanted to look into this area but did not expect to find much. Essentially, I didn’t want to miss anything, and if we don’t test we won’t know! I had assumed the ‘same’ weight group would be a small one relative to the others and so it was:
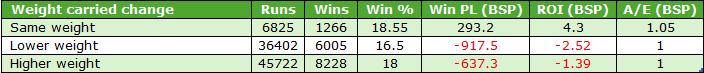
The group carrying exactly the same weight as last time had the best record overall and with nearly 7000 qualifiers it is a decent enough sample. I cannot easily explain why they proved profitable. I am assuming it was down to variance but that is just another guess. What is interesting is when we split these ‘same weight’ results up by class.

The lower classes of race (5-7) proved to be very profitable and, remarkably, this cohort would have turned a profit in every single year as the graph below shows:
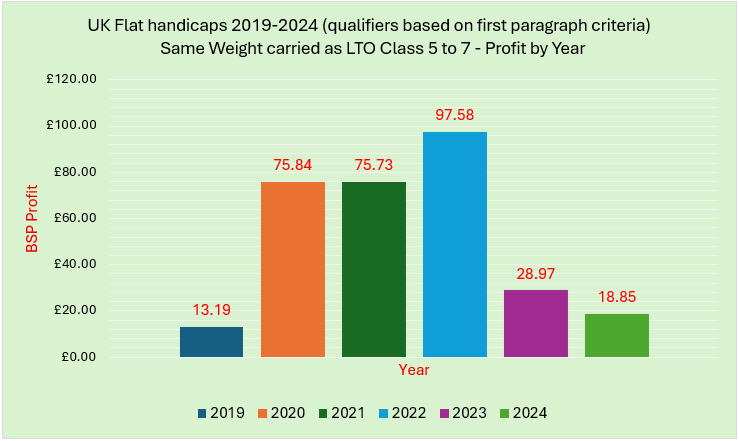
The majority of the profits came from 2020 to 2022, but even so these figures are surprisingly consistent.
Change in Average Race OR
In a recent article for geegeez.co.uk, which you can read here, I discussed the average OR for different types of handicap races. I'm pleased to report that 'average OR' will soon be published on the geegeez racecards. Here I am comparing the change in that average to see if we can see any clear pattern:

Amazingly we see strike rates within 0.12% of each other. There are slight differences in ROI%s, but the A/E indices are virtually the same, so I have been unable to find an edge either positive or negative here.
Change in Odds
I want to examine odds data now. These are based on Industry SP rather than BSP:

Horses that were shorter in price than last time had the best strike rate as we would expect. However, they did not manage to produce a profit. The smallest subset is the group of horses that were sent off at the same price as LTO. They turned a profit but, as with the earlier weight stats, I have no real explanation why.
Change in Course
How about change in course from LTO? The majority of horses race at a different track from the one they competed on the previous day; but in the winter especially we see more horses racing at the same all-weather track. Here are the overall splits:

Horses that ran at the same course as LTO had a slightly better record overall than those that switched venues. Also, horses that raced at the same AW course LTO as this time just edged into profit as the table below shows:

![]()
Below is a breakdown of the six AW courses:

Return runners at four of the six all-weather circuits were in profit, while Chelmsford is the only course where having a LTO run at the same track could be considered to be a strong negative. The Kempton figures meanwhile have been particularly strong.
Change in Trainer
The final change I want to examine in this piece is connected with trainers. Naturally, the vast majority of horses in this sample raced for the same trainer last time as in the current race. However, are trainer switches preferable? Let’s see:

Horses that switched stables made a solid profit overall, with returns close to 10p in the £, and there were three trainers that stood out and they are shown below:

Mick Appleby seems to be the ‘go to’ stable when it comes to switching stables, especially when talking about handicappers. His record is very good from a decent number of runners. Tony Carroll and James Owen had smaller sample sizes but both of them produced exceptional figures, and all three are definitely worth keeping an eye on in the future when saddling a new recruit under these specific parameters. One trainer who has been less successful is Stuart Williams, whose record reads 0 wins from 21 in the study period.
Summary
In this piece, I have looked at a variety of changes between two handicap runs. When looking at these types of areas, especially with huge sample sizes, it is important to understand that it is rare to find strong positive angles. However, although not all areas offered us an edge, there have been some useful findings. Here is a recap of the most interesting:
- Horses dropping in distance outperformed those running over the same trip or those upped in trip.
- Horses upped in distance that ran over five or six furlongs LTO had a poorish record.
- Horses dropping in distance to run over five or six furlongs this time proved profitable.
- Horses dropping in distance more than two furlongs made a small profit.
- Horses racing in Class 2 handicaps having raced in Class 3 handicaps LTO had a poor record.
- Horses racing in Class 2 handicaps having raced in Class 4 to 7 handicaps LTO had a good record, especially those aged three to five.
- Horses whose OR was at least 7lbs higher than LTO made very solid profits.
- Horses carrying the same weight as LTO proved profitable. The stats were much stronger in class 5 or lower handicaps.
- Horses running at the same AW course as LTO performed better than horses that raced at the same turf course as LTO. Both groups outperformed horses that switched courses.
- Horses that changed stables since the last run made an overall profit. Three trainers who had very positive stats in this scenario were Mick Appleby, Tony Carroll and James Owen.
In the second part of this article I will look at combining different areas together as well as digging further in terms of trainer performance within specific areas. Look out for that one next Wednesday.
- DR
Other Recent Posts by This Author:
- Royal Ascot 2026: Must Know Betting Angles
- Analysing Racing Post Ratings (UK Flat)
- Analysis of 3yo and 3yo+ Maiden Races
- Instant Expert for 5f Handicaps: An Analysis
- A First Look Under the Instant Expert Bonnet


excellent article Dave as always.
For this line:
“I do have another strong positive stat to share which is connected to horses whose OR was at least 7lbs higher than LTO. This cohort of runners have produced excellent figures with 401 winners from 1683 qualifiers (SR 23.8%) for a very healthy profit of £223.15 (ROI +13.3%); BSP A/E 1.08.”
is there any breakdown in price for this? or are all qualifers 12 BSP or less
Also anything on number of runs a horse has? Those with say 9 runs or less (unexposed) compared to those that have had 20, 30, 40 + runs
Thanks, Paul
I’m sorry for delay in replying Paul – I’ve only just seen your question. Regarding price on those 7lb+ group, those with a BSP bigger than 5.0 and capped at 12.0 were where the profits came from (153 wins from 917; SR 16.7%; profit +236.85 (ROI +25.8%).
Less exposed 9 runs or less their record is 182 from 669 (SR 27.2%) for a profit of £98.14 (ROI +14.7%).
More exposed (more than 20 runs) have done very well with 94 wins from 431 (SR 21.8%) for a profit of £164.25 (ROI +38.1%).
Hope that helps.
Dave
interesting figures Dave many thanks, somehow we now need to get them identified in Geegeez!!
The exposed aspect surprised me I have to say.
Good Afternoon Dave,
Great read that, very interesting,
Quick question for you, with the in weight change, is the criteria still the same as below.
Firstly, horses must have been at least three years old. Second, they must have had at least six career starts. Thirdly, they must have run in a flat handicap last time out; and finally their price must be 12.0 BSP or lower.
Cheers.
Hi Dave,
I am new to racing, and struggling to understand the OR rating,(so it is the Official rating of a horse),
so when you are saying the OR rating is 7lb higher you are talking about the weight as gone up 7lbs or the the rating has gone up 7 digits.
Hope that makes sense.
Cheers.
Leave a Reply
Want to join the discussion?Feel free to contribute!