
Prepping for the Jumps - Part 5, Bumpers
This the fifth and final article in a series which has been looking forward to the National Hunt season, writes Dave Renham. In the previous piece I discussed handicap hurdles, while for this one, National Hunt Flat races, often called Bumpers, take centre stage.
For convenience, the previous articles are here:
Part 1: Novice Hurdles Part 2: Novice Chases Part 3: Handicap Chases Part 4: Handicap Hurdles
Introduction
As throughout the series, data have been taken from 1st January 2018 to 31st August 2025 with profit and loss calculated to Betfair Starting Price (BSP) with a 2% commission applied on any winning bets. Only UK NH races have been researched, so this does not include Irish racing. Most NH bumpers are run on turf, but there have been a few races contested on the all-weather (roughly 20 every year). I will include both in the breakdowns.
Bumpers are not the type of races I bet in regularly, although I have had some bets in the past in the biggest races held at the Cheltenham and Aintree festivals. Hence, this was a piece of research I was looking forward to because of my limited past knowledge of such contests.
We have had a reasonable number of qualifying races per year, the average being around 270 over the past few years. So, over the time frame this equated to just over 2000 races. I will start as I have done for the previous four articles by examining the betting market.

Market factors
I used Betfair in terms of market rank and this was what I found:

Favourites performed solidly, losing only a small amount (1.5 pence in the £). The value has seemingly been with horses that started third in the betting. However, before we get too carried away, 2024 and 2025 combined proved a poor period for third favs as they lost £69.52 to £1 level stakes incurring losses of 18 pence in the £. As with some data I have shared in the past, I believe the overall profit for third favs was down to variance. Essentially the market has not been giving us great clues.
Let's move on then and, as with previous articles in the series, I have imposed a BSP price limit of 20.0 or lower for the remainder of the number crunching, to avoid any winners at excessively big odds potentially skewing the bottom line. It still included nearly 40,000 runners so the sample size remained huge.
Sex of horse
There will always be more male runners than females but in bumpers the disparity is less stark than in other disciplines. The splits were:

Males edged it in terms of strike rate, but overall, all the key metrics were very similar. It should be noted that losses on the Betfair Place market have been far worse for female runners.
Age of horse
Let me move onto the age stats now. Below are the A/E indices across different ages:

The sweet spot seemed to be with five-year-olds in terms of these figures. The below table covers a broader set of metrics:
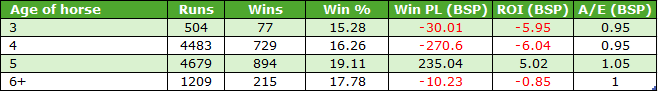
Five-year-olds
As can be seen, five-year-olds had the best figures across all metrics. Not only that, this age group was profitable on the Betfair place market as well, to the tune of £82.12. Compare this to four-year-olds who would have lost us £176.80 on the place market. Overall, horses aged three or four seemed to be at a slight disadvantage, which may simply be down to lack of experience or physical maturity in general.
Five-year-olds were very consistent, which can be seen when viewing their yearly win strike rates:
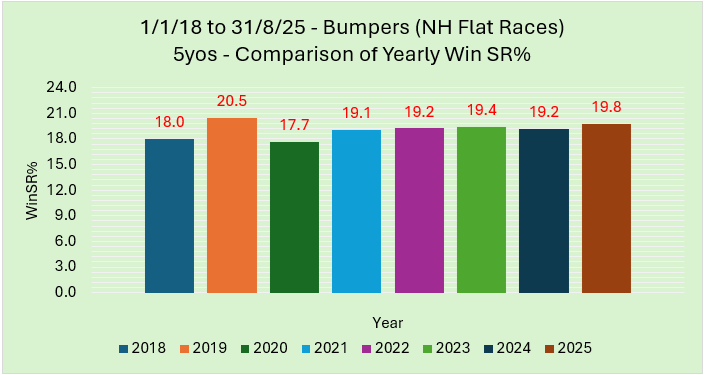
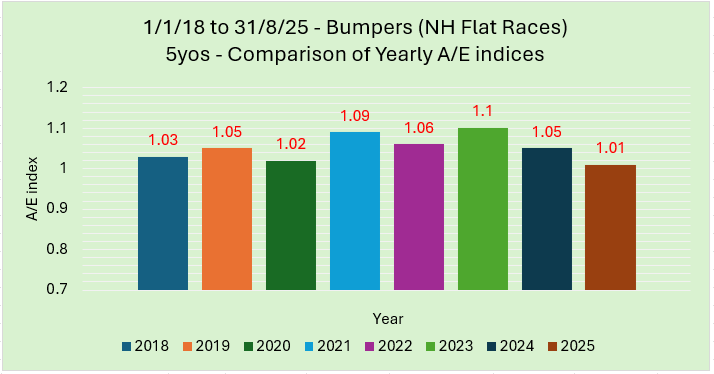
In the last five seasons their strike rate has been virtually the same, with figures between 19.1 and 19.8%. Not only that, when we compare their A/E indices across the eight years, they have all been over the magic 1.00 figure suggesting good value in each year:
Sticking with five-year-olds, it does seem that experience counted for something because if we focus on runners in this age group who had at least two previous racecourse starts their record was 250 wins from 1123 runners (SR 22.3%) for a profit of £147.37 (ROI +13.1%). Meanwhile, five-year-old male runners outperformed their female counterparts, winning 633 times from 3160 runners (SR 20%) for a healthy profit of £221.47 (ROI +7%).
Country of Breeding
I want to look now at some data focusing on the country of breeding. The main country's break down as follows:
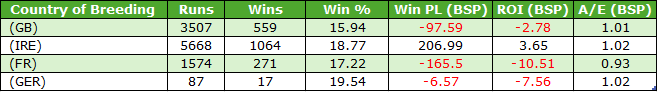
We see similar strike rates for the three main countries of Britain, Ireland and France which often is the case. German-bred runners were far less common but had the highest strike rate. French-bred runners proved relatively poor value overall, while the Irish-bred results were a notch above the rest from a betting perspective. This Irish-bred edge was replicated in the Betfair Place market as the table below shows:
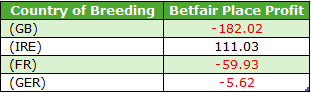
It should also be noted that Irish bumper runners aged five and up produced a return in the win market of just over 7p in the £.
Older French-bred runners have been quite rare, but when aged six or older their record has been poor thanks to 19 wins from 123 (SR 15.4%) for a loss of £36.64 (ROI -29.8%).
Position Last Time Out (LTO)
A look next at some LTO data focusing on the most recent run of the horses in question looking a position the horse finished last time out.
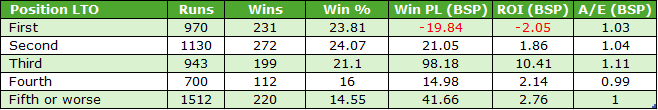
LTO winners made a small loss, while all other groups somewhat surprisingly all proved profitable.
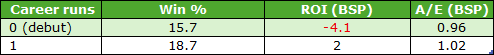
At this point I would like to share the results for horses who had not previously run and hence were making their racehorse debut. This cohort was obviously a big one with 5620 runners in total. Of these, 881 were successful for a strike rate of 15.7%. Losses to £1 level stakes stood at £231.80 (ROI -4.1%); A/E 0.96.
Trainers
Trainer data is always a favourite of racing fans so let’s see what we can find. In the table below all trainers who had at least 60 runners in the study period are shown. The trainers have been ordered alphabetically:
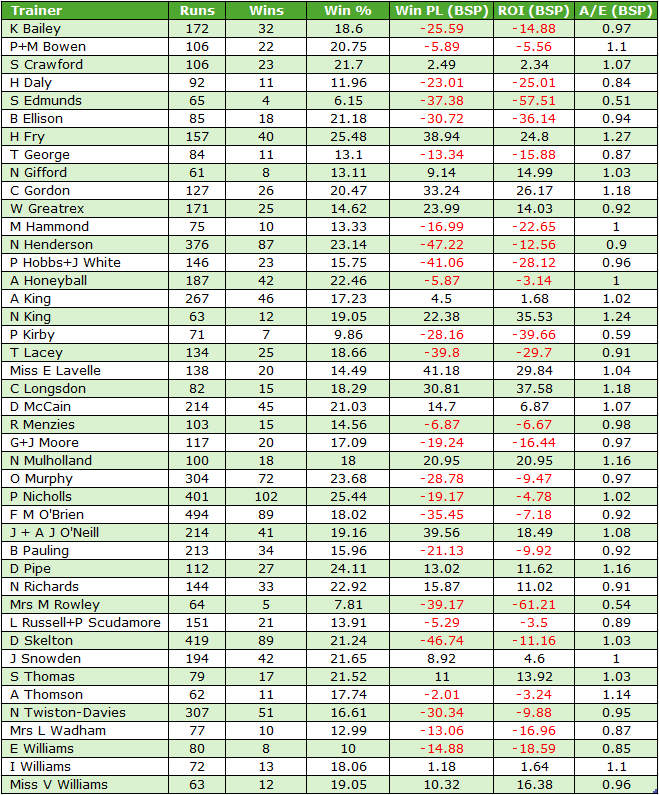
18 of the 43 trainers made a blind profit during the timeframe, while nine managed A/E indices of 1.10 or higher.
From this initial starting point, let me breakdown some of the data, starting with a look at trainer performance when the horses have started favourite. Below is a graph sharing the ROI%s where to qualify a trainer must have saddled 40 or more market leaders.
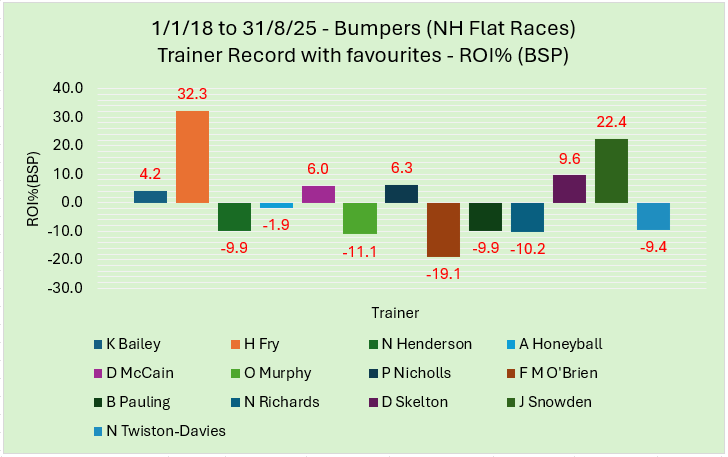
There are some real fluctuations regarding these figures. Harry Fry has had an excellent record with favourites. His ROI of +32.3% came from 21 wins from 46 (SR 45.7%) for a profit to £1 level stakes of £14.87, A/E 1.29. Jamie Snowden was another to have excelled when it comes to market leaders - 25 wins from 50 (SR 50%) for a profit of £11.19 (ROI +22.4%); A/E 1.29. In contrast, Fergal O’Brien has had a poor record with his bumper favourites losing over 19p in the £. His strike rate of 29.1% (35 wins from 119) was lowest of all the trainers shown in the graph. Nicky Henderson’s stats for bumper favourites have also been relatively poor. His record reads 57 wins from 161 (SR 35.4%) for a loss of £15.87 (ROI -9.9%); A/E 0.93.
Debut vs 2nd start
I would like to look now at individual trainer performance comparing horses making their racecourse debuts with horses that had run once previously. To help give us a benchmark, the overall figures for all trainers were as follows:
As we can see from these figures there was a clear improvement for second starters compared to debut runs so we would expect most trainers to conform to that type of pattern.
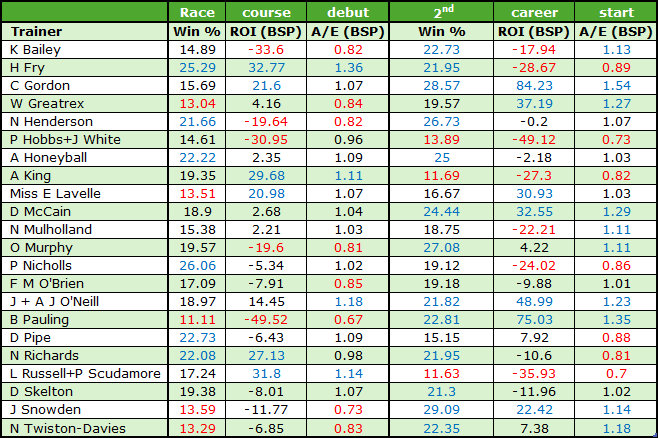
I have put the individual trainer data in a table comparing win strike rates, ROI percentages and A/E indices. Anything highlighted in ‘blue’ is a positive, anything in ‘red’ a negative. My criteria for each, was as follows:

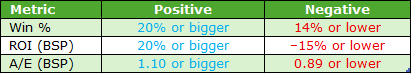
By colour coding it helps us to compare the data sets a little more easily.
There are few trainers I would like to comment upon.
- Harry Fry had an excellent overall record in bumpers over this period and performed extremely well with debutants so keep an eye out for those.
- Alan King’s profile is similar to Fry with his debutants clearly outperforming those having their second start.
- The trainer combo of Lucinda Russell and Peter Scudamore (and now with Michael Scudamore) had an excellent record with debutants, producing returns of close to 32p in the £; A/E 1.14. Second starters, though, struggled losing 36p in the £; A/E 0.70.
- Chris Gordon’s second starters improved markedly in terms of win rate. Their strike rate went up from 15.7% to 28.6%. Second starters proved extremely profitable, too, with returns of 84p in the £.
- Nicky Henderson’s debutants had a decent win rate, but they were overbet based on losses equating to nearly 20p in the £. His runners definitely improved for the experience, and his second starters broke even.
- Messrs. McCain, Murphy, Pauling and Snowden are four trainers to note with second time starters; their runners seemed to come on a lot for the debut run.
Trainer Track Stats
To finish off, there are a handful of trainers who have produced impressive bumper stats at specific courses. They are listed below (ordered by number of runs):
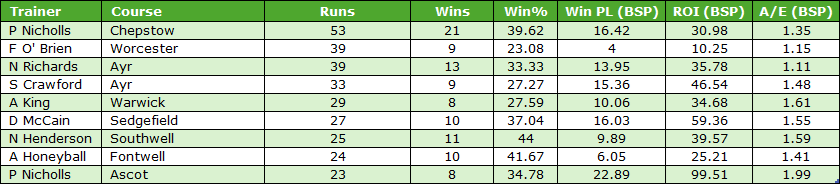
There are some very impressive numbers in this table, although we need to be aware that some of the sample sizes were quite small. Having said that, I will be keeping an eye out for these trainer/course combos this winter.
**
And that concludes the fifth and final article in this series. It's another one chock full of stats that should point us in the right direction in terms of potential bumper bets over the coming months.
Good luck!
- DR
Other Recent Posts by This Author:
- Royal Ascot 2026: Must Know Betting Angles
- Analysing Racing Post Ratings (UK Flat)
- Analysis of 3yo and 3yo+ Maiden Races
- Instant Expert for 5f Handicaps: An Analysis
- A First Look Under the Instant Expert Bonnet


A loss on horses winning LTO possibly due to a penalty. Quite a good laying angle with LTO winners in bumpers.
Leave a Reply
Want to join the discussion?Feel free to contribute!