
Horse Performance: Course, Distance, and C&D Winners Compared
I looked at course, distance, and course and distance National Hunt data a few months back, writes Dave Renham. I will revisit this area now but switch my attention to the flat. I will ignore all-weather racing to write about that in the future. Hence, these findings apply only to UK turf flat racing, and I have looked at the last eight full seasons from 2016 to 2023.
I mentioned last time that there is a perception that course form is necessary; likewise, some see it as a positive if the horse is proven over the distance. In the National Hunt article, previous course winners/distance winners/C&D winners won more often than horses that had not won at the course/distance/C&D. They offered slightly better value despite the market adjusting quite well. Let us see if we see a similar pattern ‘on the level’.
Course winners
I will start with course winners. As we know, courses in the UK are not uniform – the topography for each course varies. Hence, one would assume some horses act better on specific courses than others. I would like to begin by comparing the strike rates of course winners versus horses that have not won at the course (non-course winners). Both win and each way figures are shown:

Course winners clearly perform better from a win and a win-and-placed perspective.
Regarding returns to SP, course winners fare slightly better, although the difference between the two is barely 2p in the £. To Betfair SP, the roles are reversed, with non-course winners doing a little better. As we have seen in various previous scenarios, the betting market seems good at making the necessary adjustments.
Looking at the non-course winner group first, if we split them into two as follows:
1 - those who have previously run at the course
and
2 - those who have not run at the course previously,
then we see that those who have not run at the course have been slightly more successful in terms of win percentage, with an 11.3% strike rate compared to 9.9%. In terms of returns, however, they are virtually identical.
One statistic worth sharing is that horses with no course wins which have raced 15 or more times at the track in question have won just one race from 81 attempts. Such horses are rare but it looks like any future qualifier can be discounted.
Concentrating now on course winners, I would like to start by looking at horses with just one previous course win to their name.
Course Wins = 1
I will split the performances by number of runs they have had at the track. The reason behind this is simple: you could get some horses that have raced once at the course and hence are one from one, whereas you could get horses that are one from 10 or even one from 20. A horse that has just won once in 20 attempts at the same venue will not scream out as a horse that is particularly suited to the track.
Let me share the win strike rates for different numbers of course run groupings:
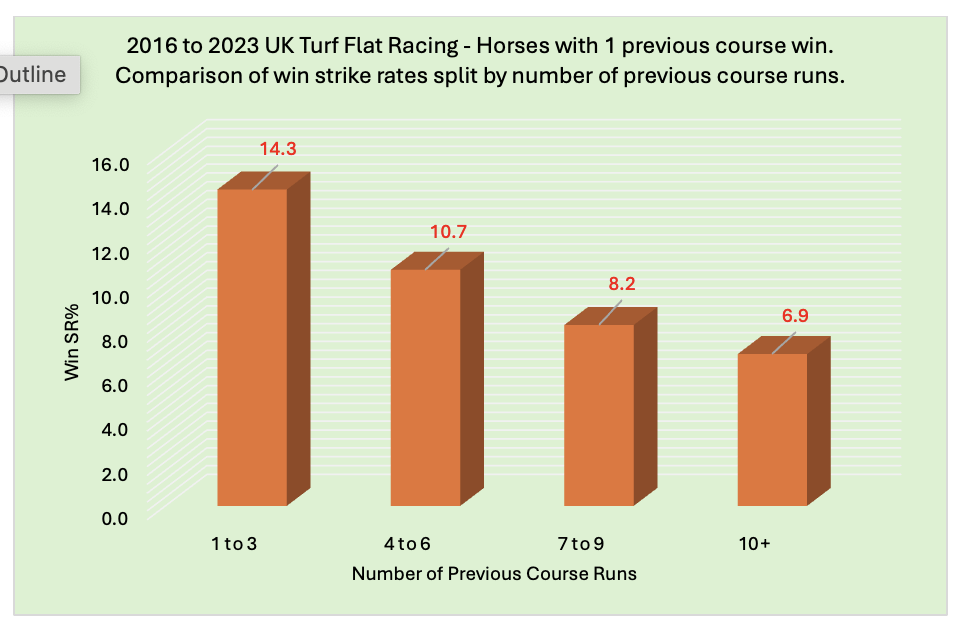
The graph clearly shows that one-time course winners with fewer previous course runs win more often. Horses that have won once at the track but raced there ten or more times have scored less than once in every 14 attempts.
Let's see if the A/E indices correlate with these strike rates:
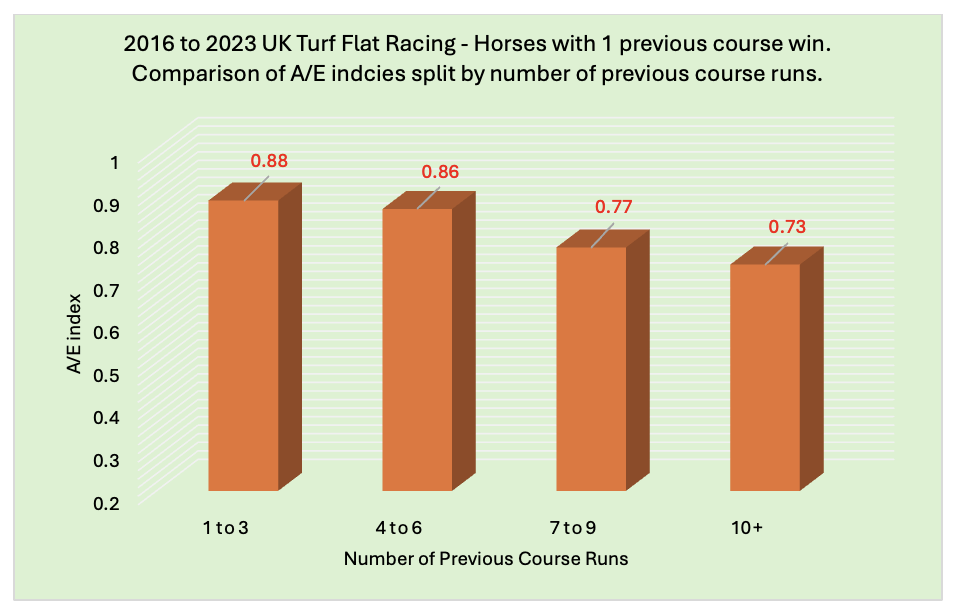
The graph shows a strong relationship between the A/E indices and the strike rates. Any potential value in one-time course winners tails off once we hit seven or more previous course runs.
Course Wins = 2
I will look at the same idea for horses that have won twice previously at the course. Once again, I’ll start with the win strike rates for different numbers of course run groupings:

We see the same pattern as before. It should also be noted that horses with two course wins and that had previously raced at the course either twice or thrice broke even to BSP (ROI was –0.4%).
Onto the A/E indices now:
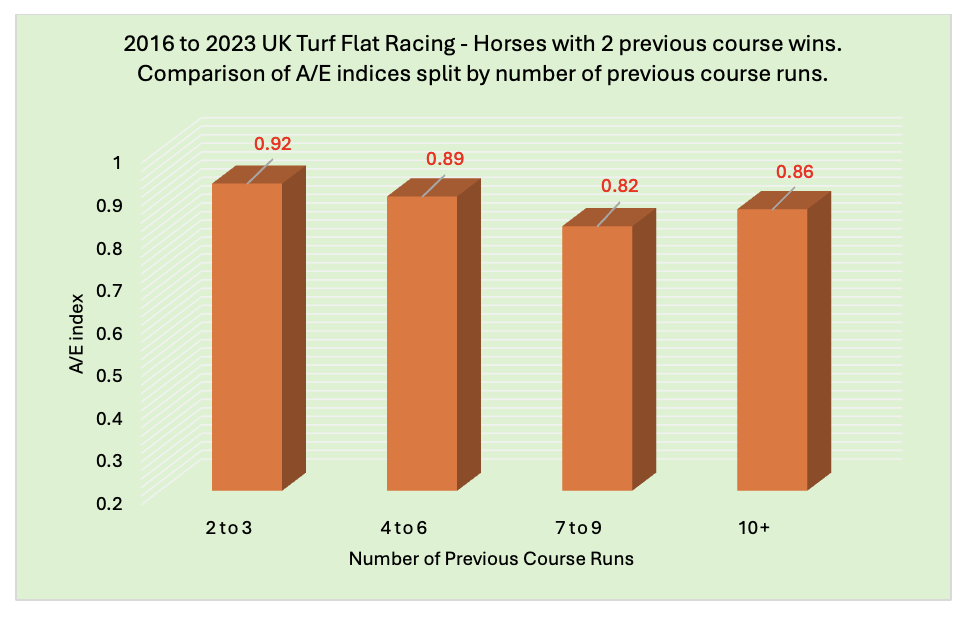
The two to three previous course run group has a very solid A/E index at 0.92. The 10+ group spoils the correlation, but if we look at the complete stats, we can clearly see that the returns to BSP indicate that the fewer previous course runs, the better.
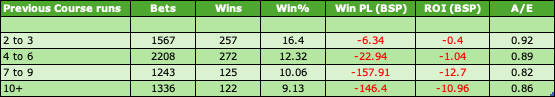
Losses become significant once we get to seven or more previous course runs.
Course Wins = 3+
I will now lump together horses with three or more course wins to give a decent sample size. This time though, as we have different numbers of previous course wins, it makes sense to share the data using past course win percentages. Hence, a horse with three wins from 5 visits would sit at 60%, a horse with four wins from 25 would sit at 16%, and so on. This time I will go straight to a table showing all key stats in one area:
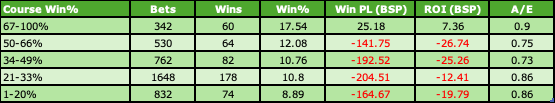
Horses with three-plus course wins and who have previously won at least two-thirds of their starts at the course - the 67-100% group - have by far the best overall figures. They have a much higher strike rate and the best A/E index and have made a small profit to BSP.
We have seen the same pattern across all data sets to date: horses with the best course win rates (based on all previous course runs) perform the best.
Before moving on to distance winners, I want to examine the results for individual courses. To do this, I will look at the A/E indices for horses that have won at least once at the relevant course. Here are the courses with the ten highest A/E indices.
*I am using A/E indices regularly in this piece and if you would like to read more about A/E use this link

Haydock and Epsom have particularly strong indices. Epsom is a unique track, and it will come as no surprise to many that it appears so high on the list. Two courses that have not made the cut, and which I expected to, are Brighton and Chester. They were joint 14th on the list with an A/E index of 0.87.
Three courses have recorded an A/E index of below 0.80: Yarmouth (0.77), Thirsk (0.75), and Carlisle (0.75). Wetherby also has a figure below 0.80, at just 0.71, but the data set is too small to be confident in at this stage.
Distance winners
It is time to switch our attention to distance winners. As with course winners, I will start by comparing the strike rates of distance winners versus horses that have not won at a distance (non-distance winners). Both win and each way figures are shown once more:
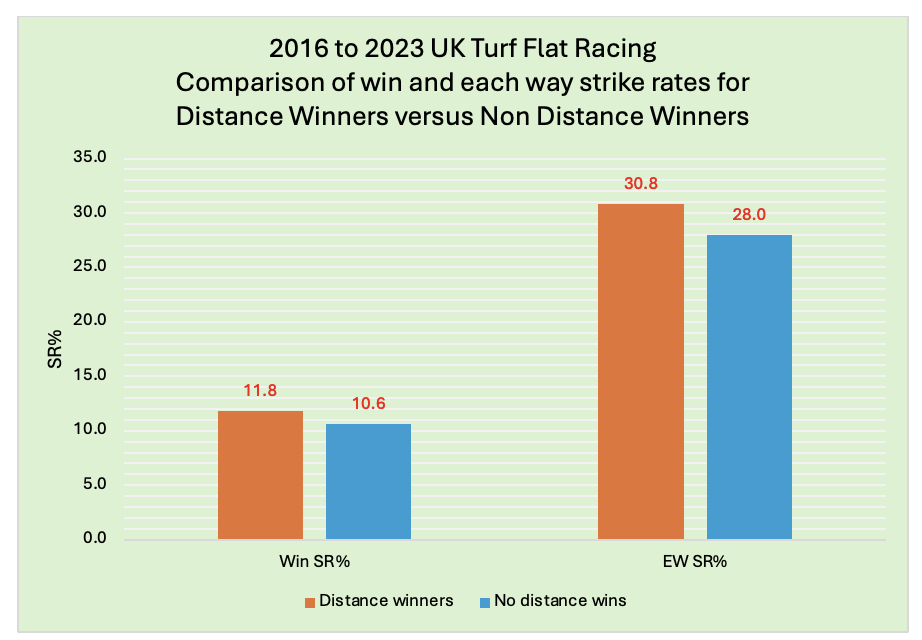
There is a slight edge to distance winners, but they have virtually identical A/E indices at 0.87 and 0.86, respectively. When looking ‘generally,’ winning previously at a distance does not offer much of an edge in turf flat racing. However, it is always worth digging a little bit deeper.
Let me compare past distance win percentages by grouping all past distance winners. Here are the findings:
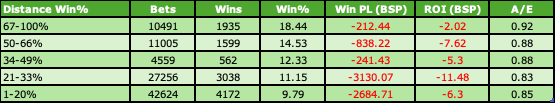
Horses who have previously won at least two-thirds of their starts at a particular distance did best, and showed a very solid-looking A/E index of 0.92 with losses of just 2p in the £. This presents a similar pattern to when I combined the 3+ course win data earlier, especially when considering that top group.
Next, I decided to examine whether it makes a difference how recent the last distance win was. This is what the stats told me:

Unfortunately, this data offers little, with the only discernible general pattern being that the more recent the win, the more likely a horse is to repeat that win. That may very well be conflated with the fact that recent winners overall are more likely to win again the recent non-winners.
After further digging, I discovered the most interesting findings concerning distance winners.
1. Looking at horses aged 5+, if you restrict this cohort to having won once at a distance on their only start at that distance, they have proved profitable to follow. Hence, if backing ALL 5yos and older with one distance win from one distance start when having their second start at the relevant distance, you would have won 133 races from 862 qualifiers (SR 15.4%) for a BSP profit of £220.34 (ROI +25.6%). These runners have an A/E index of 1.01 and have been profitable for the past five years.
2. Horses with three wins from three starts at the same distance have proved profitable to follow when they have attempted to make it four distance wins out of four. They have won over 28% of the time (53 wins from 188) for a BSP profit of £62.52 (ROI +33.3%). The A/E index stands at an impressive 1.13.
3. Horses aged nine or older that have achieved two distance wins in their careers have proved to be poor investments, regardless of how many distance runs they have had. This group has provided 921 runners of which only 56 won, hitting a win percentage of just 6.1%. Backing all qualifiers to £1 level stakes would have lost you £216.64, which equates to over 23 pence in the £.
4. Two-year-olds with two or more distance wins have made a profit when attempting the distance again. They have 144 wins from 891 (SR 16.2%) for a BSP profit of £38.23 (ROI +4.3%).
Course and distance (C&D) winners
It is now time to combine the two elements. I will start by comparing the strike rates of C&D winners versus horses that have not won over C&D (non-C&D winners). Both win and each way figures are shown once more:
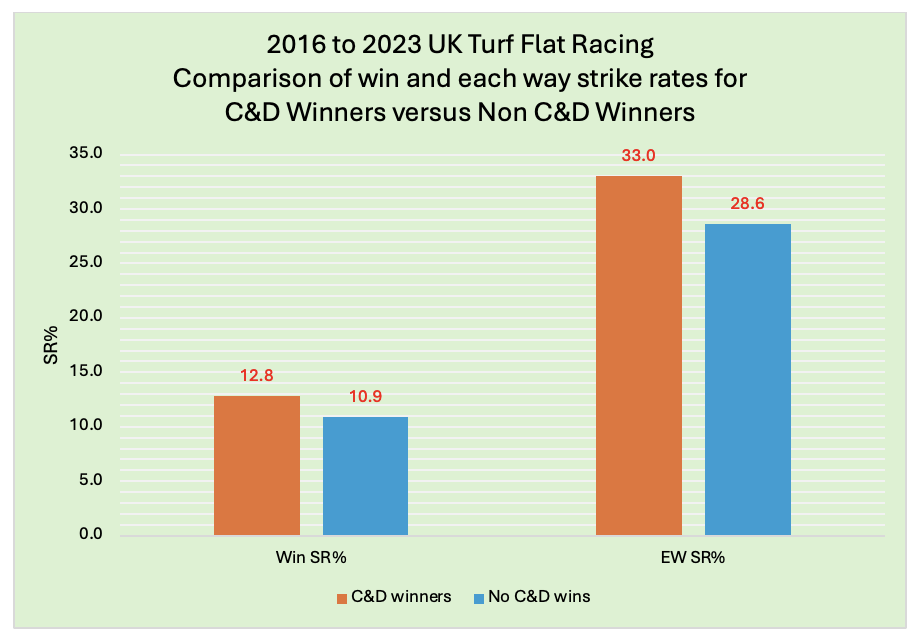
These are the highest win percentages we have seen for the ‘winning’ group to date, but only just. The returns to SP have been virtually identical, with a wafer-thin edge to C&D winners; but, to BSP, non-C&D winners have proved better value by nearly 6p in the £ (4% loss compared with 10% loss).
On to the win strike rates in terms of the number of C&D wins. Here are the splits:

The results for 4+ C&D winners are the reverse of the National Hunt findings. In NH races, horses that had won four or more times over course and distance scored 15.5% of the time, procuring a healthy return of over 41p in the £. On the flat, this group scored less than 10% of the time, losing over 34p in the £.
It is past C&D win percentages I want to look at next. I am using the same percentage bands/groupings as before:

We see the usual trend of the strike rates dropping as the C&D win percentages drop. Once again, the best overall stats are the group with the highest C&D Win% of 67% or more. It is possible that some value bets could be found within this group.
Individual course C&D data is the next port of call. Courses are listed alphabetically with ‘positive’ A/E indices (0.93 and above) shown in green and ‘negative’ indices (0.80 or lower) shown in blue. Profit/losses have been calculated to BSP less 5% commission:
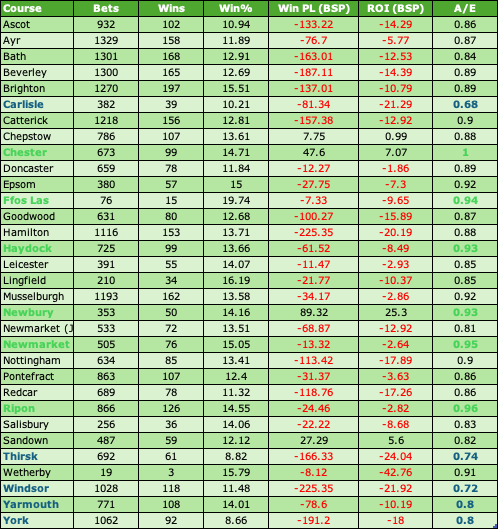
Just two of the six ‘green’ courses (Chester and Newbury) managed a blind profit to BSP. Generally, though, the takeaway should be to avoid C&D winners from the courses in blue, especially Carlisle, Thirsk, Windsor, and York.
Finally, I want to share the trainers who have performed best with past C&D winners when comparing their performance to their non-C&D winners. Seven trainers are listed in the table below, comparing their win percentages for the two respective groups:
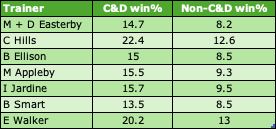
These seven all perform above the norm when it comes to past C&D winners. Five of the seven have produced blind profits to BSP with their C&D winners, with six hitting A/E indices of 1.00 or bigger. Here are the individual figures for these past C&D winners:
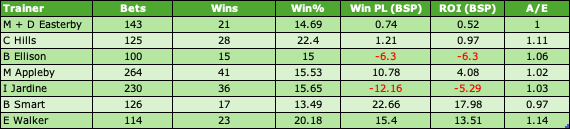
There are some solid statistics there. It will be interesting to see how these trainers fare in the next few years with their past C&D winners.
**
Summary
To conclude, previous course winners, distance winners and C&D winners clearly win more often than horses that have not won at the course/distance/C&D. However, evaluating the better value is more complicated. Generally, course, and course and distance, winners give better results than do distance winners.
I will leave you with what I feel are the most interesting findings:
1. For horses which have won once or twice previously at the course, stick to those horses that have raced six or fewer times at the venue.
2. With horses that have won three times or more at the course, focus on horses that have won at least two-thirds of their races (67%+).
3. Past winners returning to Haydock, Epsom or Ripon can be seen as a positive.
4. Horses that have won at least two-thirds of their races (67%+) at today's race distance are the best distance group to concentrate on (losses of only 2p in the £).
5. Avoid horses that have won four or more times over C&D. They tend to be over-bet.
6. Chester and Newbury are courses where C&D winners generally perform above the norm.
7. Be wary of past C&D winners at Carlisle, Thirsk, Windsor or York.
8. The stables of Mick and David Easterby, Charles Hills, Brian Ellison, Mick Appleby, Iain Jardine, Bryan Smart and Ed Walker have all done well with previous C&D winners.
Until next time...
- DR


