In the third part of Silly Question Friday, where the only silly questions are the ones you didn't ask, I cover your unknowns in relation to Geegeez Gold.
This is in a video format and covers, amongst other things:
- Tips on using the Tracker tool
- Things you can (and can't) do with Query Tool
- Geegeez Gold vs Proform
- How to use the ratings features
- How draw 'thirds' are calculated
- Overcoming small draw/pace sample sizes
- and much more
I hope you find something of value in it.
Matt
https://www.geegeez.co.uk/wp-content/uploads/2019/09/SQF.png320830Matt Bisognohttps://www.geegeez.co.uk/wp-content/uploads/2022/10/geegeez_banner_new_170x78.pngMatt Bisogno2019-10-11 05:04:412019-10-11 06:15:20Silly Question Friday: The Gold Edition
Report Angles is a very powerful element of Geegeez Gold. It enables users to see only those qualifiers from hand-picked reports they want to see, and it homes in on value bets time and time and time again.
In this short video, I show you what Report Angles is; how to set it up for the two main types of users ('find me a bet' and 'give me more detail on this race'); where to find the information; and a few tactics you can put to work for yourself.
I hope you like it.
Matt
https://www.geegeez.co.uk/wp-content/uploads/2017/12/reportangles830x320.png320830Matt Bisognohttps://www.geegeez.co.uk/wp-content/uploads/2022/10/geegeez_banner_new_170x78.pngMatt Bisogno2019-07-17 21:31:552019-07-18 12:11:46Report Angles: How To Find Value Bets in Seconds
It's been raining. Rather a lot. Those courses which have dodged the abandonment bullet are largely racing on heavy ground just now, and that presents a challenge for us punters because most horses have little or no form on such a testing surface.
So how do we mitigate for this? Plan A for most is to guess. Not ideal.
Plan A for Gold subscribers should be to do a little digging; and in this shortish video I'll show you a couple of ways - via Instant Expert and the Query Tool - to home in on those sires whose progeny might be worth marking up when the mud is flying.
With the Goodwood May festival upon us it seems as good a time as any to apply a little focus to the Sussex track, writes Jon Shenton. The hope is we'll discover a few snippets of info along the way to boost our chances of a profit at the course over the rest of the summer and beyond.
Racing has been an integral part of Goodwood history since 1802. The track is synonymous with the Glorious Goodwood festival with its three Group 1 races taking a prominent position in the racing calendar. There’s much more to racing at the course than that shiny centrepiece, however, and there are plenty of other meetings and notable races to enjoy throughout the flat season.
As usual, let’s start with the training performances at the track.
Goodwood trainers
The table below shows the trainers who have high-quality records at Goodwood. The data within relate to runners with a maximum SP of 20/1, and are sorted by descending A/E and include all races from 2012 onwards. To qualify the yard must have had a minimum of 50 runners during the period.
For those of you who have been following these articles over the recent past, you may remember the Mark Johnston editions. I don’t want to trample over old ground but suffice to say Johnston handicappers who have had a recent run (last 25 days) are a serious proposition. Whilst this angle wasn’t as lucrative in 2018 as previous years the performance has been consistently impressive over time. Those are horses to keep on your side. A link to that article is here.
The other notable name to take from the trainer table is William Haggas. It’s the Impact Value of 2.52 which immediately draws the eye, especially on what is a healthy relative volume of runners. As you might expect with stats such as these there is a general all-round excellence contained within. The only significant and justifiable enhancement I could establish is associated to the age restrictions of races.
The data show, amongst other things, that his record with 2yo's and in 4yo+ races is perfectly respectable. It isn’t, however, quite as sharp as the races containing horses aged 3. It’s low volume stuff though, with the place performance consistent across all groupings indicating that I might be looking for something that is not there. As a result, I’m not convinced that there is an angle beyond keeping Haggas horses firmly in your cross-hairs at Goodwood.
Moving on, those yards which currently have less than desirable records at the track we get the following picture:
I was very surprised that Saeed bin Suroor is top (or bottom) of the pile with an A/E of just 0.52. Messrs Fahey, Varian, Hannon and Balding are all on the list too with Fahey’s runners returning a strike rate of a meagre 6.6%. Perhaps these yards are too proficient to stay on this cold list indefinitely and the cream will rise to the top in due course. Here and now, though, the numbers demand we proceed with caution.
To complete the trainer view, the table below contains the best trainers (in terms of A/E) for Goodwood during the month of May, perhaps offering a couple of clues for the next few days. Not that I’d advise anyone to back runners from these yards blindly but there are some impressive numbers in here, Roger Charlton most notably. That said, there is a danger of the data reverting towards the mean based on such small volumes.
Jockeys
In terms of the pilots, the data below show all active riders with an A/E of greater than 1.00. William Buick probably has the stand-out record. Again, all round excellence means dedicated deeper focus angles are difficult to find.
The deadly duo of Norton and Fanning have a very close association to the Goodwood-friendly Johnston yard. Therefore, it would be reasonably logical to assume that their records could be attributable to the trainer connection. The intel below shows that whilst that is undoubtedly true, when they are jocked up on rides for other trainer, performance remains largely in line.
Whilst this may be of limited interest in isolation, I think it may lead towards a question of pace. In general, Fanning and Norton are considered to be enterprising riders at the front of a race. Perhaps they prosper at the track irrespective of who is employing them because of their propensity to effectively judge pace from the front? More on that shortly.
Straight track pointers
As the course map below illustrates, Goodwood has a complex array of starting points, routes and undulations. The least confusing element is perhaps the confirmation on the map that there is a straight track for races up to 6 furlongs in distance.
Before searching for clues on how best to tackle the straight course, it must be noted that analysing the factors of pace and draw (like I’m going to here) in a broad way is a challenge. There are several variables that need due consideration, field size and ground conditions being the primary drivers of variance in determining how the race unfolds from a pace and draw perspective.
Fields here can range from 2 to 20-something, and underfoot conditions obviously can vary meaning that many multiple permutations can exist. All the same, there is merit in attempting to decode the data.
Draw
First let's look at the draw.
Using the draw analyser tool in Geegeez Gold the table below shows the performance of horses, by draw segment and based on the number of runners in the race, using Impact Value. I’ve only analysed races with six or more runners and I've used the actual drawn position (i.e. accounting for the effect of non-runners) rather than the race card drawn number.
The data covers all race ground from Firm through to Soft. As noted in the above paragraph going conditions can have a significant impact on draw stats. However, in the case of Goodwood it’s fair to assert that the numbers on display are reasonably representative of the whole spectrum of ground challenges faced by the animals.
Here is a graphical representation of the very same data.
I include this as I think it illustrates a clear picture: horses that are drawn in lower or middle stalls are far more likely to prevail than horses drawn in high stall numbers on average. This applies to all nearly all field sizes (apart from arguably in 8-10 runner fields where the delta appears marginal) and to both 5- and 6-furlong distances.
The red line (representing those animals with a high draw) deteriorates the larger the field in general terms, especially if the race comprises of 11 or more participants.
The highest drawn are stationed on the stand side rail, nearest the cameras, the numbers thus progressively moving lower towards the centre and beyond to the far side. Racing usually develops between the middle and that stand side rail as a few horses generally tack across in that direction.
A rail is often an asset to have nearby but for this track it appears to be far from the case. Let’s complement this with a sprinkling of pace data using the Pace Analyser tool in Geegeez Gold.
The table below is based on the same conditions as the draw data above:
It is perhaps unsurprising that being on the speed early is an advantage over the sprint distances.
Putting both pace and draw together you’d expect a low/middle draw with a prominent or front running run style to be optimal. We can validate this by checking the draw/pace heat map (in Geegeez' Draw Analyser).
This picture covers 5- and 6-furlong races, on Firm through to Soft where there is a field size of 9 through to 12.
Interestingly, it appears as though a high draw is acceptable if the horse can zip out of the gates and secure an early lead. It could be claimed, using this data, that pace is of more importance than draw. High drawn horses who get to the front are 1.43 times more likely to win than the average in spite of the ostensibly challenging stall position.
That makes sense: racing room can be at a premium at Goodwood and it’s very feasible that horses get boxed in, especially in a big field. Those high drawn animals can have nowhere to go if horses congregate and the race develops on or around that rail or side of the track. The jockeys starting their journey from the low and middle numbered stalls should have more options to avoid trouble in running; unless of course the field sizes are so large that the low numbered stalls are situated on the far side rail as in, for example, the Stewards' Cup.
A heat map taking account of field sizes of 14 or more confirms the thinking:
In large fields even prominent racers struggle to get the run of the race from a high stall position, probably due to the relative lack of options in running. Horses drawn low retain a degree of flexibility in how they approach the race and can win from off the pace. Now all that remains is to find the right horse that this might apply to on race day!
Round course and longer distances
The 7-furlong trip has just shy of a quarter of a mile from the stalls to a tight right-hand bend into the straight. Most races develop on the far rail, the opposite to the straight track races.
Again, early speed holds sway. Attaining good track position at the bend is clearly of primary importance. Evaluating the draw for the trip over seven using the graphical format (below) shows the significance of stall position.
Whilst it’s reasonable to say that low draws generally have an advantage it only appears to become a concerted one in double digit field sizes. In these larger fields low drawn speed merchants around the bend are very much of primary interest!
In smaller fields pace is still an advantage but, naturally enough, draw appears to be less relevant. Like the straight course, high draws are perfectly fine if you think your horse can get to the front early and control the fractions. In basic terms, if you can pick the leader early in the race consistently over seven furlongs at Goodwood you will have a strong hand to play over time. The same principles apply over the mile too.
Distances greater than a mile
The races between nine furlongs and two miles are represented from a pace angle in the data presented below. There is perhaps a marginal preference for front running speed in general apart from the shorter relative distances (9 & 10f) where early speed is a significant advantage.
It’s repeating the same message: the major takeaway from the data is the reinforced view that it is difficult for hold up horses to win in larger fields. That makes perfect sense given the tight and undulating nature of a track where hard luck stories seem commonplace. Let’s hope that you’re not on one that falls out of the stalls!
That’s it for another edition, I hope you find things of interest in the above and I’ll certainly be watching Goodwood races with a keener eye than usual over the next few days and months. Good luck!
We've added some new features to Geegeez Gold, and updated some existing ones. The video below explains all, but here is a brief summary of what's new:
- Added Weight For Age (WFA) consideration to ratings calculations (and updated existing ratings to reflect the WFA scale)
- Added the ability to rate a race, and to price it up, from within the card
- Published user ratings within the inline form on the racecard
- Added option to view pace maps based on last 2, 3 or 4 races
Check out this short video which demonstrates the new features...
https://www.geegeez.co.uk/wp-content/uploads/2019/05/MyRatings.png320830Matt Bisognohttps://www.geegeez.co.uk/wp-content/uploads/2022/10/geegeez_banner_new_170x78.pngMatt Bisogno2019-05-23 11:37:322019-05-23 11:37:32New Gold Features: Rate a Race, Pace Average
I'm really pleased and excited to be able to announce some significant upgrades to Geegeez Gold today. They are:
User notes and ratings
Instant Expert inline form, and 'select a rating'
*IV3* Draw feature
The video below demonstrates how they work and, below that, I've copied sections from the User Guide for those who prefer to read rather than watch/listen.
I'm already using the new features myself every day and I'm sure many of you will soon find them as indispensable as I do.
Here are the relevant User Guide sections...
Instant Expert Inline Form
As of April 2019, users may now select a particular form ‘block’ with a click or tap and view the related form lines.
For example, clicking anywhere in the ‘[2][2][100]’ Course block for Flying Verse opens an inline block with that horse’s two course runs in the selected context. The chosen block is highlighted.
Click the block again to close the inline form, or select another block to view further form.
IV3 Data
Introduced in April 2019 is IV3. IV3 stands for Impact Value 3, and is simply an average of a stall and its nearest neighbours. For instance, the IV3 of stall six would be the average IV of stalls 5, 6 and 7.
N.B. Stall 1 is calculated as the average IV of stalls 1 and 2, as is the highest stall.
This simple calculation helps to smooth the curve on our draw charts and isolate genuine biases, as in this example:
User Ratings and Notes
A major new addition in April 2019 is the ability for users to add notes and up to two ratings per horse performance.
Ratings Setup
Before adding ratings, many users will elect to create scales which enable auto-calculation. These are simply pounds-per-length calculations based on distance and optionally going. This is undertaken via the My Ratings Settings page, found in the Notes & Ratings dropdown on My Geegeez.
My Ratings Settings
The My Ratings Settings page looks like this:
Each of the blocks represents a different combination of race code and going range. These are the default settings, and ratings are calculated based on the priority sequence of the blocks (in case of overlap between race code/going range).
Users are able to add or remove blocks using the buttons; re-sequence the blocks by dragging and dropping them; and also to restore the defaults.
Once any setting revisions have been saved, ratings for beaten horses will be calculated automatically based on these settings and the winner’s given rating.
Adding Notes and Ratings
Notes and ratings are added from within a race result. The default layout is for the functionality to be hidden. Clicking ‘Show Ratings’ to display the ratings features.
Once ‘Show Ratings’ has been clicked, the page re-formats as follows:
Adding Notes
Notes may be added at the MEETING, RACE or HORSE level. Notes are auto-saved when a user clicks elsewhere on the page, but it is strongly recommended to use the ‘SAVE’ buttons provided.
Adding Ratings
To add a rating, enter the winner’s figure into the box Rating 1. The Lbs/Length box is pre-populated based on the Rating Settings page data but may be over-written if required.
By default, R1 and R2 are both checked, which allows a user to create two ratings at the same time. However, the ratings would be calculated using the same Lbs/Length scale. If, for example, R1 was a form-based rating and R2 was a time-based rating, a user may want to use different figures for the winners but have the beaten horses’ figures calculated from the same Lbs/Length scale.
If a different scale is required, the user must uncheck R2 whilst producing the R1 ratings; and then uncheck R1 (and check R2) to produce the R2 ratings. Most users will only produce one set of ratings.
Once the winner’s rating has been entered and the CALCULATE button pressed, the beaten horse’s figures are automatically calculated. Click ‘SAVE RATINGS’ to save.
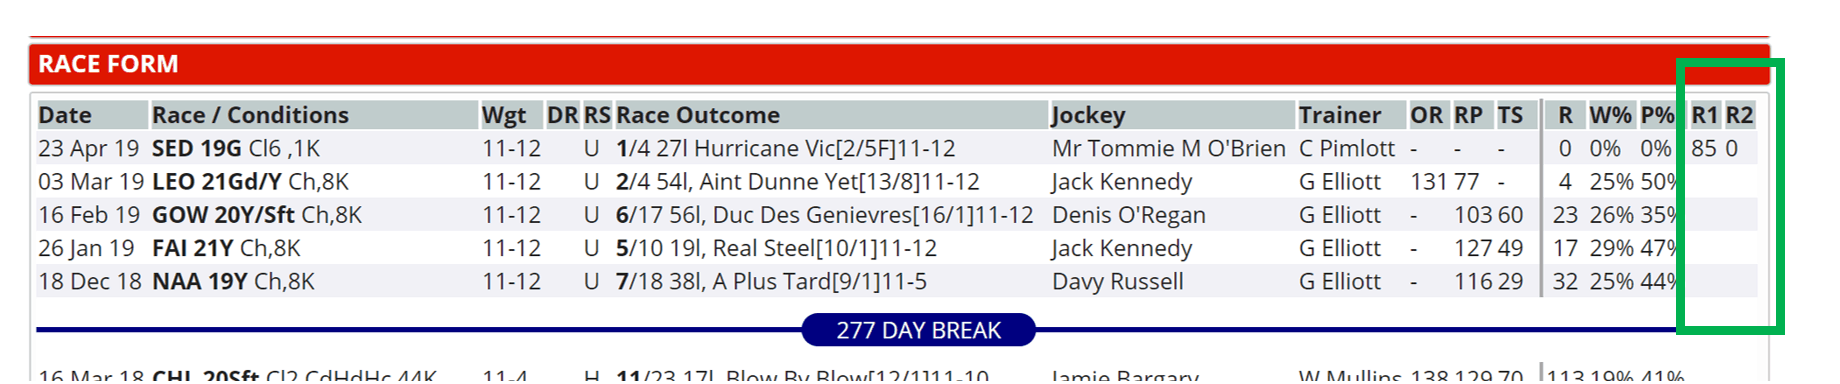
Viewing Notes and Ratings
Notes and ratings may be viewed within the Full Form tab. Ratings are displayed on the right-hand side. N.B. Users must opt to display the ratings from the My Racecard Options section on the My Geegeez page.
Notes are displayed by hovering over elements of the form line, as follows:
Date – meeting note
Race / Conditions – race note
Race Outcome – horse note
Exporting Notes and Ratings
Users may export any generated notes and ratings content to csv from the My Geegeez page. Select the ‘Notes & Ratings’ section, and then click DOWNLOAD CSV.
https://www.geegeez.co.uk/wp-content/uploads/2019/04/AprilGoldUpdate.jpg320830Matt Bisognohttps://www.geegeez.co.uk/wp-content/uploads/2022/10/geegeez_banner_new_170x78.pngMatt Bisogno2019-04-24 17:38:382019-04-24 17:38:38BIG New Additions to Geegeez Gold
In today's video post, I'm delighted to share with you TWO brand new features we've added to Geegeez Gold. Like everything else in your Gold subscription, both are designed to assist you in making your betting more fun and more profitable; and, also like everything else in Gold, we've tried to make them as configurable and user-friendly as possible.
So, what are these new features?
Bet Tracker
The Bet Tracker has been in development for a little while now and I'm really excited to share a 'beta' version within the live Gold service. Beta means there might be a few bugs we've missed and, with your help, we'll get those ironed out as soon as possible. Having said that, for a major new feature, I think - at least I really hope - it's in pretty good shape.
So what is Bet Tracker? It's an unobtrusive means of recording your daily betting activity and subsequently monitoring your performance. As the video below demonstrates, you'll be able to drill down into your overall racing betting to see where you're most effective and, just as importantly, where you're losing more than perhaps you ought to be. You can review your history by course, distance, field size, trainer, jockey, race code, handicap or not, race class and more besides.
Watch this shortish video to discover more about our brand new feature, Bet Tracker:
Bet tracker software is selling for £100 a year - that was the first result I saw in a google search - but you get it bundled with your Gold subscription. And this is just Phase 1. In future, we plan to add Betfair SP functionality as well as more analysis variables and output options. For now, though, I hope you like the Geegeez Gold Bet Tracker.
*
Two New Ratings
Establishing how good a horse is can be a most subjective matter. Collateral form and official ratings help, of course, as on Geegeez Gold do Peter May's SR figures. To those, I'm pleased to be able to share with you two further sets of ratings, provided by Racing Post. They are Racing Post Ratings and Topspeed ratings.
Both of these sets of numbers, as well as OR and SR, can be switched on or off to suit your personal preferences. The short video below reveals (and hides!) all.
For those of you who like ratings, I hope this is something you'll find valuable as part of your Gold subscription.
https://www.geegeez.co.uk/wp-content/uploads/2019/03/bettracker_830x320.png320830Matt Bisognohttps://www.geegeez.co.uk/wp-content/uploads/2022/10/geegeez_banner_new_170x78.pngMatt Bisogno2019-03-26 11:32:262019-03-26 18:32:08Geegeez Gold: Introducing Bet Tracker and New Ratings
I received an email yesterday from a subscriber, Jack, who was struggling to make Gold work for him. He had a fairly set way of doing things on another site (absolutely fine, of course) and the migration to Geegeez was a challenge. Of course, we humans largely resent change - I certainly do!, so there's needs to be a good reason for making the switch. I like to think that we offer a plethora of such good reasons.
Anyway, in answering Jack's email, I thought the content might be useful to others, so I've reproduced his questions and my responses below. I will try to do occasional case studies like this to help introduce the various elements of Gold, and how you might incorporate them into your own betting.
OK, here goes - Jack's note first, and then my reply:
Hi Matt
Thanks for taking the time out for this. As I said to Chris I don't know how you guys manage to fit everything in to 24 hours/day!!??
Anyway here goes.
I use Classes 3 - 5 handicaps up to 1 mile on the flat and Classes 2 & 3 handicap chases up to 3 miles over jumps. Prefer to see no 3YOs in flat races and so prefer the 4+ races to the 3+ but they're a bit scarce after the first month or two. 3YOs can make big improvements as they grow stronger with age and gain experience but unfortunately there's no way to calculate that.
On the flat I like to find horses which have previously run well at the course and distance and have a chance when comparing today's OR to their last few runs and hopefully their run/s at today's CD, using the admittedly over-simplistic 1lb/1pt OR for each length beaten no matter the distance. I prefer the race to be at the same class or below that of it's usual races.
As an example if we stick with Joegogo in the 7.45 at Chelmsford on Thursday I can immediately see that 6 runs ago it ran in a class 3 over CD and came 4th of 6 but only beaten 2L, that it is now 6pts OR better off in today's race and, hovering over the race to bring up the comments, I note that it led in that race, faded late on and lost 2 places. I would expect it to do better in this weaker race so should at least make the frame. Looking at its last 3 races there are conceivable (admittedly a bit feeble) excuses for all of them! 3RA Wolves - came after a break so maybe not completely wound up, 2RA Southwell couldn't get the lead, LTO Lingfield, not a course brilliant for front runners and faded in final furlong over 6f. Now back at 5f.
Will be interesting to see if Adam Kirby again takes the ride although I would prefer a good apprentice to a) take a bit of weight off and b) hopefully deflect the bookies/other backers away from the horse - Adam's presence on it's back would probably lose a couple of points but would at least point to the horse being fit and well and having a chance.
All the above takes me only a minute or two, having done it for so long.
I would then switch to GeeGeez Gold to check the draw, pace and to quickly find out how the other runners in the previous Chelmsford race did as well as its last 3 races. Unfortunately this can only be a rough guide as without digging deeper there's no way of telling if those that have run since did so in better or worse races. If a horse/s still looks promising on Gold I would then go back to the RP to do the deeper digging.
Over the jumps I simply look for horses which have been running in better class races than today's. Not too bothered about the OR. Look to back those which have previously done well at the same type of course as todays, if not having run there before e.g. tight left/right handed, left handed galloping etc. So if a horse has been running well at say Market Rasen, Ludlow and Taunton I wouldn't be in a rush to back it at a left handed galloping course. Having backed horses since Blakeney won the Derby back in 1968 I know all the courses by heart so that only takes a couple of seconds. I don't bother over much with either the distance (as long as it's under 3m) or the going over jumps as I've missed winners doing that. I think the 'sloggers' come into their own once past 3m and find it difficult to evaluate those races.
In both codes I don't check how the trainer's doing - if badly then maybe today's runner will be the catalyst for a revival in stable fortunes! And if a 7lb claimer hasn't scored yet then maybe today's the day! So maybe I look a bit too much on the bright side! Also, as Gold has good info on trainers, jockeys and combos etc, I do realise that I'm not using it to its full extent but think that sometimes simple is better.
As I mentioned before all the above does not take long on the RP site as I've been doing it for years and I can fairly quickly go through all the runners in a race but it seems much slower for me when I use the Gold site. Maybe it's just a case of getting quicker as I use Gold.
The other thing that bothers me about Gold is that sometimes the draw advantage seems to come from relatively few races, especially when compared to FlatStats as I mentioned before. I like the way FlatStats lays it out e.g.'472 horses from 44 races analysed. Date range: 11-Jan-15 to 06-Dec-18' and followed by the charts. As it's free for this I tend to use it quite often.
Well that's enough of my ramblings and please don't spend much of your precious time looking for ways to help - I'm probably beyond help anyway!
All the best
Jack
Some really good and interesting points - and here is my reply...
Hi Jack
There is nothing in what you do that cannot be done on Geegeez. Regarding race selection, you can use the filters on the cards menu – I’ve filtered for C3-5 flat handicaps today in the first image below.
Race card menu filters for handicap, race code and race class
Course and distance form: best view is Full Form, where you can select the ‘course’ and distance’ filters. Joegogo Chelmsford example below. I’ve also checked Proximity Form there, which gives a traffic light view of how well the horse ran based on race distance and beaten lengths. Also on Full Form, you can see DR and RS columns: they tell you the draw – in this case six (of six) – and run style, in this case Led. Filtering a horse’s form by wins and/or places often highlights a pace preference/requirement; it also offers clues as to whether a horse ran well from a poor draw, or poorly from a good draw, etc. Finally, at the right side of the form line in Full Form, you can see that the race in question has R W P W% P % - that shows the subsequent form of the race. In this example, 18 runs, 0 wins and 3 places. So not spectacular in truth.
Full Form with Proximity form, Course and Distance checked
Checking Instant Expert will reveal overall form at the respective course, distance, class and field size (going too). The final column compares today’s OR with the horse’s last winning OR in this code. Again below is Joegogo, where we can see he’s four pounds below his last winning OR on the all-weather. (I have my settings to last 2 years form, and race code/hcap contextual – i.e. when it’s a handicap, this view is only showing me handicap form, and when it’s all-weather, it’s only showing me all-weather form; when it’s both, it’s only showing my AW handicap form).
Instant Expert shows form against the race conditions, and also an OR comparison against the last win in this code
For the jumps, you could use the Class Move report as a starting point – it’s here – and sort by those dropping in class. See image below. The reports are a treasure trove, and it’s worth spending a little time messing around with them, as you’ll discover all sorts of ‘ins’ to various races.
Class Move report can be sorted to show those horses stepping down (or up) the most in grade today
Regarding looking for horses which have done well on today’s type of course, again Full Form has filters for course direction, general profile and specific profiles, so you can easily see how your potential class droppers have fared on similar tracks. I personally think trainer form is more important than you do (!), but I always check the place percentages as well as the wins. They tell far more of a story than the headline win numbers. (We have green and red form indicators on our racecards, but I never use those without checking the place data, as I say).
Going for me is only important when it’s heavy or good to firm (jumps, firm on the flat). Extremes isolate the proven types, and I have a ‘rule of two’: once may be a fluke, twice almost certainly was not.
On the matter of draw, I think one needs to find the right balance between enough data in the sample, and the data being relevant to today’s race conditions. For example, looking at seven runner races is not useful when considering a 16 runner race. Looking at all data is not terribly useful when considering a soft ground flat race (the draw bias can change almost 100% from firm to soft at some tracks). We have dropdowns on our draw tab, but more than that we have ‘guide lines’ which show ‘all going’, ‘all field sizes’, and ‘all races’, so you can see how the ‘micro’ dataset relevant to today’s going and field size maps against the bigger (but less specific/relevant) datasets. I’ve included an example from Southwell today, where you can see that the overall draw data (fainter lines) would mislead you when compared against the specifics for today – also note that I again tend to use place data as it is more comprehensive.
The fainter lines show that the overall draw data might mislead a bettor. There is very little bias against today's conditions.
I do appreciate it’s a fair bit to take in, and obviously it’s different from RP because there’s a heck of a lot more on our site. But I think you’ll be able to absorb these different elements quickly enough if working on them one by one. Gravitate to Geegeez rather than trying to do it all in one go, that’s my suggestion.
But I will try to occasionally share something like the above.
If you're not currently a Gold subscriber and you've read this far, you must be interested in what you might be missing. Hopefully this has been an appetising little taster. If you've never tried Gold before, you can get access to everything for your first 30 days for just £1.
https://www.geegeez.co.uk/wp-content/uploads/2018/02/Best_Website_Gold.png320830Matt Bisognohttps://www.geegeez.co.uk/wp-content/uploads/2022/10/geegeez_banner_new_170x78.pngMatt Bisogno2018-12-11 09:47:292018-12-11 09:47:29Geegeez Gold Case Study #1
Last week, I invited you to send in your questions. About geegeez.co.uk, about racing, about betting. And you did. In your droves. So today, I've recorded a video to answer them all. It's long - two hours - so underneath the video box is a list of the questions and subject headings, as well as some resources to which I've referred in the recording. I hope you'll find (at least some of) it useful.
Matt
p.s. I've also managed to create a podcast version should you prefer to listen to the audio.
n.b. The number before the questions below is the point in the video at which you'll find that answer.
Your Questions
The number before the questions below is the point in the video at which you'll find that answer.
*Race Types and betting*
1:45 - How do you work out handicaps? - Kevin Clarke
22:55 - My Question is I am not sure what I am looking for in looking for winners. I use first expert to sort out horses that fit the greens this is the dogs. Then I look at pace to see if the selection has the credentials then I go to draw if flat and look at that. Then I pretty much lose the plot what do you look for after this. Thanks love the videos learnt so much From Geegeez. - John A
27:40 - I am a massive Placepot nut , any advice on this type of bet with regards to Gold would be much appreciated. What do you think of Colossus Bets which now offer this bet and any advice on the Cash Out option ? - Simon B
36:15 - I wonder if you could come up with a good query tool to able to lay a short price horse successfully. I do lay, I am down money and I need to turn things around. - Gerry M
- First up I enjoy reading your articles. My question is what feature in geegeez you would use and how would you use it to find small priced lays if that is possible. - Murray S
43:00 - Would you kindly expand on the relative values of Pace in Chase, Hurdles and NH Flat. I'd find that very helpful. Many thanks. - Keith B
46:55 - What do you do to improve your strike rate - James T
49:35 - I would like to see more guidance on how you as an expert would go about picking a selection or 2, maybe a guided bet for a Saturday and big meetings. - Steve S
51:25 - Breeding and sales data snippet there is numbers after the stallion name, like 6,7f. What that figure means? What is your personal opinion about a very big break before start? Like over 200 days. I mean in the betting perspective. Is it better to leave those kind of horses without a bet? Thank you for excellent site! - Jussi A
54:15 - Hi Matt, forgive me if I’m wrong but I didn’t notice the ‘bringing it all together’ section on your last web tutorial thingy. I’ll admit to still struggling with gold as there is so much to look at & whilst i feel like I understand all of the individual components of full form, pace, draw & the reports, I’m still really struggling to know which ones to give the most weight/credence to & which ones to ignore as obviously they’re all pointing at different horses. If you could show how you sit down & attack a race cold or what starting points you use that lead you to a bet then that would help somewhat I think. I feel like you say ‘that horse could be of interest depending on other factors’ for example but then we didn’t really see you carry on that selection process to the end in any of those web shows. I appreciate you may have reservations about doing that as there’s so many different ways of using gold & you don’t want to ‘prescribe’it to us but I feel, if like me, you’re a new member who has previously tried & failed to make gold work for them, it’s incredibly frustrating to know that the relevant information is in there but i just can’t land on it with any confidence! - Iain M
59:07 - So, all in all, I’m probably in the mode of not being able to see the wood for the trees, almost too much information and not knowing how best to use it. I’m also probably guilty of looking for big priced winners rather than just winners and of the old fear of missing a winner so backing it regardless. As a rule, I have always been led by Horses for Courses, Ground specialists and runners back to a winning handicap mark and since joining Geegeez I do like the TJ combo. So, I guess this is a very open ended ‘question’ and probably not one you can easily answer, but given all of the above (and below) can you give me a steer to start making this excellent service pay for me a bit better please? I’m not looking to retire early or win a million, just nice steady returns and a bit of fun along the way. - Lee
*Technology *
1:03:30 - Can you see yourselves developing a geegeez mobile app in the future? Roy N
*Features*
1:05:15 - First time headgear (report, and QT)
1:07:20 - Is it possible to add to the racecard, a going filter, to see if any of the red/green figures are changed, and the form figures can relate to such an update? Instant expert does show most of this but not if the trainer's or jockeys record without having to use full form screen. - Terry S
1:10:30 - why does the contextual breeding data/trainer data etc update so late in the day before the race? Before I used Geegeez I used to pick my horses at around 11am (just after declaration) and then place the bets in the evening. My mornings and evenings are busy so this worked best for me. I understand that you obviously wouldn’t change the way you do things just or me, but is it possible for this data to be uploaded earlier in the day? - Tom F
1:12:20 - would it be possible to add in a horses current Official Rating onto Full Form? Just that when you're looking at its past ratings, you need to minimise the window to look at the race card to see its current OR. - Eddie K
1:12:40 - Hi Guys, can I check the previous high /low prices of horses inplay ..ie if a particular horse has generally shortened in running - Michael M
*Staking / Tipsters*
1:13:30 - I am really disappointed with SOTD , I am a yearly subscriber, it is very difficult to get BOG without being gubbed , however I do like you and your apparent honesty that's why I rejoined, but this service Stat Of The Day, leaves a lot to be desired, as I understand SOTD is found using your stats , so what does it say for using your stats. I hope that this does not come across as a knee jerk reaction , but this has been a long time coming, you asked for comments so here is mine ! - David H
1:18:40 - Do you have a forum/ group chat where you and other members send out their selections for the day? - Joe D
1:19:30 - I follow 3 or 4 racing tipsters, all have long term profitable records. However often they will tip different horses in the same race. What strategy should one adopt? Cover all, (split stake or not?) and therefore reduce overall return. Or if they tip same horse, should i increase stake? I would use separate betting banks, but wonder whether better to focus on just one tipster? - David E
1:21:28 - For many years l believed that doubles, trebles etc., were a mugs game and always stuck to win only successfully until l read somewhere that if you knew what you were doing with your selections they could be lucrative so brought this into my betting and found this so far to be true. What is your opinion on this? - Thomas
1:24:35 - I believe that you once wrote that raising stakes during a losing run was better than raising them during a winning run. Is my memory right. If not, what are your thoughts on staking. - Barry C
1:28:30 - When a new service goes live, why do all the tipsters I follow, have to blitz it, day afterday after day? It's blimmin annoying ,and 9times,out of 10, it turns out to be less than useless. But I'm at the stage now, where I am just deleting, and unsubscribing; so you can guess that I've missed some of the ones that, actually work. Could you just tell me, are they being paid ,for mentioning that service(which they've said they have proofed for infinity years)?? Actually, my own service is amazing: You'll never get any winners, but at least I'm up front, about it!! - Steven S
*Regulation*
1:34:10 - Around the time of Goodwood Matt Chapman suggested that there were several odd SPs. Who determines the SP? Is this something the Bettor's Forum is concerned about. I think most bettors will put up with the occassional horse which wins out of the blue having been well backed. They like the idea of an old fashioned coup landed. The idea that the whole system is skewed against them is a different ball game. - Ben S
1:38:20 - As I consider the going on the day to be very important.Is there a way to get round the lies that most Clerks and the Bha are sending out. All the best and thanks for all the help over the years, - John
1:43:30 - I was told that Sportsbook at Betfair was covering single bets, with a pay out of up to £500.00 without having your account closed, is this really true? If so what about multiples, would they stand a higher amount on these? I am thinking mainly of football bets. By the way who owns Sportsbook or managers it? - Philip P
1:44:30 - Could I ask if you have heard of any bookies who have gubbed or restricted accounts offering reasonable bets on Class 1 or 2 races? - William J
1:46:30 - I have had my account with Skybet restricted although I don't think I have won much from them. Is this common as for the stakes I am using I cannot imagine I am much of a threat. I do only bet a small number of bets per year, maybe 70-80. - Geoff W
*Research*
1:47:15 - I'd like to be pointed in the right direction regarding using the query tool please. I am sure this is a feature I do not use due to not understanding it - Paul E
1:49:05 - Thanks for being so open with your wealth of knowledge … much appreciated . I am a “systems” man and was just wondering what I should be accepting as a minimum figures for my systems if I would want to make it work on a more professional basis = win % / roi % sp / roi % bfair / “ a/e “ and or “chi” ?? (are the last 2 the same ?) - Brian C
1:53:35 - Would it be possible to re-do the QUERY TOOL recording I get the gist of it but your teaching has a lot to be desired. I take you have never taught in a class room as you have no synchronisation what so ever or lesson plan talk about wing and a prayer Or as you put it WINGING IT - Frank R
1:55:15 - I understand A/E and I/V at least in so much as anything over 1 is good. But if A/E is say .81 and I/V is say 1.3 does that indicate a negative stat .....I'm presuming that it does. - Mick S
https://www.geegeez.co.uk/wp-content/uploads/2018/12/Video_QandA.jpg320830Matt Bisognohttps://www.geegeez.co.uk/wp-content/uploads/2022/10/geegeez_banner_new_170x78.pngMatt Bisogno2018-12-05 15:32:232018-12-06 16:41:15Your Questions, My Answers
Part 3 of this video series takes more of a helicopter view of the day's racing, and shows how Gold's report suite can unearth some lovely 'under the radar' wagers.
Before that, if you've not yet checked out the first two videos, I'd recommend watching those first.
https://www.geegeez.co.uk/wp-content/uploads/2022/10/geegeez_banner_new_170x78.png00Matt Bisognohttps://www.geegeez.co.uk/wp-content/uploads/2022/10/geegeez_banner_new_170x78.pngMatt Bisogno2018-10-23 19:24:492019-06-26 13:33:47Geegeez Gold Video #3: Finding In’s from the Reports
Last night, I broadcast the second in a series of four web TV shows. The quartet aims to help geegeez.co.uk readers - now viewers - get to grips with the power housed inside Geegeez Gold. And, also, to improve as punters in a more general sense.
The first one, recorded last Sunday evening, was on the general approach to betting and can be watched here.
Last night's show is viewable directly in this page from the link below. In it, I cover:
- Racecard icons and customization
- When to use the breeding/sales icon
- What to look for with the trainer icon
- How H2H can help understand the 'hierarchy of the herd'
- How to slice and dice trainer, jockey and sire performance history
- Proximity form as an alternative to finishing position
- Setting up Instant Expert, and the limited data red box trap
- Pace, especially setups to be aware of
- Draw on the all weather, and those advantaged and disadvantaged
- and a fair bit more besides
It's bang on 90 minutes long, and you don't need to watch it all in one sitting; but I recommend you watch it. I think it will improve your understanding of our awesome Gold toolkit. Click the video below and take notes!
Matt
p.s. you can use the full screen 'square' icon bottom right on the recording to increase the size of the video box.
https://www.geegeez.co.uk/wp-content/uploads/2018/10/webtv2.jpg320830Matt Bisognohttps://www.geegeez.co.uk/wp-content/uploads/2022/10/geegeez_banner_new_170x78.pngMatt Bisogno2018-10-15 07:37:512018-10-15 07:39:15[REPLAY] The Racecards & Form Tools Web TV Show
In the first video in this series, I talked a little about getting the right mindset and understanding 'the art of the possible'. These basics cannot be over-stated, and should not be overlooked. So, if you've yet to watch that video I'd recommend you do so now. Here's the link.
Now, to today's video, which is all about racecards and form tools, and getting the most out of them. Here at geegeez.co.uk, our cards and tools have a few more features than others you might be used to; they're all designed to give users more information in less time, and to help you make better, more profitable, betting decisions.
Have a look and see what you think...
https://www.geegeez.co.uk/wp-content/uploads/2022/10/geegeez_banner_new_170x78.png00Matt Bisognohttps://www.geegeez.co.uk/wp-content/uploads/2022/10/geegeez_banner_new_170x78.pngMatt Bisogno2018-10-14 19:59:382019-06-26 10:30:27Geegeez Gold Video #2: Racecards and Form Tools
The Laughing Gnome or Richard Johnson after nine cups of coffee..?
Last night I presented a live broadcast via the wwww. (wonderful world wide web).
It was about 'getting started'.
Actually it was about a lot more than that, and doubtless has some value regardless of where you're at with your betting and/or whether you're a geegeez subscriber or not.
It runs for 90 minutes but you can watch the whole thing in 45 minutes to an hour...
You see, I'm not used to doing this sort of thing, and one observation I have of myself is that my delivery was probably marginally slower than ideal.
Happily, youtube has this covered with a 'speed' control bottom right [click the little cog wheel to access the control].
Here, you can choose to watch me at 1.5x (where I sound like Richard Johnson on a caffeine high) or even 2x (where I invoke the spirit of David Bowie's Laughing Gnome)... or good ol' normal speed, where I sound like me, only a bit more nasal (seasonal snots, sigh).
The show covers:
- "The Art of the Possible"
- Mindset
- Staking
- Time
- Overwhelm
- "The process"
- and an overview of the Geegeez Gold platform
And you can watch it below.
p.s. this is your LAST CHANCE to get the discounted Winter Gold season ticket, OR annual discount, OR trial month then current monthly price. From Wednesday morning, the offer is closed and the monthly cost rises for anyone not already locked in to existing pricing structure.
https://www.geegeez.co.uk/wp-content/uploads/2018/10/mattlaughinggnome-e1538995881695.png307830Matt Bisognohttps://www.geegeez.co.uk/wp-content/uploads/2022/10/geegeez_banner_new_170x78.pngMatt Bisogno2018-10-08 10:51:322018-10-08 10:51:32[REPLAY] The ‘Getting Started’ Web TV Show
In this first video, I want to talk about the building blocks of success as a bettor on horse racing. It starts more fundamentally than which horse should I back or in which race should I bet, as you'll discover...
https://www.geegeez.co.uk/wp-content/uploads/2022/10/geegeez_banner_new_170x78.png00Matt Bisognohttps://www.geegeez.co.uk/wp-content/uploads/2022/10/geegeez_banner_new_170x78.pngMatt Bisogno2018-10-07 19:38:582019-08-23 14:35:20Betting Mastery Video #1: Setting Yourself Up to Succeed
On 5th July the first of more than two hundred nurseries - 2yo handicaps - programmed for 2018 was staged, at Haydock Park. They are a feature of the second half of the calendar year and, due to the unexposed nature of many of the runners, have often been considered off limits to large swathes of punters.
But nursery handicaps are just like any other group of races: they have distinct characteristics which require a primary focus in certain key areas. Happily, there are plenty of data on which to chew and from which to attempt to draw meaningful inferences.
In this post, I'm going to focus on nurseries since 2014 - four years' worth - and in the UK only. I'll exclude the five races already run in 2018 at time of writing, so we have complete years from 2014 to 2017.
During that time 8618 runners contested 972 races, none of which culminated in a dead heat. There are therefore 972 winners in the sample. Average field size can quickly be calculated as 8.67, meaning plenty of opportunities for each way punters (609 of the 972 races had eight or more runners). Let us try to determine some characteristics which separate the winners from much of the rest of their fields. To do that we'll start with an old adage I heard in my formative punting years, but first some context...
"Back the top weight in 2yo handicaps"
I don't know who first coined this, or why. It is predicated on good sense inasmuch as horses tend to win handicap races in descending order of weight rank. That is, the highest weighted horse wins most often, the second highest weighted horse wins next most often, and so on. But nothing so straightforward was ever missed by the market, meaning backing top weights in handicaps will send you skint quicker than an afternoon playing find the lady on a grubby street corner.
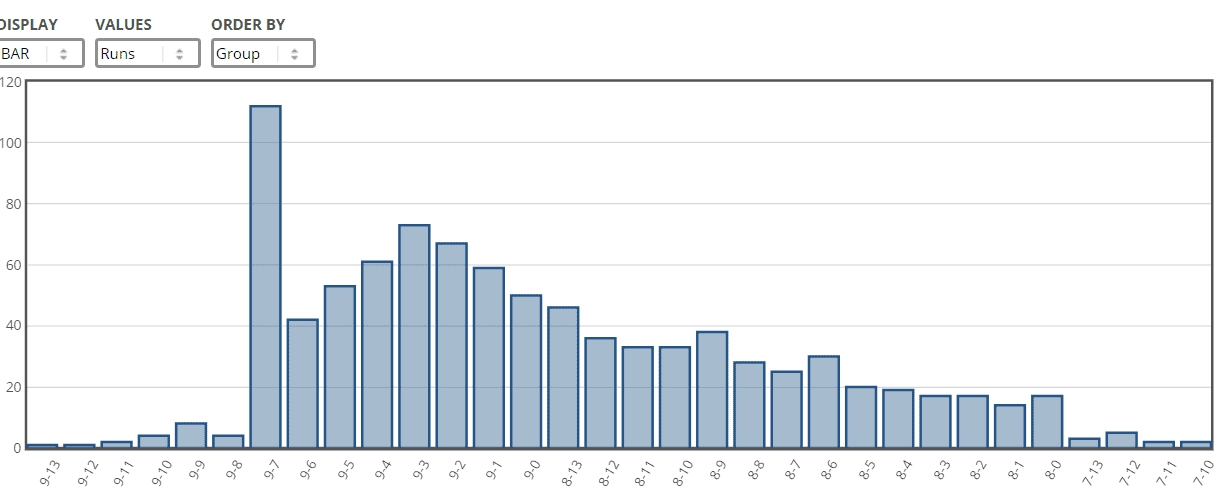
Ignoring those races - amateur riders and the like - where horses are asked to carry in excess of ten stone (the pattern is the same), the below shows the effect of weight carried on win percent in all flat handicaps in UK between 2014 and 2017.
Win strike rate in UK flat handicaps, 2014 to 2017, by weight carried
That is what one might call a pretty robust correlation. More weight equals a greater chance of winning. But here's how that chart looks when expressed as return on investment at starting price...
Return on investment at SP in UK flat handicaps 2014-17, by weight carried
What this basically tells us is that, ignoring the most lightly weighted horses, there is a vague consistency in losses down to around 8-04 (eight stone four pounds). In other words, although more weight equates to more winners, from a betting perspective it amounts to similar losses almost regardless of the equine's impost.
[In the image above, I hovered over a data point merely to illustrate that further intel can be gleaned from these charts; there is no specific relevance of highlighting the 9-13 group of horses].
The above preamble is intended as context for what follows, namely a similar perspective on nursery handicaps. This is how the diffusion of weight affects a horse's chance of winning in such races:
UK nursery handicaps, 2014-17, performance by weight carried [max 9-07]
In the image this time, I've included one of the variables on the left hand side, so you can see I've truncated the weight range at 9-07. This is because there are a handful of runners which carried more than that, some of which won at 100% (i.e. one from one), thus skewing the line.
We can see the trend generally follows the 'all age' flat handicaps superset. Below is the impact of weight on ROI in nursery handicaps, and as can be seen it offers a far less clear picture:
ROI by weight in UK nursery handicaps, 2014-17
Not only do lower weighted horses win less often, they also lose more cash. Meanwhile, at the top end of the weight spectrum, we have a couple of spikes either side of nine stone that creep comfortably north of break even. Of course, in the general sense it's not especially helpful because there's no reason why horses carrying 9-01 should be more profitable than those carrying 9-00: it's just a quirk of the data.
But there is something of an ROI cliff at around the eight stone mark, and horses carrying less weight than that in nurseries can generally be treated with contempt. The reality is that many of them are simply not good enough to ever win such a race, perhaps any race.
Getting back to our "back top weights in nursery handicaps" starting point, the next chart shows win strike rate and return on investment (SP) by weight rank:
Win percent and ROI by weight rank, UK nursery handicaps, 2014-17
Ignoring the obvious outlier (rank #19) with its big priced winner, the blue bars show how win strike rate diminishes as we drop down the weights; and the orange bars show how one would have lost less by sticking to the higher weighted runners.
As interesting as this may (or may not) be, it is academic for those of us looking to butter our bread. As with absolute weight, so weight rank confirms that one will lose money more slowly rather than win money following higher rated, and therefore weighted, horses.
The value of experience in nursery performance
All juveniles intending to run in nursery handicaps must have either won their first two races or run at least three times. In both cases, the lack of racecourse evidence and/or experience can lead to horses improving significantly as they strengthen up and get the hang of things. And, yes, as they are presented with a test for which they might have been bred.
We can examine the bearing this has on nursery handicaps by looking at performance by number of career runs. Here, received wisdom says that a horse's best chance of winning may be when stepping into handicap company for the first time. But the data do not bear that out:
Nursery handicap debutants (0) win at a rate of 10.77%, whereas those having their fourth nursery start or more win 13.1% of the time. Those with intermediate levels of experience win incrementally more. There is then a correlation between amount of handicap experience and an increased win chance. But what of profitability?
Here, an interesting picture begins to emerge, although still somewhat ambiguous. Looking at exchange prices, we can see that not only are those with more nursery experience more likely to win but, unlike those carrying bigger weights, they are also profitable to follow (at exchange prices).
Greater experience in nursery handicaps should be considered a plus for a horse.
The virtue of ratings
Although there are occasional blind spots in the public consciousness such as, arguably, the benefit of experience in nurseries, a better way to get an edge is to create or derive some information not available to the masses. That could be a system, methodology or a set of ratings.
Geegeez Gold publishes Peter May's 'SR' ratings under license and they reveal some interesting things in the context of nursery handicaps. This next chart shows nursery win rate by SR rating rank:
Win strike rate by SR rank, UK nursery handicaps 2014-17
The top rated horse in nursery handicaps in the four year study period won 18.44% of the time for an SP profit of - drumroll please - 0.95 points! While nobody ever went skint taking a profit, an ROI of 0.1% is more for your institutional investors than us profit-minded adrenaline junkies.
But it is a pretty good starting point to look at thing like race distance, weight, going, field size, market rank and class. One needs to be a little careful not to fit the story around the data, but it might be reasonable to assume that shorter distances - and therefore more consistently truly run races - would fare better from a rating perspective (when that rating has both a speed and form element within it). Likewise, perhaps bigger fields should yield better results for the same reason. And, based on earlier conclusions, those carrying more weight may be expected to at least win more often if not show a profit. Finally, perhaps ratings will manifest themselves as a marketable differentiator of class.
SR and Race Distance
Starting with race distance, we get some credence to the 'shorter distances are better' perception, as follows:
Top-rated SR, by race distance, UK nursery handicaps, 2014-2017
The pure sprinters at five furlongs have won almost one in four when top-rated, and have been profitable to back blindly to boot. Indeed, taking all sprint race distances - which I generally classify as seven furlongs or shorter - we see a pleasing hit rate, supported by a solid place strike rate, and a solid ROI:
Runs
Wins
Places
Win %
EW %
Win PL
EW PL
ROI
A/E
IV
708
137
288
19.4
40.7
69.66
1.64
9.84
1.02
1.73
SR and Weight Carried
Next we can see the distribution of top rated nursery runners by weight carried. Top weight in such races is generally allocated 9-07, and it is interesting (though not altogether surprising) to note the strong coincidence of top weight - which equates to top official rating - and top SR rating.
Distribution of top-rated SR nursery runners, by weight, UK 2014-2017
But what of profitability? Here, an interesting anomaly emerges:
Impact of weight carried on top-rated SR horses, UK nursery handicaps 2014-2017
Those 9-07 horses, with their confluence of top public and private ratings, are notably unprofitable to follow. My assumption for this relates to the public element - that is, officially top-rated - and to the aforementioned 'back top weights in nursery handicaps' mantra espoused by so many for so long.
What is more interesting is that immediately below the top rated/top weighted, there is a full stone range in the weights where backing top SR runners yields both a high strike rate and an SP profit. Nevertheless, I'm not entirely comfortable with discounting the top weights: the pursuit of sustainable profit is rooted in sensible logical analysis. Conveniently discounting strands that don't fit is a surefire way to secure disappointing outcomes thereafter!
SR and Going
I struggled with this one a fair bit when I saw the output. Why? Because there is a correlation in the data that looks plausible. But I just cannot find a way to explain it. Here's what I mean:
Top SR in UK nurseries, 2014 to 2017, by going
The firm ground category consists of six runners, of which none won (as you can see from the above), but five were placed! Good to firm and good ground have produced slightly lower win strike rates than slower surfaces but the place strike rates are broadly comparable, leading to my discomfort in 'conveniently' excluding faster turf.
Lawns on the soft side of good or slower, and all weather surfaces, have been highly profitable. I will leave it to the reader to attempt to justify quick turf runner excommunication...
SR and field size
What of field size? My hypothesis is that bigger fields, and therefore more reliably run races, should yield better results, in terms of profit if not strike rate (there obviously being more horses to beat in the latter case). The data don't really support the hypothesis, however:
Runners
Runs
Wins
Places
Win %
EW %
Win PL
EW PL
ROI
A/E
IV
2-5
114
39
59
34.21
51.75
5.98
-4.84
5.25
1.15
1.53
6-8
326
68
142
20.86
43.56
6.87
-29.74
2.11
1.06
1.47
9-12
364
51
135
14.01
37.09
-6.90
-56.51
-1.90
0.84
1.44
13+
118
12
33
10.17
27.97
-5.00
-10.37
-4.24
0.84
1.46
We would of course expect strike rate to diminish as the number of runners increases; but the theory of more truly run races leading to better results for top SR horses holds little water, notwithstanding that all runner groups are within fine margins of break even one side or the other. In short, there's little of positive or negative utility in field size.
SR and class
My premise with regards to class is that the ratings may fare better in better class races; the rationale is that in such races, where many unexposed recent winners or good grade placers lock horns, the winner may be underestimated by the market but not by a private handicap (which is, in essence, what any set of 'unofficial' ratings are).
This time the theory does seem to stand a test.
Class
Runs
Wins
Places
Win %
EW %
Win PL
EW PL
ROI
A/E
IV
2
91
16
37
17.58
40.66
28.08
36.91
30.86
1.25
1.73
3
77
19
32
24.68
41.56
11.17
-3.20
14.51
1.18
1.77
4
195
42
83
21.54
42.56
3.28
-23.84
1.68
1.02
1.53
5
291
52
113
17.87
38.83
-40.20
-78.02
-13.81
0.96
1.57
6
268
41
104
15.3
38.81
-1.38
-33.31
-0.51
0.84
1.63
Without wanting to get too unequivocal, there are some strong looking patterns. Actual versus Expected, a measure of the value proposition (more info here), slides in a linear manner from best class to worst, with Class 2 to 4 offering degrees of positive expectation.
In profit terms, all bar Class 5 have made a surplus at exchange odds, and even the 40 point-losing at SP Class 5 fares close to even at exchange prices. A focus on better races looks a beneficial means of deploying the Peter May SR figures in nurseries.
SR and the market
There are so many ways to slice and dice the dataset, and one more is to overlay market information: odds and / or odds rank.
Odds
Runs
Wins
Places
Win %
EW %
Win PL
EW PL
ROI
A/E
IV
Odds on
20
14
16
70
80
3.79
2.50
18.95
1.18
3.78
Evs to 2/1
100
39
62
39
62
-1.41
-16.39
-1.41
1
2.78
85/40 to 7/2
200
59
109
29.5
54.5
32.07
13.87
16.04
1.15
2.37
4/1 to 6/1
237
32
88
13.5
37.13
-48.50
-100.73
-20.46
0.8
1.25
13/2 to 10/1
213
15
61
7.04
28.64
-77.00
-118.82
-36.15
0.64
0.66
11/1 to 18/1
112
9
27
8.04
24.11
20.00
16.00
17.86
1.16
0.8
20/1 +
62
4
11
6.45
17.74
65.00
85.25
104.84
1.7
0.73
This is quite interesting, there appear to be three distinct areas: a profitable and high strike rate top of the market; an under-performing mid-market, in both profit and strike rate terms; and a surprisingly robust 'long tail' for those who can suffer losing runs in the pursuit of big winners.
The thirteen winners priced at 11/1 or bigger SP paid an additional 109.94 points at Betfair SP. Even taking out the 50/1 scorer (95 BSP), Celestine Abbey, still leaves 64.94 extra units of profit at BSP. But anyway, if you're backing the rags, why would you exclude the best of them?!
Conclusions / Pulling it all together
From the beginning of July to the end of the calendar year, there is a nursery handicap - or two, or three - almost every day. Knowing how to play the odds specifically for such races is an edge most punters don't bother to look for; and it is one where a few rules of thumb may help separate out a lot of the losing chaff.
The first relates to weight: those horses carrying eight stone or less won less than 5% of the time, and lost a massive 57% of stakes at SP across 356 runners. The story is broadly similar longer term: since 2009, 58 from 1142 were able to win (5.08%) for an ROI of -43.46%. Ouch.
Treat nursery runners carrying eight stone or less with grave suspicion.
In terms of experience, more is definitely better, both in terms of winning chance and profitability. In the four year sample period, it was shown that horses won more often with each additional run in nursery handicaps and, moreover, that with at least two prior nursery starts were profitable to back at exchange prices.
Favour experienced handicappers in nurseries.
So far so generic. But still, using nothing more than a daily paper, you ought to be able to find qualifiers for a system - more than eight stone, more than three prior nursery runs - that has made a profit of 27.46 points at starting price and an enormous 251.9 points at Betfair SP in the four year review period.
How can Geegeez Gold's ratings assist?
We've seen earlier in this article how our SR figures are most effective in shorter races, specifically at up to seven furlongs. Back top rated SR horses carrying more than eight stone at distances of seven furlongs or shorter has yielded 136 winners from 689 runners (19.74%) and a profit at SP of 71.66 points. I don't have the exchange data yet, sadly, but this group includes the two biggest priced winners from the 11/1+ analysis above, those two being worth an additional 51.31 points at Betfair SP. So let's be conservative and call it 150 points profit on 689 bets (21.77% ROI).
I couldn't justify logically leaving those 9-07 top weights out, but if you can, you might be able to replicate the better historical rate of 114 from 585 for 102.67 points at SP. <<< Caveat emptor: you need to be comfortable that there's a legitimate reason to exclude the top weights.
Focus on top-rated SR horses at distances up to and including seven furlongs.
Going was likewise difficult to assimilate: the data say strongly that top-rated SR's perform best on softer than good or all weather surfaces, but there is no obvious reason why faster surfaces should yield lower strike rates and poorer ROI's. Of course, the fact that we geegeez.co.uk licenses the ratings means they are 'black box' to us and, therefore, that we/I cannot discount that there is something in the algorithm to support what those data say. I'm still struggling though...
It may pay to focus on softer turf and all weather...
Those are three solid guiding principles which are worth committing to memory/the notebook:
1. Treat nursery runners carrying eight stone or less with grave suspicion.
2. Favour experienced handicappers in nurseries.
3. Focus on top-rated SR horses at distances up to and including seven furlongs.
For fun, and as something to add to my QT Angles watch list (facility coming soon, I promise!), I'm going to add the following which may make more experienced punters cringe even though I hope I've sufficiently explained/excused/caveated/apologised for each element in what preceded:
- More than eight stone and less than 9-07 (top weight generally)
- Top-rated on SR
- Seven furlongs or shorter
- Softer than good, or all weather
It looks very good, but it may be that the veneer hides something less credible. Please handle with care...
Year
Runs
Wins
Places
Win %
EW %
Win PL
EW PL
ROI
A/E
IV
2014
86
16
35
18.6
40.7
86.70
96.92
100.81
1.04
1.66
2015
107
26
45
24.3
42.06
6.55
-2.16
6.12
1.26
2.17
2016
86
16
34
18.6
39.53
25.16
15.42
29.26
1
1.75
2017
114
30
53
26.32
46.49
40.09
36.41
35.17
1.42
2.33
ALL
393
88
167
22.39
42.5
158.5
146.59
40.33
1.2
2.02
I will personally also manually check for levels of experience when such runners crop up, as we don't currently have such variables in our Query Tool.
**
Nursery handicaps are a significant part of the flat programme book in the second part of the season, and I hope that the above has offered a few morsels worthy of consideration when playing such races.
Good luck!
Matt
p.s. this post was put together primarily with the aid of Geegeez Gold's Query Tool, which enables users to ask questions of our database and to display the answers to those questions in numerous table or chart output formats. Gold subscribers can try Query Tool here.
geegeez.co.uk uses cookies to improve your experience. We assume that's OK, but you may opt-out from the settings. Cookie settingsACCEPT
Privacy & Cookies Policy
Privacy Overview
This website uses cookies to improve your experience while you navigate through the website. Out of these cookies, the cookies that are categorized as necessary are stored on your browser as they are essential for the working of basic functionalities of the website. We also use third-party cookies that help us analyze and understand how you use this website. These cookies will be stored in your browser only with your consent. You also have the option to opt-out of these cookies. But opting out of some of these cookies may have an effect on your browsing experience.
Necessary cookies are absolutely essential for the website to function properly. This category only includes cookies that ensures basic functionalities and security features of the website. These cookies do not store any personal information.
Any cookies that may not be particularly necessary for the website to function and is used specifically to collect user personal data via analytics, ads, other embedded contents are termed as non-necessary cookies. It is mandatory to procure user consent prior to running these cookies on your website.