Changes in UK Flat Racing: 2010-2025
Changes in UK flat racing over the past 15 years
This article is slightly different from what you might be used to from me, and I will be reviewing the changing face of flat racing in the UK, writes Dave Renham.
Comparing different sets spanning the period from 2010 to 2025 I will consider how the racing programme has changed, what has been happening to field sizes, whether there have been any significant changes in the jockey community, and so on. My analysis covers all flat racing in the UK, turf and all-weather.
Scheduled meetings
We are less than two weeks from the start of the 2026 turf season, so I would like to start by comparing the number of flat meetings that were scheduled in 2010 with 2025.
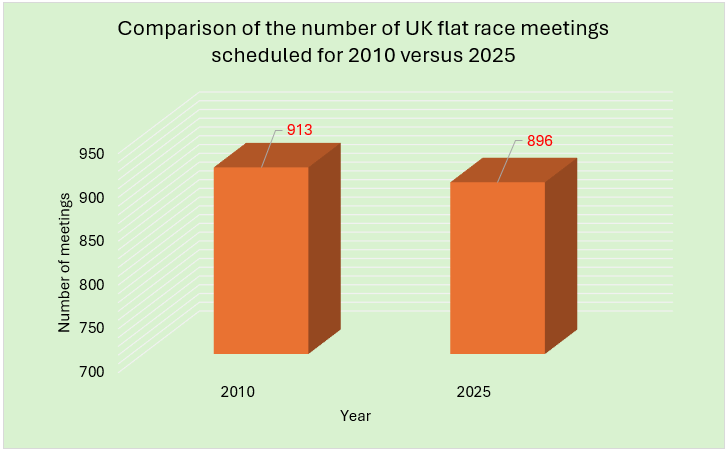
There is only a small difference of 17 meetings, which equates to roughly one every three weeks.
Composition of Turf vs AW Race Meetings
What has changed is the split in terms of turf flat meetings versus all weather meetings. Firstly, let me share the division for between the surfaces in terms of the number of meetings across each of these two years:
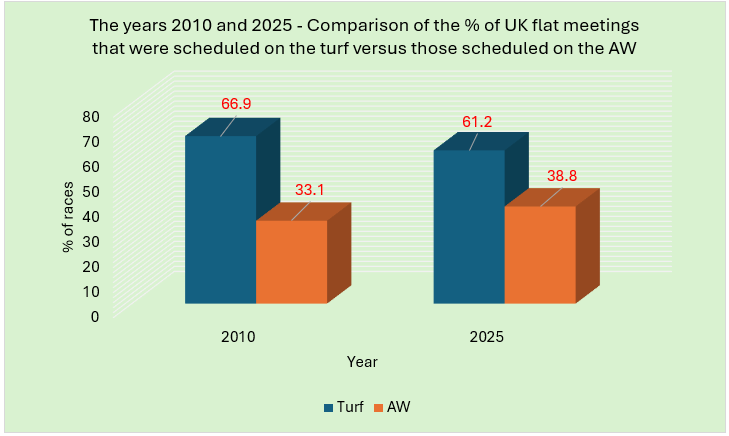
Over these 15 years there has been a 5.7% decrease in the number of turf fixtures and, therefore, a 5.7% increase in AW meetings. While I do not have the schedules for all years in between, I do have yearly data in terms of the number of turf flat races and the number of AW races run.
Below is a graph showing the percentage of turf flat races each year compared with the percentage of AW ones. I have not included the splits for 2020 due to the disruption caused by Covid, hence the lack of a blue and orange dot above 2020 on the graph.
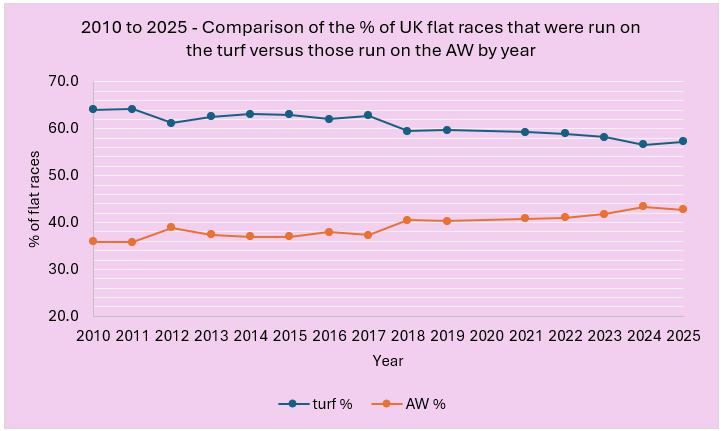
As expected, given the ‘number of meetings’ evidence, the general trend has been for the gap between the two to narrow. In 2010 turf accounted for 64.1% of all flat races with 35.9% on the AW. By 2025 this read 57.3% turf and 42.7% AW.
Average field size
A look now to see what has happened to field sizes over the past 15 years, comparing the 2010 average with the 2025 one.
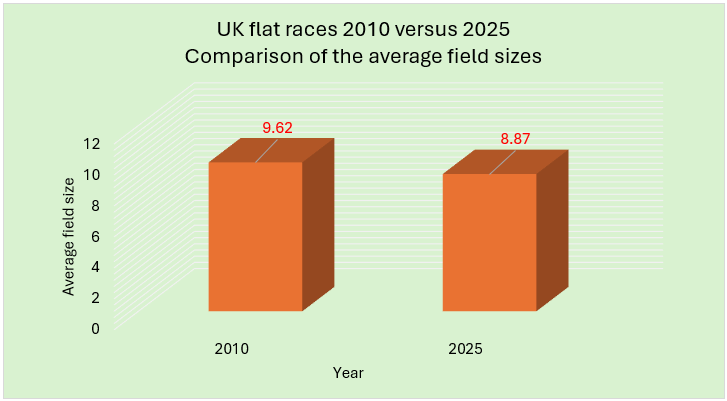
The average number of runners per race has dropped by exactly three-quarters of a runner over the past 15 years. Another noptable change can be detected when we compare turf field sizes with AW ones:
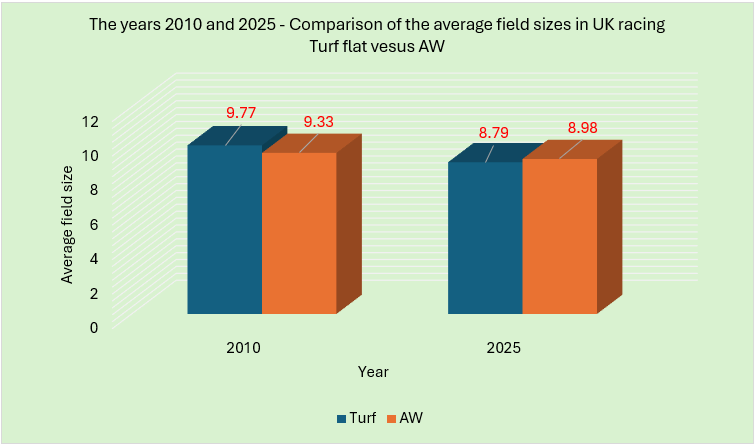
As the graph shows, there has been a much bigger drop in the average field size in turf flat races (roughly one runner per race on average). The AW figure has dropped a little, and in 2025 we had bigger fields on average on the AW compared with those running on turf.
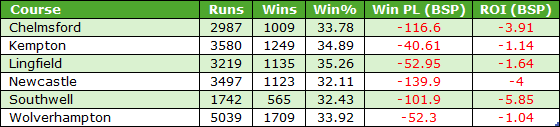
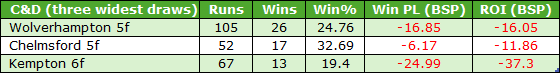
Average field size by course
I now want to look at what happened at each course in terms of field size when comparing 2010 with 2025. In the table below the averages for each individual track are shown along with a column calculating the percentage difference between the two. Any percentage figure in green indicates an increase in the average number of runners, whereas percentage figures in red indicate a decrease. For the record Chelmsford and Wetherby are not included as they did not race on the flat at either venue in 2010.
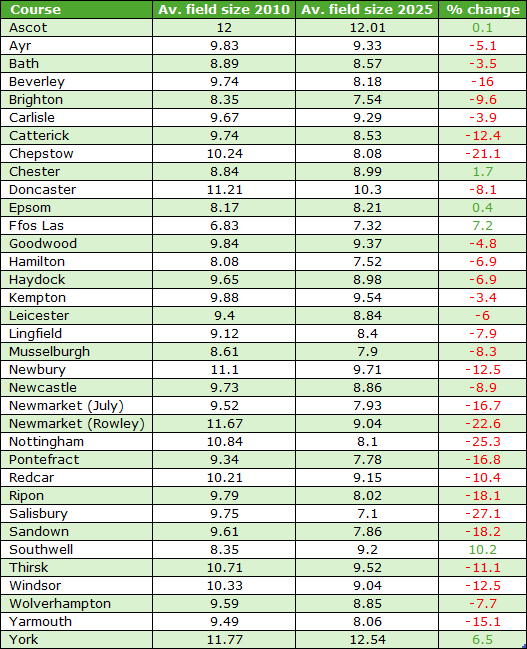
Only six courses have seen an increase in their average field sizes, which will come as no surprise based on the previous data shared. The average field size at Southwell has increased by 10% which is the most by any of the courses. I wonder if that might have something to do with the change of surface. Impossible to say for sure, but that feels to be the most likely reason. Conversely, there have been some significant drops, most notably at Salisbury, Nottingham, the Rowley course at Newmarket and Chepstow. All four have seen field size decreases of more than 20%.
It should be noted that average field size decline may have been affected slightly by courses which decide to split more handicap races into two divisions than was the case previously. I don’t have any hard data here, so it is more an observation of a potential mitigating factor.
Field size and each way betting
One impact of smaller field sizes is reduced opportunities for savvy each way bettors. In 2025, 33% of all flat races had seven or few runners: a third of all races.
If you have not yet read Russell Clarke’s excellent article where he discusses whether win bets or each way bets are optimum in terms of the number of runners in a race, I suggest you take a quick look before reading on. The link is here: www.geegeez.co.uk/money-without-work-5-bookmaker-concessions-each-way-betting/
Essentially, in 5, 6 and 7-runner handicaps, and in 6 and 7-runner non-handicaps, the percentages favour win betting over each way betting. It is only 5-runner non-handicaps where each way punters have an edge over win punters.
A mere 2.7% of all races in 2025 were 5-runner non-handicaps. In contrast, 5, 6 and 7-runner handicaps coupled with 6 and 7-runner non-handicaps accounted for 26% of all races in 2025 which is a huge number of races where each way bettors were at a disadvantage. To give further context, as well as to show reduced opportunities for each way bettors, in 2010 these races equated to 21% of all races.
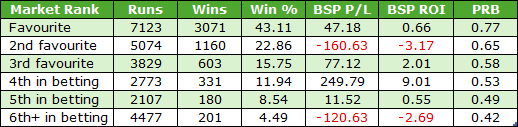
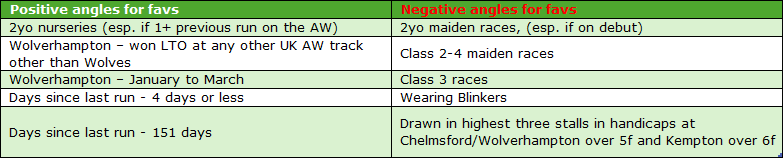
Another impact of smaller field sizes is an increase in shorter priced favourites. This, for many - me included, presents a much less appealing product.
And a further impact of smaller field sizes is more limited opportunities for jockeys, which brings me on to...
Women jockeys
Horse racing is a rare sport in that women compete against men on a completely level playing field. However, for many years the sport has been dominated by male jockeys and despite some excellent lady riders coming along – Hayley Turner, Hollie Doyle and Saffie Osborne to name but three - has anything really changed? Let’s see.
Firstly, below are the annual percentage of rides for male jockeys versus females.
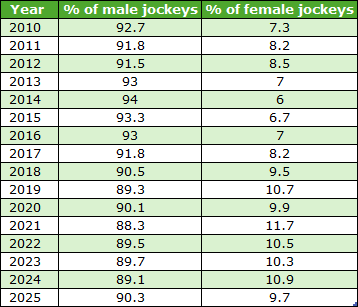
In general, there has been a slight uptick in the percentage of female rides over the timeframe, but it is disappointing to see the figure drop back under 10% in 2025. Moreover, if we look at the better races, just 2.6% of riders in Class 1 events in 2025 were female. Indeed, only four female jockeys from 2010 to 2025 had 50 or more rides in these contests: Hollie Doyle, Saffie Osborne, Hayley Turner and Josephine Gordon.
Combining their performances in Class 1 events during this period, they recorded a profit at BSP of £104.31 to £1 level stakes which equates to returns of over 13p in the £. Not only that, if we had backed all of their mounts on the Betfair Place Market a profit of £21.13 would have been secured. Clearly, female jockeys continue to be something of a blind spot in both owner/trainer and bettor sectors.
I have more bad news for fans of female riders because 173 different female jockeys rode at some point during the year of 2010, but in 2025 this had dropped to 134. On a personal note, I find this whole situation sad, disappointing and wrong. As a whole, female sport in the UK is booming thanks in part to the success of the England Lionesses, the World Cup winning England rugby team and the exposure of ladies’ cricket at international level and in ‘the Hundred’. However, this is not being reflected in horse racing, and something needs to change soon.
Apprentice jockeys
How about apprentice jockeys? Are there more or fewer apprentices riding now as compared to 2010? The answer is emphatic: there were far fewer apprentice jockeys riding in 2025 compared to 2010. Specifically, there were just 244 last year compared to 377 in 2010.
This is also reflected when we see the total number of rides apprentices had – there were 9941 in 2025 compared with 13948 in 2010. If we look year on year comparing open races - that is, races for both professionals and apprentices - we can see that the percentage split for apprentices has generally been on a downward trajectory.
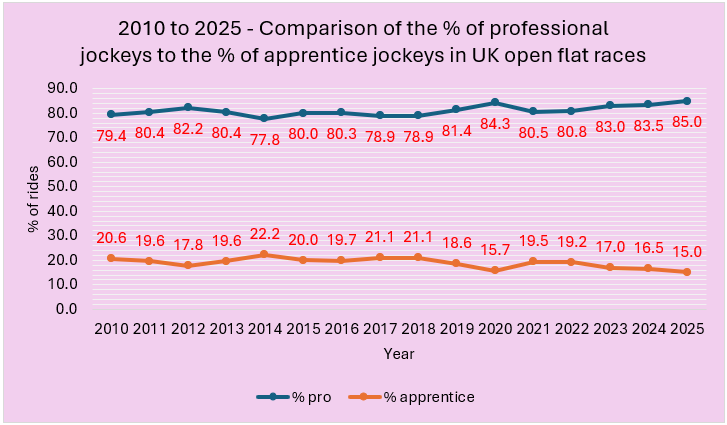
2025 saw the biggest difference between the percentage of professionals riding in open races and the percentage of apprentice riders riding of any year going back to 2010 – 85% against 15%. With apprentice jockeys being the future of the sport this trend is a little worrying.
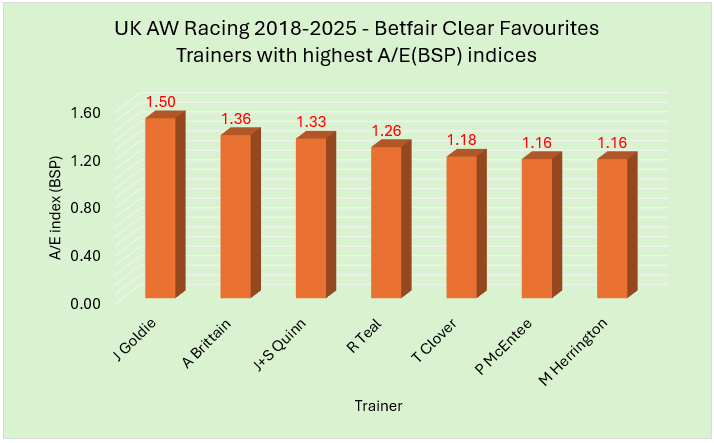
I would like to say that from a punting perspective some apprentice jockey data have been extremely positive in recent years. For example, the most successful apprentices, those claiming 3lb in open races, have performed extremely well in the last few years when riding shorter priced horses.
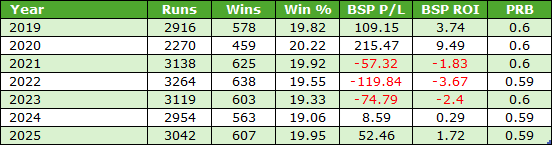
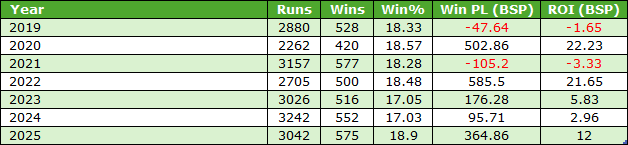
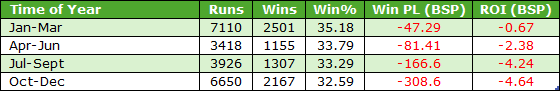
From 2018 to 2025 when riding horses priced BSP 4.0 or less, these 3lb claimers in open races have produced the following figures:
![]()
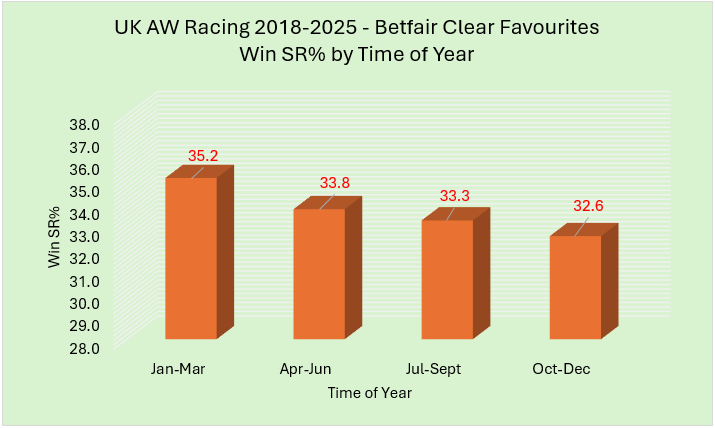
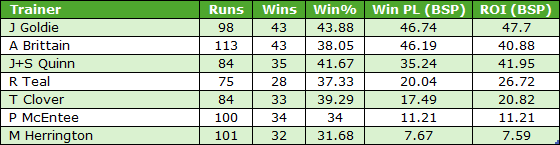
A tidy profit with returns of over 6 pence in the £. Not only that, but the yearly stats also show how consistent these performances have been:
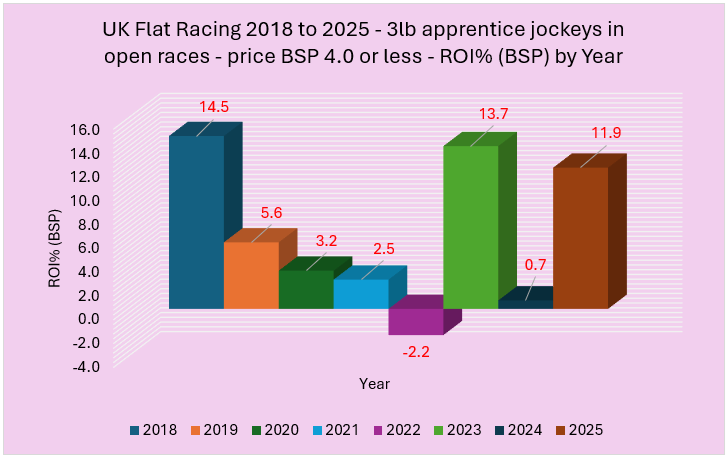
There have been seven winning years out of eight with only a small reverse of 2.2p in the £ in the one losing year of 2022.
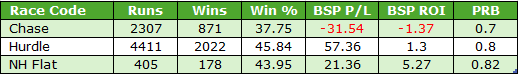
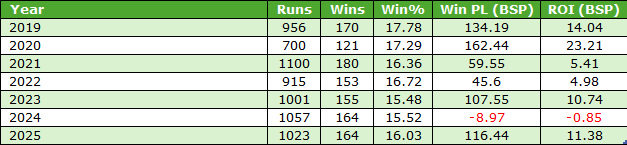
Another positive apprentice angle is when apprentices claiming the full 7lb allowance ride over the minimum distance (5f) in turf handicaps. They have made a decent blind profit across all price bands (around 18p in the £), but two big-priced winners have skewed the bottom line somewhat.
However, when restricting qualifiers in these handicap sprints to horses priced BSP 12.0 or less the record reads 131 wins from 678 rides (SR 19.3%) for a profit of £70.44 (ROI +10.4%). Despite their inexperience, it seems that over the shortest distance, when I guess fewer mistakes can be made due to the time the races take, apprentices claiming 7lb have offerred good value.
Changes in Race Type Topology
There have been some significant changes since 2010 in the flat racing schedule when it comes to race types. For example, in the UK in 2010 there were 277 claiming races on the flat. By 2018 this had dramatically reduced to 81, and in 2025 there were just six!
Sellers have suffered a similar fate although there were still 30 such races in 2025, compared with 237 in 2010. I know for punters as a whole these two race types can be a bit ‘marmite’ but personally I have always liked claimers and sellers as betting mediums.
Another seismic switch has been that of maidens (non-handicap) versus novice races. In 2010 there were 1326 non-handicap maiden races and 45 novice races. By 2025 there were more novice races than maidens – 765 against 630.
Finally, while looking at race types, we can see that there are more handicaps and fewer non-handicaps now than there were in 2010:
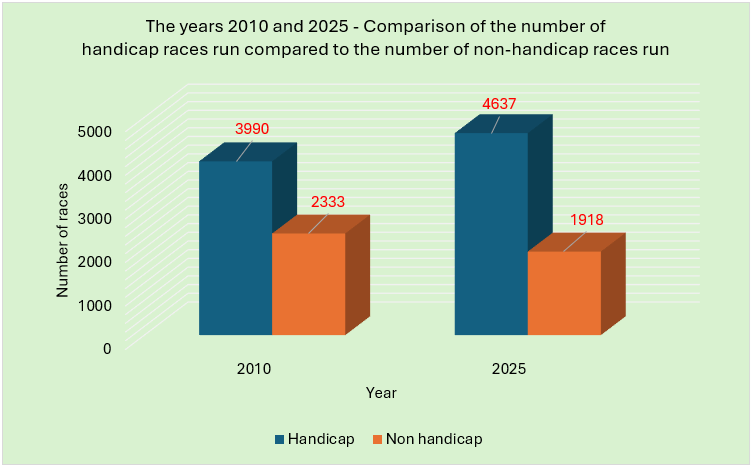
In percentage terms, handicap races have increased from 63.1% of all flat races in 2010 to 70.75% of flat races in 2025, a relative increase of 12% in the last 15 years. As a rule, I personally prefer handicaps, so for me this is a ‘win’, but I appreciate there will be punters with other points of view and for some this would not have been a good development over time.
Headgear / tongue ties
When talking headgear I am excluding tongue ties, so blinkers, cheekpieces, hoods, eye-shields and visors. There has been a 47% increase in the number of horses wearing headgear in races between 2010 and 2025.
Just under 18,000 runners in 2025 ran in headgear; that is 18,000 runners in total rather than 18,000 individual horses, as most horses wearing headgear will have had the equipment deployed more than once across the year. This equates to 31% of all runners. For the record, horses that wore headgear were poorer value than those which did not. The difference from 2010 to 2025 was around 3.5p in the £ in favour of horses that did not wear headgear.
Regarding tongue ties, the numbers of runners wearing them have more than doubled since the 2010 flat season: 2,927 runners wore a tongue tie in 2010, and it was up to 6,090 in 2025. Horses wearing tongue ties have some very interesting stats which I wrote about recently so check out that piece here if not done so already.
*
There have been a lot of changes in flat racing over the past 15 years. Change always has the potential to affect betting performance and punters need to be prepared to adapt to such new challenges.
Until next time...
- DR