Top 10 Front Running Biases in Handicap Chases, Part 2: 5 to 1
Top ten front running biases in handicap chases, Part 2 – 5 to 1
In this second article of two, I will be sharing what I believe to be the Top Five run style biases in handicap chases in the UK and Ireland, writes Dave Renham. In the first article, which you can read here, I revealed positions 10 down to 6; they all had very strong biases towards front runners. The five shared below I feel have been even more advantageous to early leaders.
I have used data for handicap chases only as they tend to offer more robust data; and I have gathered data from 2018 to 2024 with no minimum runner consideration. To assist with the correlation I have used two tools from this site, namely the Pace Analyser and the Query Tool. Having access to them is a huge benefit to Gold membership in my opinion.
The run style / pace data on Geegeez is split into four - Led, Prominent, Mid Division and Held Up. A quick recap of the four run styles:
Led – essentially horses that lead early, usually within the first furlong or so; or horses that dispute or fight for the early lead.
Prominent – horses that lay up close to the pace just behind the leader(s).
Mid Division – horses that race mid pack.
Held Up – horses that are held up at, or near the back of the field.
OK, let me kick on starting with number five.
5 Kelso 2m5½f-2m6½f
We start in the Scottish borders at Kelso, essentially over a trip of 2m6f. They sometimes race over a half furlong more or less then 2m6f. The stats for 2018 to 2024 were as follows:
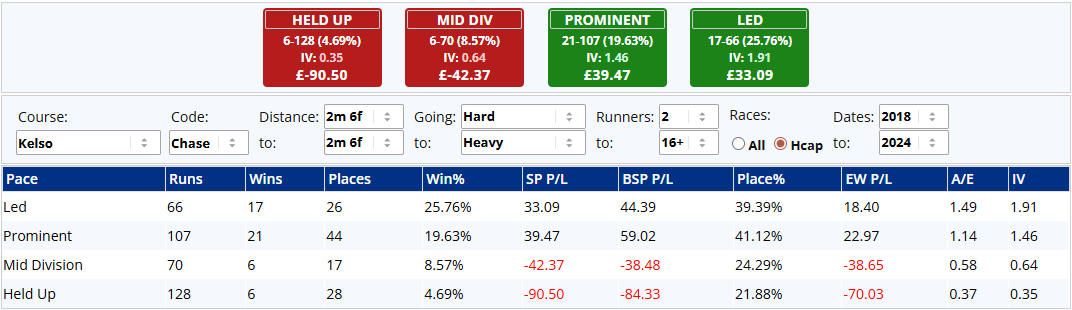
Strong prominent stats make this a course where a position at or near the front early has been a huge advantage. There were slightly stronger Led stats at some other course and distance combinations that I looked at last week but, for me, the additional strength of the prominent figures cemented a very robust overall run style bias.
Horses trying to mount their challenges from off the pace have really struggled over the past few years here, as the win and placed stats clearly show. The struggles of horses racing off the pace early can be highlighted further when sharing the PRB stats. PRB stands for ‘Percentage of Rivals Beaten’.

I grouped the Mid Div and Held Up stats together; their figure of 0.40 (40% of rivals beaten) is a poor one and, to coin a phrase, ‘well off the pace’.
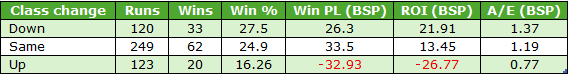
The bias to horses up with or close to the front was stronger on good or firmer ground, or at least the stats suggested this:
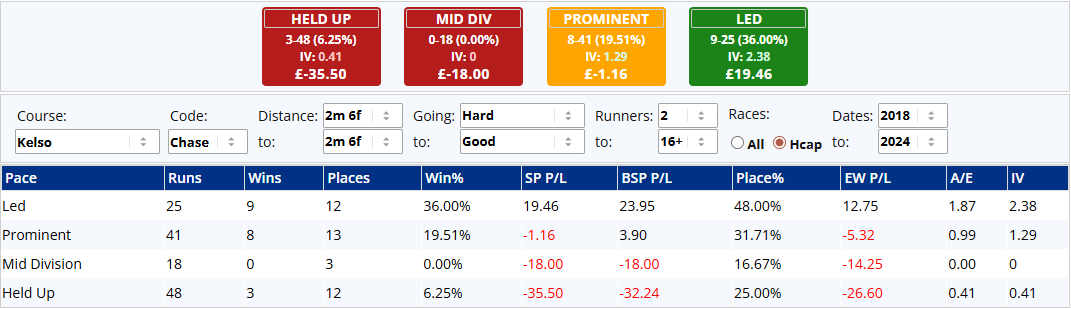
17 of the 20 races were won by either early leaders or prominent racers. The 'Led' A/E of 1.87 indicates that front runners were very good value on better ground during this timeframe.
Having started in Scotland we now travel south to Cheltenham.
4 Cheltenham 2m4f–2m5f
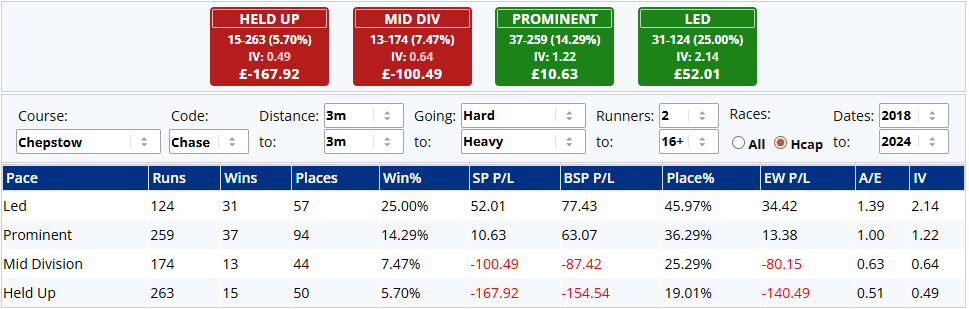
It is the middle distance range again, around the 2m4f mark, at Cheltenham (both courses, Old and New, combined). Perhaps not a track that initially would scream out front running bias, but the stats were very strong:
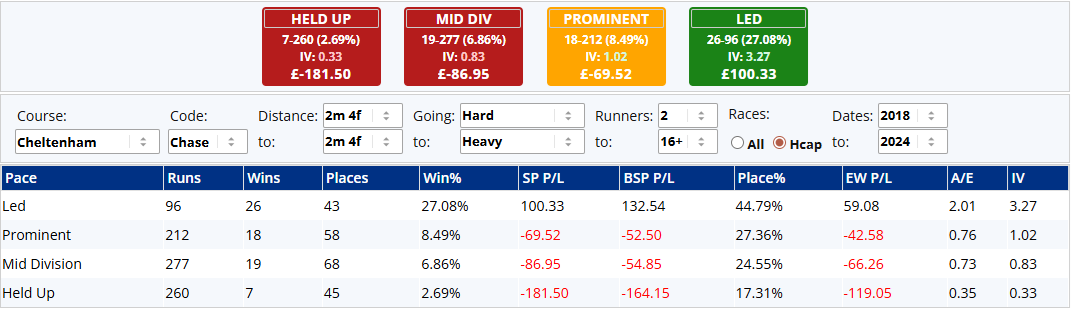
The comparison that caught my eye was the Led versus Held Up win ratios. Front runners won 26 races from just 96 runners, while Hold Ups won just seven from 260! If we had been able to predict the front runner(s) pre-race we would have made a fortune to SP, let alone BSP. Even backing each way would have been extremely profitable.
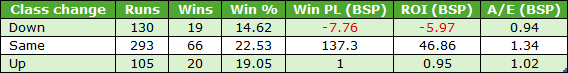
On good or quicker ground the bias seemed to strengthen as these stats suggest:
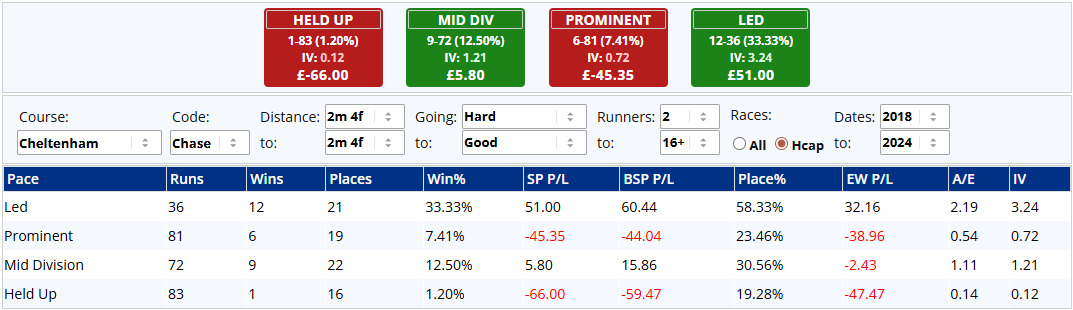
Of the 20 races with 15+ runners, just one win was achieved by a hold up horse from 114 qualifiers. The bias has still been strong on easier ground but not as strong.
Onto the PRBs (all going conditions):
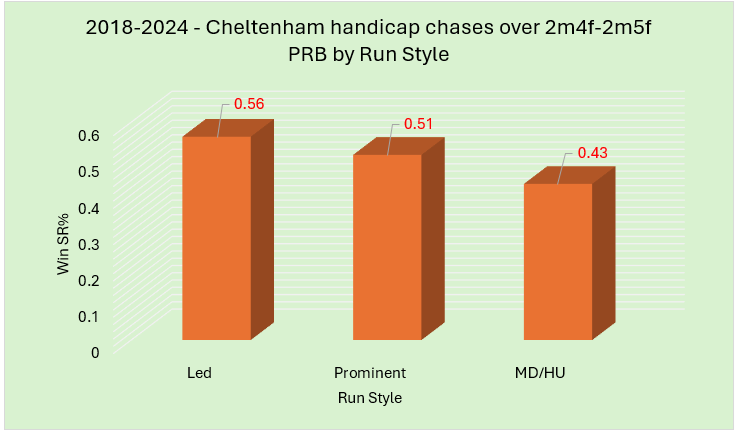
I had expected a slightly higher Led PRB based on the placed stats but they have still been comfortably the best. A higher PRB would have probably edged this track/trip further up the list.
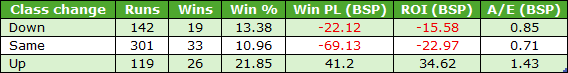
Finally, I felt the stats for races with bigger fields (10+ runners) were worth sharing:

Front runners have offered huge value in these races (A/E index 2.53), with potential returns to BSP of nearly 200%!
There have been 11 races so far this year, with just a single win from 16 front runners. However, they have had three further placed horses including a place BSP of 37.55!
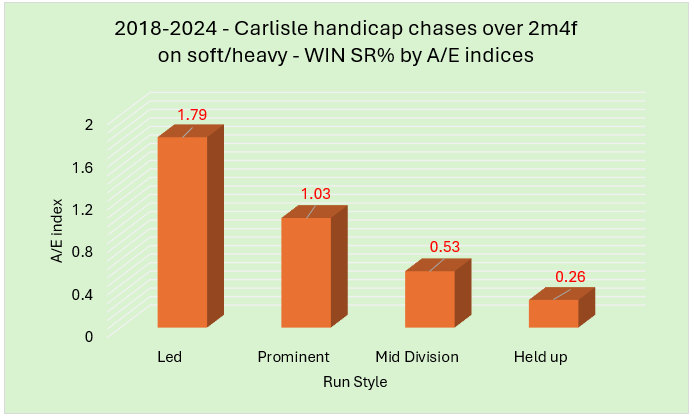
3 Tramore 1m7f-2m
The Irish course of Tramore may not be that familiar to some UK punters but run style stats for handicap chases over the 1m7f/2m trip there are well worth sharing:
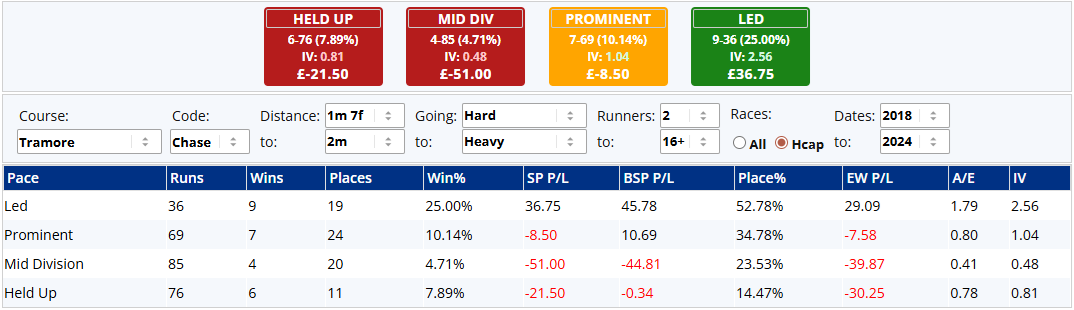
Yes, the sample size was relatively small but it was potent in favour of front runners with an extremely high A/E index at 1.79 and IV of 2.56. The PRBs correlate strongly and underscore the bias:

The 0.64 figure for front runners, compared with 0.42 for Mid Div/Held Up runners, over this timeframe indicated that the edge was huge. The big advantage of PRB figures is that they effectively help to make small datasets bigger. In racing we often deal with modest sample sizes, relative to what general statistics would consider so at any rate. Hence, when we then try to discern knowledge from the data by using PRBs we are examining all the runners in all the races, rather than just the winners and/or the placed horses. It's not a perfect metric - what is? - but it adds depth to shallow cohorts.
For the record, of the four qualifying races held in 2025 to date, two have been won from the front, at odds of 7/2 (BSP 4.99) and 6/1 (8.2). A third front runner in that quartet was still leading when unshipping his jockey five out.
2 Killarney 2m4f-2m5f
Staying in Ireland for number two, we head to Killarney over 2m4f-2m5f (use 2m4f when using the Pace Analyser / Query Tool):
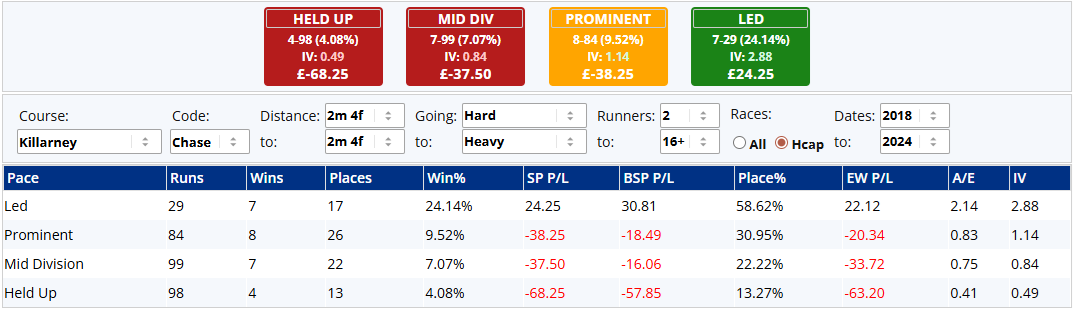
The Led group of runners hit 2.14 in terms of A/E index and 2.88 in terms of IV. There was a huge 58.6% placed figure to boot. Horses that were held up managed a place percentage of just 13.3%. As with Tramore the sample size was relatively small so let me share the PRB figures:

The 0.66 figure for the Led group compared with 0.39 for Mid Div/Held Up runners helps to confirm the huge front running edge there has been over the past few seasons.
Each year we mighgt reasonably expect four or five qualifying races, which is fewer than ideal, but when they do occur they are races we need to try and take advantage of.
And now for my number 1...
1 Uttoxeter 2m4f-2m5f
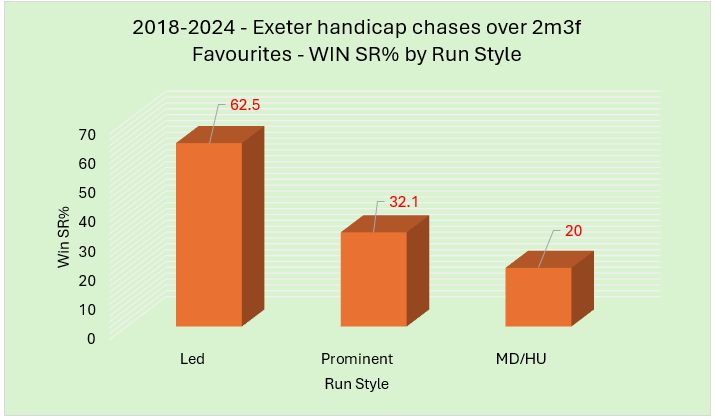
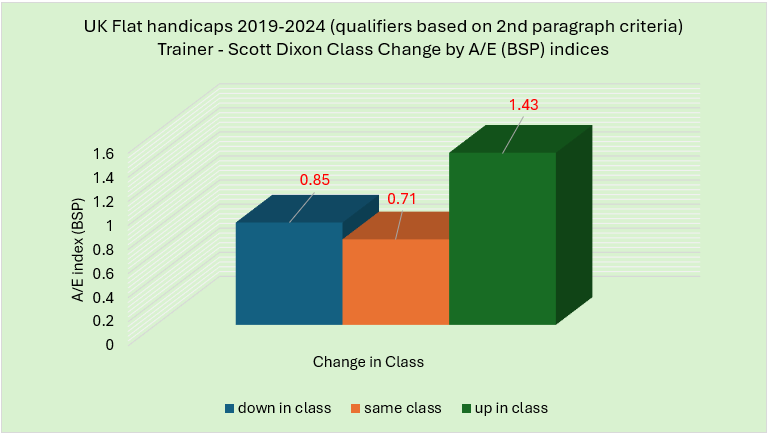
Top spot goes to Uttoxeter and its mid-range handicap chases. The majority of races were at 2m4f, but a handful were contested over an extra furlong. These are grouped together in Geegeez (using the 2m4f distance) and stats were as follows:
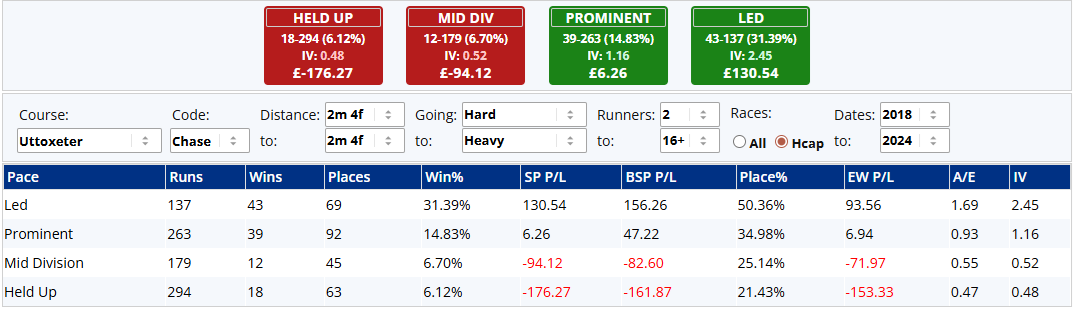
There were over 100 races in the sample, making this set of data extremely robust. Front runners won better 31% from within their group, had strong metrics across the board and potential profit levels were high. Front runners and prominent racers won 73% of the 112 races from 46% of the runners; and front runners alone won 38% of the races from just 16% of the runners!
The PRBs confirmed the pattern:

The front running edge is clear to see by looking at the bars on the graph, especially noteworthy due to the large number of races at this course and distance.
Ground conditions have made little difference with the win rate for front runners on good or firmer being 32.2%, while on good to soft or softer it was 30.8%.
At the time of writing, 2025 had seen 14 such races of which seven were won from the front.
*
Incredibly, run style bias in NH racing is something that still goes under the radar for many punters. There are not many clear-cut edges we can still get as punters these days, but knowing which course and distance combinations offer the strongest biases will almost force us to improve our bottom line.
Until next time...
- DR