All-Weather Analysis: Wolverhampton Racecourse
It’s time to head to the Midlands for the final article in this all-weather series, writes Dave Renham, the course in focus being Wolverhampton racecourse. I will be using racing data from 1st January 2017 to 31st August 2022 which has been once again been taken from the Geegeez Query Tool. Therefore all profits / losses have been calculated to Industry Starting Price. We all know that we should be able to significantly improve upon the baseline figures of SP and I will share Betfair SP data if appropriate.
I have written about Wolverhampton before in regards to running style, so I will be sharing the new data from the past 11 months as well as comparing with the long term figures. I have not analysed the draw in any real depth before so we will start off by looking at the long term data (2017 onwards) and take it from there. For both sections, running style and the draw, my focus will be handicaps of eight or more runners only. This is in line with previous research in those areas, except for Southwell where I used seven runners-plus due to the small time frame examined.
Wolverhampton races take place on a tapeta surface; this was changed in 2014, before which they had used polytrack. Let’s start to dig...
Running Style at Wolverhampton
Wolverhampton 5f Run Style Bias
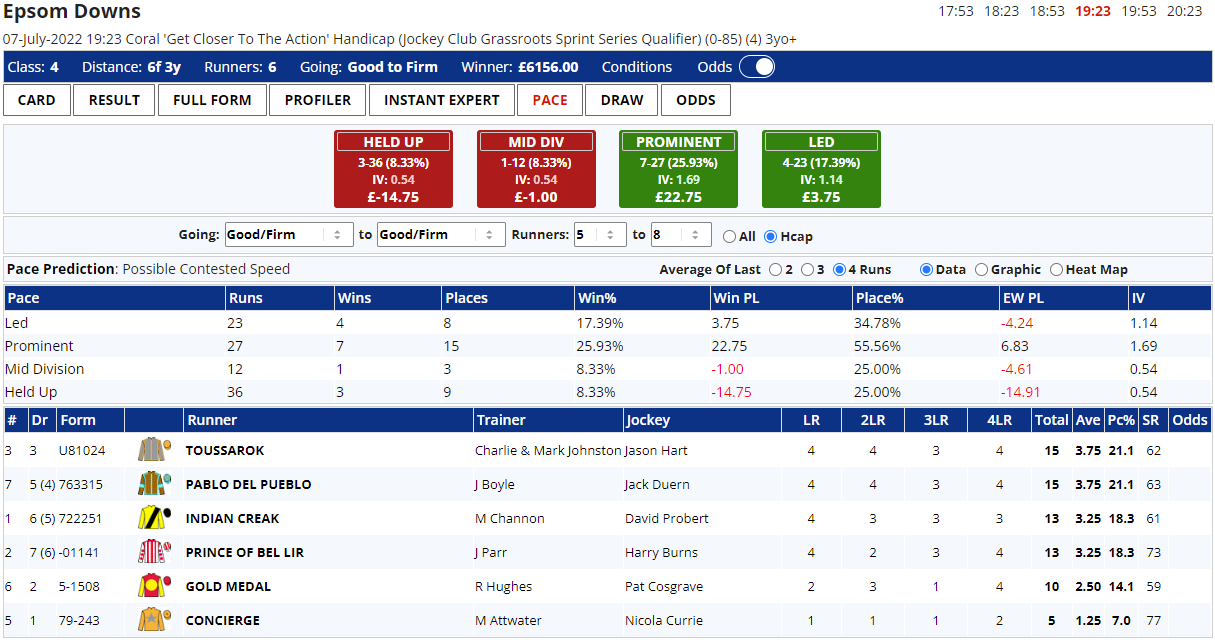
First a look at the minimum trip of 5f. Here are the run style splits in 8+ runner handicaps covering the time since my last article (1st Oct ’21 to 31st Aug ’22):

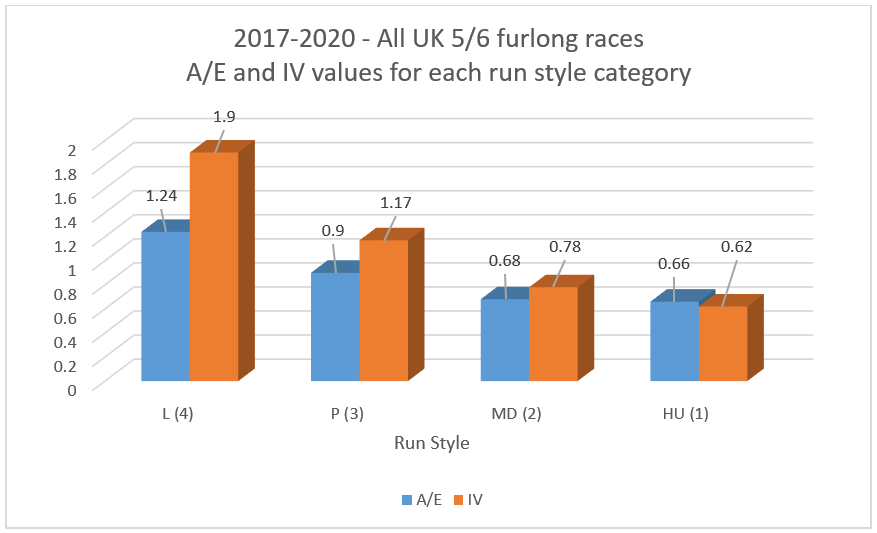
In the past 11 months, front runners have triumphed in 13 of the 37 races which equates to 35% of all qualifying races. N.B. In some races, two horses have challenged for the early lead hence the 25.49% figure in the graph.
The A/E* indices for this recent time frame correlate positively (see below):

*A/E, or Actual vs Expected, is a measure of the profitability of an angle based on starting prices. Further details on A/E, PRB and all our metrics can be found here.
Going back to 2017 and taking the last six years as a whole (up to 31/8/22), front runners / early leaders have won just over 20% of the races (A/E 1.48). Meanwhile prominent racers have won around 12% races (A/E 0.91), so the long term figures suggest the front running bias is strong, and the recent data backs that up. Essentially, if your horse races midfield or near the back early, it is at quite a disadvantage.
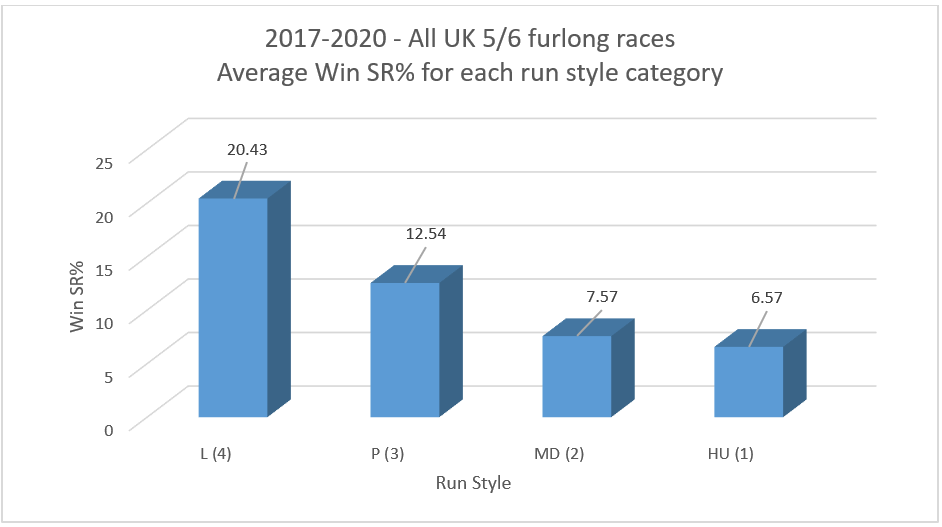
Now, I rarely look at non-handicap data but if we look at the non-handicap 5f run style results since 2017 we get a very similar picture:

Arguably the bias is even more potent in non-handicaps, where there is likely an ability bias: those at the back will often not have the talent to get to the front! However, what we can say is that 5f races offer a strong front running bias in all races, not just handicaps. Backing all front runners in handicaps would have yielded a huge 70p in the £ return over the past six seasons, had the crystal ball been fully functional!
Wolverhampton 6f Run Style Bias
Onto 6f now and the run style splits from 1/10/21 to 31/8/22. There have been 56 races in this short amount of time so a decent sample:

There clearly has been a bias to horses that lead early or race prominently over six furlongs. The long term stats (back to 2017) correlate with this recent data, although the figures are not quite as strong, with front runners winning 14% and prominent racers 12% (mid div 8%, held up 7%).
Of course, we know predicting the front runner in a race is far from an exact science, but let us assume you were clairvoyant and had predicted all front runners since 2017 in 6f handicaps (8+ runners); in that notional case, there would have been a profit to SP of £117.80 for £1 level stakes which equates to returns of just over 22p in the £. Amazingly, backing all prominent racers would also have secured a profit.
Over 6f in handicaps therefore, a prominent pitch / early leading position is ideal, all other things being equal.
Wolverhampton 7f Run Style Bias
Onto the recent 7f handicap figures:

There is quite an even split here with three of the run styles, though hold up horses remain at a clear disadvantage. I think it is worth comparing these run style percentages with those from 1/1/17 to 30/9/21 to check on the correlation:

Essentially the correlation is positive: hold up horses have definitely had a tough time of it, although the long term stats suggest their chances are better than the most recent data indicated. Overall at this 7f trip I would probably look to avoid genuine hold up horses.
Wolverhampton 1 mile+ Run Style Bias
Once we get to longer distances a prominent run style seems to be very slightly favoured, but essentially I would not advocate using run style analysis in these races.
The Draw at Wolverhampton
All races are run on the round course, with the 7f distance starting from a chute:

Wolverhampton 5f Draw Bias
A look at the minimum trip first. There have been close to 250 qualifying races in this time frame so a huge sample. Here are the draw splits going back to 2017 for 8+ runner handicaps:
![]()
Low draws seem to have a solid edge from a win perspective. Let’s see whether the percentage of rivals (PRB) data backs this up:
![]()
These figures suggest that this is a playable draw bias. Also this bias has proved to be consistent year in, year out. Here are the PRB figures for both the bottom and top thirds of the draw broken down by year:

As we can see, low draws had yearly figures varying from 0.52 to 0.58; high draws from 0.40 to 0.46. In each individual year low drawn horses have clearly enjoyed a good edge over their high drawn counterparts.
In conclusion, I would always favour lower draws over higher ones. Of course we need to take run style into account too, so with that in mind here is the draw and run style heat map for 5f handicaps (PRB figs):

This map illustrates that run style is a more potent indicator than draw, as front runners can win from anywhere including high. However, the remaining run styles when drawn high have a very poor time of it; especially horses racing in mid-division or near the back early.
Wolverhampton 6f Draw Bias
There have been 359 races since 2017 so an even bigger sample. Here are the draw splits in terms of win percentage:
![]()
This looks a much more even playing field than it did over 5f. How about the PRB figures – what extra insight do they give us?
![]()
It seems that high draws are again at a disadvantage. Low and middle draws are essentially on a par with each other.
Digging a little deeper, if we combine the four lowest stalls in every race it gives us a combined strike rate of 10.7% (A/E 0.87). Backing all of those draws in every race would have yielded a loss of 15p in the £ to SP. Combining draws 10 to 13 has given a strike rate of just 5.1% (A/E 0.69) and would have produced losses of 40p in the £. Hence, it seems that daws 1 to 4 are twice as likely to win as draws 10 to 13. Something to be aware of when the field size gets to double figures for all that it's not a profitable angle in itself.
The key takeaway here is perhaps the negative draw bias in relation to the highest third.
Wolverhampton 7f Draw Bias
Up another furlong and the number of races keeps increasing. This time there are nearly 400 races in the sample:
![]()
High draws are marginally worse off again and, once again, the PRB figures support the contention that there is a slight negative bias here with high numbers definitely worse off:
![]()
The highest draws (10 or bigger) have a PRB figure of just 0.42. Hence, it should be no surprise when we get to the two biggest field sizes (11 or 12 runners) that the top third PRB figure is a relatively lowly 0.43. In general, then, I would probably ignore horses from double figure draws unless I feel they have a clear edge over the rest of the field or can get to the front without burning too much gas.
Once we get to races of over 1 mile the draw is extremely level; in these races you can disregard the draw completely.
Wolverhampton Draw Summary
At Wolverhampton in 8+ runner handicaps, the draw is material at distances up to and including 7f with very high draws at a disadvantage, while low draws are definitely best over five furlongs.
Trainers at Wolverhampton
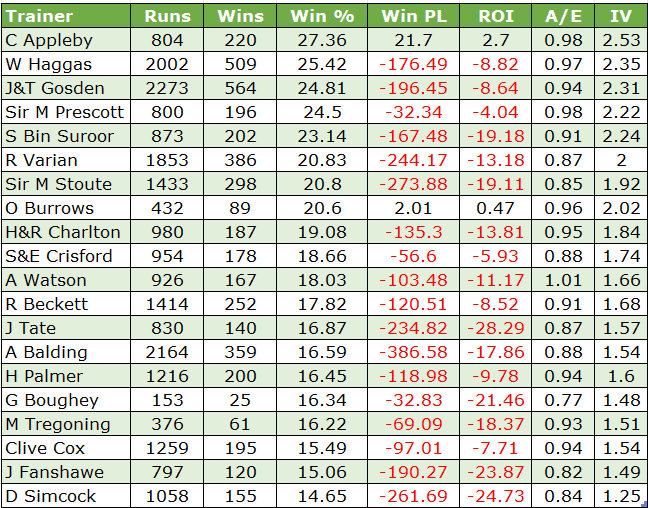
Nearly 3500 races going back to 2017 means we have a huge chunk of trainer data to drill down into. Below are the trainers who have secured a win strike rate of 14% or more from a minimum of 150 runs (ALL race types included):

All-weather stalwarts Haggas, Gosden and Varian all have strike rates in excess of one win in every four runs. Let’s look at these three yards in more detail.
William Haggas at Wolverhampton
Haggas' Wolves runners performance based on run style is worth sharing. His front runners and prominent racers have combined to win over 40 races and secure a strike rate of a hefty 43.1%; while his midfield and hold up horses have won just 11 races from 78 (SR 14.1%).
Other key findings are that Haggas has proved profitable to SP with horses sent off both as favourites and second favourites (ROIs of 9% and 13% respectively); and he has produced a strike rate of 36% when teaming up with jockey Tom Marquand. A return of 11p in the £ for this pair is playable. Finally, Haggas has a better record in non-handicaps where his runners have essentially broken even; his handicappers on the other hand have lost 23p in the £.
John (and Thady) Gosden at Wolverhampton
Over the past six seasons there has been good consistency shown by the Clarehaven yard of the Gosdens. Looking at the yearly win and each way strike rates show this:

From a win perspective every year has been 20% or higher; for each way purposes (win and placed combined) Team Gosden has hit 50%+ in five of the six seasons. Indeed, the 2017 figure of 44.74% is still commendable.
It should also be noted that 96.5% of all their winners have come from the top three in the betting. Horses 4th or bigger in the betting have a poor record with just 2 wins from 40 (SR 5%). Their 2yos have just about sneaked into profit, while their non-handicappers have broken even, give or take.
Finally, there is one negative to share: Gosden hold up horses have won just 15% of the time, losing an eye-watering 44p in the £.
Roger Varian at Wolverhampton
Roger Varian has just about sneaked into profit to SP which is impressive. Here are his strongest stats:
- When Varian books Jack Mitchell to ride they have combined to win 24 of the 72 races (SR 33.3%) for a profit of £49.13 (ROI 68.2%)
- Over 60% of his 3yo's have won or placed. Backing them all to win would have secured a return of 19p in the £
- His strike rate with fillies and mares (female runners) has been higher than his strike rate with male runners. The ladies have secured a profit of £22.66 (ROI +28.3%)
- His win and placed strike rate has exceeded 50% in all six seasons
- Horses that raced prominently have won over 35% of the time
Trainer Comparison: Wolverhampton vs Other All-Weather Tracks
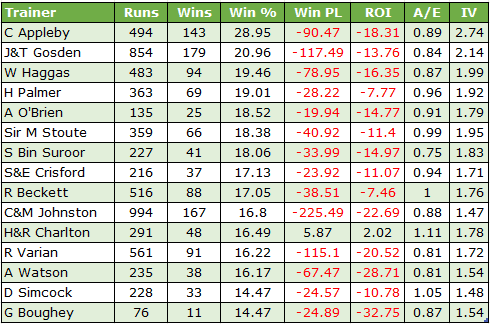
Before moving away from trainers, I'd like to do something a little different compared to previous articles. Below is a table comparing trainer strike rates and A/E indices at Wolverhampton with the same trainer's combined strike rate at the other five UK all-weather courses (Chelmsford, Kempton, Lingfield, Newcastle, Southwell). To qualify, each trainer has had at least 100 runners at Wolverhampton and at least 200 runners when combining the other five courses.
I have highlighted in green all A/E indices of 1.00 or more (strong positive); all indices 0.7 or lower are in red (strong negative). For context, the overall average A/E index for all trainers is 0.86, therefore any trainer between 0.92 and 0.99 I have highlighted in blue as I see these figures as a decent/positive mark.


It is interesting to note that most trainers have quite similar strike rates and A/E indices when comparing the Wolverhampton form with the wider all-weather circuit. Only Alan King seems to be a trainer who performs far better at Wolves than he does at other all weather courses combined, and that may very well be coincidence.
Jockeys at Wolverhampton
I'm not going to go into great detail about jockeys here, but I thought it worth sharing the riders who have secured an A/E index in excess of 1.00 at the course (100+ rides). Below is a graph detailing their win and win & placed (each way) strike rates at the course:

In order to prevent the data overlapping I have rounded the strike rates to the nearest whole number; I would see it as a positive if any of these jockeys was on board a horse I fancied at Wolves.
Wolverhampton Gender bias
We have seen a gender bias at each of the all-weather courses studied to date; here are the figures for Wolverhampton:

Once again males have the edge in all departments: Win%, ROI%, A/E and IV.
Females hold their own when comparing gender data from the top three in the betting, something we have seen at the other all-weather courses: specifically, male A/E index is 0.87, female 0.86; and SP returns show a difference between the two of just 1p in the £.
But males tend to outperform females at bigger prices – again, this is a pattern we have seen before.
Wolverhampton market factors
Let's now look at the win strike rates for different positions in the betting; starting with favourites and moving down to position 7th or more:

Favourites and second favourites have proved to be the best value as the A/E indices show:

Favourites have only lost 5.5p in the £ to SP; second favourites 9p in the £. At Betfair SP, favourites would have lost you 2p in the £ after commission, second favourites just a tiny loss of 0.5p in the £. Hence the top two in the betting seem to require close scrutiny here.
Sire Performance at Wolverhampton
Next we'll examine some sire data. Here are the top 20 sires in terms of strike rate since 2017. (To qualify – 100 runs or more; and must have had runners somewhere in the UK during 2022):

We have seen many of these in other top AW course lists such as Sharmardal, Dubawi, Frankel, and Lope De Vega to name but four. Kingman heads the list here and he has a good spread of different winners, rather than one or two horses dominating his statistical profile. In fact, 28 different horses (for his 30 wins in total) have won for him as their sire. Likewise, Dubawi has had numerous different winners: 39 different horses winning his 42 races.
In terms of damsires here are the top 10 in terms of strike rate:

It is promising to see all ten damsires with A/E indices of 1.00 or more. It is also slightly surprising to see eight of the ten in profit to SP. I'm not sure whether this will be kept up in the long term but it is interesting to say the least! This winter I think it is worth noting any runner whose damsire appears in this table; I would see it as a positive.
Wolverhampton Horses for courses
My final port of call as always is to look at some horses that have excelled at the course since 2017. To qualify for the list they must have won at least four races at the track with a strike rate of 25% or more. Further, they must have raced somewhere in the UK in 2022. Here are the horses that qualify, listed alphabetically. I have included a PRB column too (Percentage of rivals beaten):

Just the ten horses on the list, and one of the ten, Cappananty Con, switched trainers some time back and has not raced at Wolves for three years, so that is worth bearing in mind. If any of the horses in the list appear at Wolverhampton this winter, they are worth a second glance for sure.
Wolverhampton Key Takeaways
Before winding up, let's look at the main takeaways for Wolverhampton:
- In 5f handicaps (8+ runners) front runners have a good edge from a run style perspective. They seem to have an even stronger edge in non-handicaps
- In 6f handicaps (8+ runners) front runners and prominent racers clearly outperform horses that race mid-pack or are held up at or near the back early
- In 7f handicaps (8+ runners) hold up horses have a poor record and are at a disadvantage
- Low draws have an advantage over 5f; the highest draws have a relatively poor record
- In 6f and 7f handicaps (8+ runners) it is a disadvantage to be drawn in a double figure stall
- In terms of trainers, Haggas and Varian are two to generally keep on the right side
- Male runners outrun female runners in general. However, when looking at the front end of the market there is little between them
- Favourites and second favourites have performed slightly above the norm
- Progeny of Kingman have a very strong record at the track
- Refuse To Bend, Iffraaj, Dark Angel, Kingmambo, Montjeu, Street Cry, Zamindar, Exceed And Excel, Cape Cross and Dubawi are damsires whose horses have performed well here
*
And that's all of the tracks analysed. I hope you have found this all-weather series informative.
Next time, I’ll be looking at National Hunt trainers, starting with one at the very top of his game.
- DR


![Sire performance at Dundalk, 1/7/20 to 31/8/22 [100+ runners to qualify]](https://www.geegeez.co.uk/wp-content/uploads/2022/09/img_6328962099416.png)