Jockey Profiles: Danny Tudhope and Ben Curtis
This is the third in my series of articles on jockeys, and in this one I am examining the two jockeys who have ridden the most winners at northern or Scottish tracks in the past eight seasons, namely Danny Tudhope and Ben Curtis, writes Dave Renham. Between them they have ridden over 7500 horses in this part of the UK, winning 1242 races (Tudhope 687 wins, Curtis 555), and these runners have accounted for about 75% of Tudhope’s total rides in the UK/Ireland and about 64% of Curtis’s. They have both been successful ‘down south’ as well; Tudhope, for example, has ridden four winners on two separate occasions in Royal Ascot festivals – once in 2019 and then again in 2022.
As with the previous two articles I am analysing the last eight full years of flat racing in the UK and Ireland (2015-2022). I am using the Profiler Tool along with the Query Tool as the main vehicles for my data gathering. In all the tables profits/losses quoted are to Industry SP, but I will quote Betfair SP where appropriate.
Let’s start with Tudhope.
Danny Tudhope Jockey Profile
Danny Tudhope: Overall Record
Let me first review Tudhope’s overall stats by looking at his performance on every single runner during this eight-year period:
![]()
This is a very presentable set of figures – a win rate of roughly one win in every six and very modest losses of just over 7½ pence in the £ to SP. Indeed, to BSP this would have been converted into a profit of £317.49 (ROI +6.1%), with five of the individual years showing 'in the black' against the machine. Tudhope's A/E index, a ratio that essentially determines value, is above the average for all jockeys, as is his PRB figure.
Danny Tudhope: Record by Year
Yearly stats are the next port of call. Here is a breakdown by both win and win/placed (Each Way) percentage / Strike Rate (SR%):

As can be seen, 2019 was his best year hitting the winners' enclosure on nearly one in five of his rides. Overall, Tudhope's performance has been very consistent both from a win and placed perspective, which is something one always likes to see. This consistency can be viewed even more clearly when we look at his yearly PRB (Percentage of Rivals Beaten) figures:

Danny Tudhope: Record by Betting Odds / Price (SP)
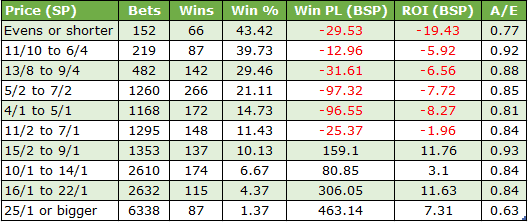
The Profiler on Geegeez gives a breakdown of performance by Starting Price splitting the market into seven price brackets. Tudhope’s figures are as follows:
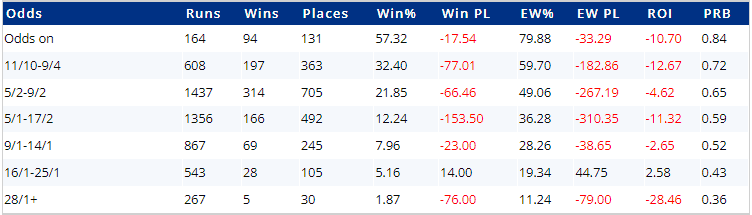
At the shorter prices (9/4 or less) his figures are slightly below what would be expected, certainly in terms of returns. The remaining figures are slightly above what might be expected in terms of returns. His strike rate of 5.16% on horses priced 16/1 to 25/1 is well above the figure for ALL jockeys, which stands at only 3.47%. The same is true when looking at the 9/1 to 14/1 price bracket – Tudhope’s SR% stands at 7.96%, the ALL jockey figure stands at 6.56%. These mid- to bigger-priced horses have definitely offered some value for punters over the past eight seasons, though with single digit hit rates, it can be a long time between drinks!
Danny Tudhope: Record by Distance
A look at Tudhope’s record at different distances now. I have grouped them into five distance bands as with the previous two jockey pieces, and once again it is win strike rates that are being compared:

Similar strike rates, although the longest distance win percentage is slightly below the others. This might be due to the smaller sample size of 139 races. Tudhope primarily rides in races of 1 mile or less – roughly 75% of all his rides have been over these shorter distances with an even split between 5-6f and 7f-1m. Personally, I am a fan of Tudhope in sprints – he is excellent when on a front runner in these 5-6f races, winning over 30% of the time (92 wins from 300). Backing all these runners would have yielded a profit of £161.01 to SP (ROI +53.7%). Clearly we are never totally sure which horse is going to front run, but if a Tudhope sprinter does go to the front early it is cause for optimism. For the record, his returns on front runners have been virtually identical in handicap sprints and non-handicap sprints.
He also has a winning strike rate of around 27% in 7f-1m races on front runners which is equally as eye-catching, if not more so (N.B. average SR% for ALL jockeys on 7f-1m front runners is 18%).
Danny Tudhope: Record By Racecourse
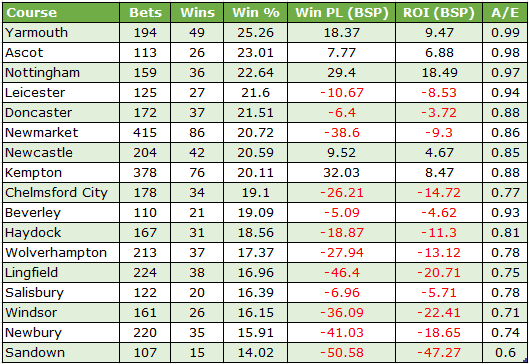
I am now going to look at all courses where Tudhope has had at least 150 rides. The courses are listed alphabetically:
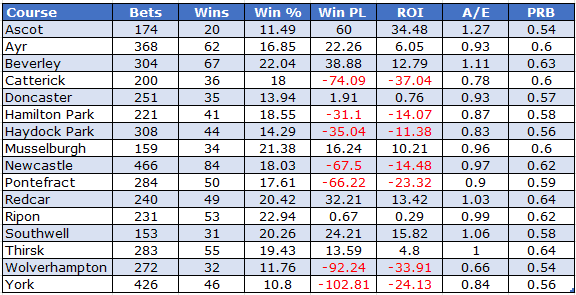
As expected, the majority of the courses in the table are northern English or Scottish tracks. Overall there is a fair smattering of profitable courses. When looking at market factors and taking out some of the bigger priced winners, four courses stand out, namely Beverley, Musselburgh, Redcar and Ripon. Tudhope riding at any of these should generally be considered to be a positive. At Beverley it is worth noting that restricting Tudhope to horses that were either favourite or second favourite would have yielded 46 winners from 142 rides (SR 32.4%) for an SP profit of £31.63 (ROI +22.3%). To BSP this edges up to +£47.88 (ROI +33.7%).
Danny Tudhope: Record by Trainer
Time to examine the trainer stats and below are all the trainers (still in business) for whom Tudhope has had at least 100 rides. They are ordered by strike rate.

Tudhope is David O’Meara’s stable jockey which explains the huge number of rides for the Yorkshire handler. He has a very good strike rate when riding for the William Haggas stable, but a good proportion of these rides have been at short prices. A couple of courses stand out with the Haggas / Tudhope combination: firstly they are 8 from 17 at Redcar, while at Newcastle they have secured 11 wins from just 23 runs.
He has profitable records to SP when riding for Archie Watson and Karl Burke. In fact, when riding for Watson, which he has done between 2017 and 2022, five of those six years produced a profit to BSP.
There are three trainers that should be mentioned, although none made the above table due to not having enough rides to qualify. They are Kevin Ryan, James Bethell and Sir Michael Stoute. Tudhope has a good record with all three both from a strike rate and a returns perspective.
Danny Tudhope: Record by Run Style
Onto run style now. I have already shared the fact that Tudhope has an excellent front running record on horses that race between 5f and 1m. Here is a breakdown of his run style performance in terms of percentage of runners that match each one:
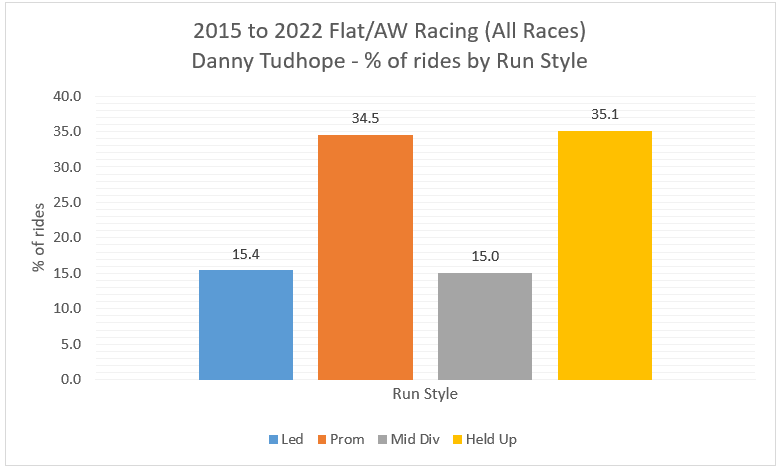
These figures are very similar to those you would find if you averaged out all jockeys in the weighing room. It is a shame he has not led early on more than 15.4% of all horses considering how effective he is from the front. Of course, that style doesn't suit all horses on all occasions.
Tudhope wins more often with front running horses than with prominent racers, which in turn out-perform midfield racers and those held up early. This is the normal pattern we see for virtually all jockeys on the flat.
Danny Tudhope: Record by Market Factors
As regular readers will know I am a big fan of looking at favourite run style data, too, as this eliminates any potential selection bias regarding ‘good horses at the front, bad ones at the back’. Here are the relative win strike rates for Tudhope horses that have started as the market leader in terms of the four main run styles:
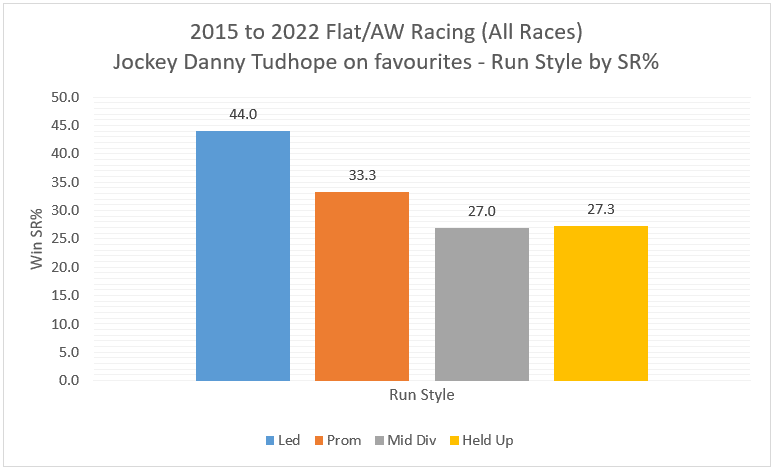
Front running favourites perform much the best. They secured a profit of around 15p in the £ assuming your crystal ball could have accurately predicted that they would all front run as well as being favourite. Tudhope has won from the front on favourites at all distances so is clearly an excellent judge of pace when leading, regardless of distance.
He is also one of the better jockeys from off the pace, especially in races at beyond a mile. In longer distance races I would not be put off by a Tudhope runner that habitually is held up.
I will summarize Danny Tudhope main takeaways at the end of the article, but now it is time to look at Ben Curtis.
Ben Curtis Jockey Profile
Ben Curtis Overall Record
Here are the overall stats for Ben Curtis:
![]()
Curtis has a slightly lower win strike rate than Tudhope, but still highly respectable, around the one win in seven mark. The A/E index of 0.95 is close to ‘value’ and to BSP Curtis would have secured punters a 4p in the £ profit across all his 5796 rides, which is mightily impressive.
Ben Curtis: Record by Year
Here is a breakdown by both win, and win/placed (Each Way) percentage / Strike Rate (SR%):

There has been a clear uptick when comparing 2018-2022 data with that from 2015-2017. This has occurred both from a win and each way perspective. There is a reason for this, as the improvement coincided with getting better rides as a whole from 2018: we can see this when we look at the prices of his runners year by year, especially the shorter end of the market. Here is a graph looking at the percentage of Curtis's rides by year that have been on horses priced 9/2 or shorter.

As the graph indicates, in 2022 compared with 2015 he rode more than double the number of horses sent off at 9/2 or shorter (in terms of percentage of his rides). Riding shorter priced runners improves the strike rate and that has been the driving force in the more recent past. I have said before that, where possible, we cannot be dependent on just one type of statistic. The more data and info we have at our fingertips the better, especially when it helps us understand why certain stats look the way they do.
Ben Curtis: Record by Betting Odds / Price (SP)
A look now at the Profiler splits in terms of Industry Starting Price:

The shortest priced runners (odds on) have, amazingly, nudged into SP profit. That is unusual. The 9/1 to 14/1 bracket has also seen him out-perform the average, certainly in terms of strike rate, as we saw with Tudhope earlier. It looks like the very big-priced runners (28/1 or more) are worth avoiding though – just 5 winners from 553 with losses of just over 62 pence for every £1 staked.
Ben Curtis: Record by Distance
Time to see if there are any clear differences when we look at Ben's record at different distances. Normally these figures are very similar, but it is always worth checking just in case:

As with Tudhope the very longest distances have the lowest strike rate, but again the sample size is smaller than the other categories – 197 races in the 1m7f+ sample. I would say Curtis has no major strengths or weaknesses when it comes to riding at different distances.
Ben Curtis: Record by Racecourse
Let's take a look at ‘Curtis by course’ – as before the courses are listed alphabetically and the minimum number of rides to qualify is 150:
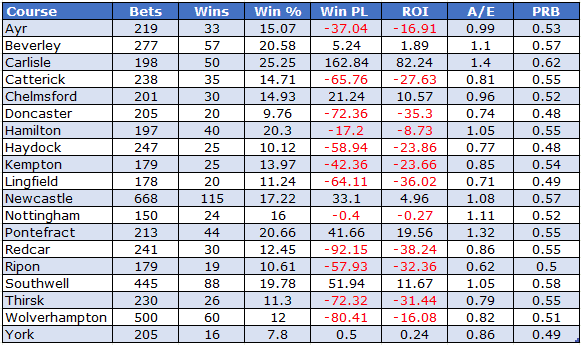
Seven of the 19 courses have produced a profit to SP, with the Carlisle stats leaping off the page. At Carlisle Curtis has secured comfortably the highest strike rate compared to other courses, likewise the A/E index is the highest of all courses as is the PRB figure. Profits are extremely high, but we need to dig a bit deeper to see how many big-priced winners have affected the bottom line.
The biggest priced winner for Curtis at Carlisle has actually only been 25/1 so that makes these figures even more impressive. Below is the Carlisle breakdown by year, which is always useful to review for consistency:

Probably two things stand out initially. Firstly the eye is drawn to the poor performance in 2019 and, secondly, the 2015 profit figure accounts for over half of the eight year bottom line. Dealing with the poor 2019 – this is bound to happen when examining course/jockey stats. If you look at the PRB figure for that year it was similar to four of the six other years, so things are not as bad as they look at first glance. Also when delving in more detail into 2019, it emerges that Curtis rode eight horses at the course which finished second including at some reasonable prices – 6/1, 7/1, 8/1. With smaller data samples these ‘poor’ years will happen. Statistical variance, luck, quality of rides will all play a part too.
In terms of 2015 providing more than half the profit, it should be noted that four of the other six seasons made a profit, and decent profits at that. 2022 was a losing year, but his placed strike rate was actually the highest of any of the seasons (59%) so again perhaps not as ‘bad’ a year as the raw stats suggest.
All in all it is clear that Curtis rides Carlisle very well and, for the record, he has won for 24 different trainers at the course, so he is not reliant on a single handler, like so many jockeys are. He has also won for 30 different trainers at Beverley (57 winners).
Ben Curtis: Record by Trainer
That leads us nicely onto Curtis's performance for different trainers now. Below are all the trainers (still operating) for whom Curtis has had at least 100 rides. They are ordered by strike rate.

* including singular trainer name entities at the same yard
The combination with William Haggas is extremely good, although Curtis has only had nine rides for the stable in the past two seasons. Curtis has produced a profit to SP with horses from the top three in the betting for five of the trainers in the table; namely Haggas, Boughey, Palmer, Ellison and Appleby. He has only started riding for Boughey in the past three seasons but it is worth noting that on horses priced 6/1 or shorter the combo has produced a highly impressive 38 winners from 81 runners (SR 38.8%) for an SP profit of £22.10 (ROI +27.6%). To BSP returns increase to +36%. He has ridden a lot for Karl Burke in the past, but last year saw him have just six rides so it is not a combination that is going to produce many more runners it seems.
Before moving away from trainers, Curtis also has an excellent record when riding for two other trainers – for Charlie Hills he is 13 wins from 44 (SR 29.6%) and for George Scott 16 wins from 59 (SR 27.1%).
Ben Curtis: Record by Run Style
Onto run style now, and here is a breakdown of Curtis’s run style in terms of percentage of runners that match each one:

It is good to see he is above the average figure for ALL jockeys when it comes to front runners and also he is below the average for hold up horses. This to me suggests that he has some appreciation about the value of early track position.
Onto his win record on favourites in terms of run style:
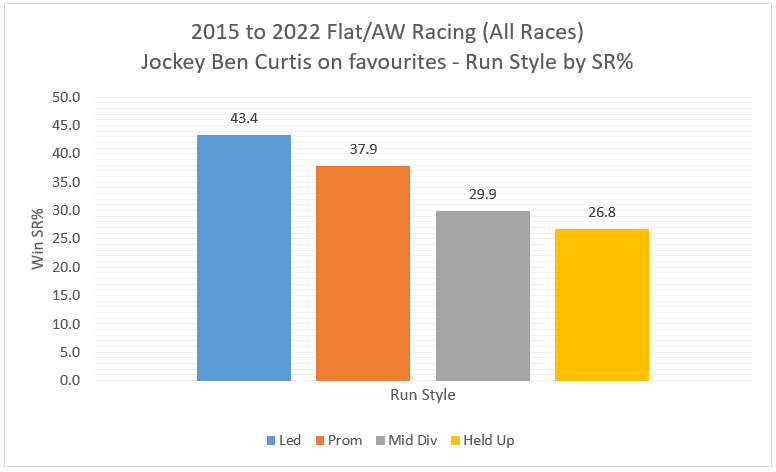
Curtis has a slightly higher SR% figure on prominent favourites to the norm, but the general pattern is seen once more – there is such a simple answer to the question, ‘Would you prefer to be on a front running favourite or a held up favourite?’
It should also be shared that Curtis's front-running favourites were profitable to SP, as were the prominent racing favourites.
Danny Tudhope and Ben Curtis: Main Takeaways
The table below summarises the key takeaways for these two giants of the northern circuit:

So there you have it – two for the price of one!
I hope this article has uncovered a few more angles that may prove profitable for you to deploy over the coming months.
- DR