Statistics for National Hunt Racing in November
The National Hunt season starts to move up a gear as we roll into November, writes Dave Renham. We have the Paddy Power meeting at Cheltenham; the Grand Sefton Chase at Aintree; the Betfair Chase at Haydock featuring the first Grade 1 of the season; the Fighting Fifth Hurdle at Newcastle; the Ascot hurdle, Haldon Gold Cup at Exeter, and on.
In this article I will look at November stats and trends for National Hunt racing in the UK going back as far as 2017. Profit and loss has been calculated to Industry Starting Price (SP), but I will quote Betfair Starting Price (BSP) where appropriate.
Betting Performance by Market Rank, November, 2017-2023
Let's start off by looking at the betting market and the returns to SP (ROI%). Below is a graph with an overview of the top market ranks versus the rest:

Favourites lost the least in terms of return on investment, while horses 5th or bigger in the betting have proved very poor value. To BSP, losses for favourite backers would have been only 1.56% so not far from a break-even scenario.
Favourite Performance, by Race Code, November, 2017-2023
Sticking with favourites let us see the splits when it comes to race code. For the record there were 11 races held on the all-weather that were classified as National Hunt Flat races so I have combined these results with the overall NH Flat race numbers:

Favourites in chases proved the best value – an A/E index of 0.97 is close to that magic 1.00 figure. In contrast, favourites in NH Flat races struggled a fair bit. Even at Betfair SP losses were over 12p in the £ (-12.2%). Be wary of any favourite in a NH Flat race in November which finished 2nd or worse LTO. 70 horses have started favourite after this LTO placing of which 18 have won (SR 25.7%) for a loss of £23.70 (ROI -33.9%). Losses to BSP were still steep at £19.51 (ROI -27.8%).
Favourite Performance, by Race Type, November 2017-2023
A look now at handicap market leaders versus non-handicap favs. Here are the splits:

There is quite a difference here: market leaders in handicaps got to within touching distance of a break-even situation and, to BSP, handicap jollies made a small profit during the study period of £61.52 (ROI +2.8%). Both handicap chase favourites and handicap hurdle favourites proved profitable on 'the machine'.
While I’m discussing favourites, it should be noted that of the 30 such horses in Grade 3 races in November only two have won. A small sample for sure, but one to be aware of.
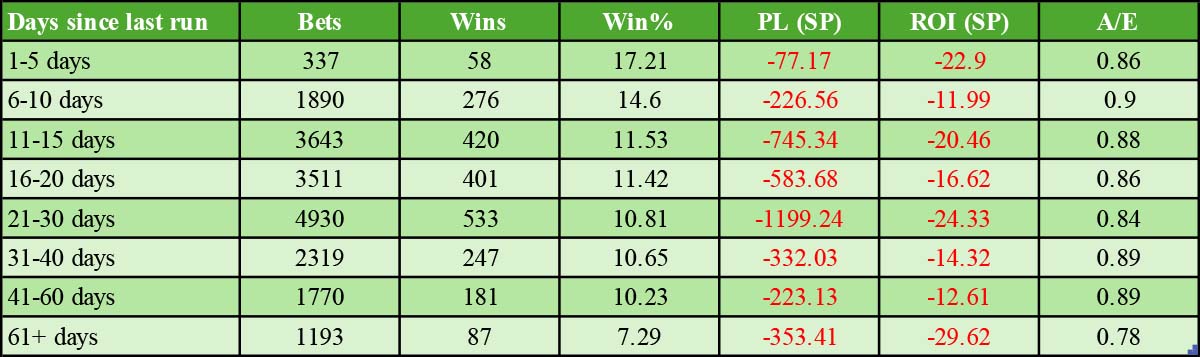
Performance by Last Time Out (LTO) Finishing Position, November, 2017-2023
I want to look at LTO performance next in terms of finishing position. Here are the numbers:

Last day winners were the best of a modest bunch in betting performance terms. Having said that, if betting to BSP, LTO winners only lost 2% of stakes (2p in the £). Sticking with LTO winners, if the horse won LTO when making its seasonal debut - and was thus having its second start of the campaign - such runners recorded a profit at BSP of nearly 5p in the £.
Another LTO winner group worth noting is that of those returning to the track after less than three weeks. This cohort won 90 times from 246 (SR 27.6%) with a small loss to SP of £11.01 (ROI -1.2%), but a profit of £88.87 (ROI +10%) to BSP.
It looks worth almost blindly avoiding LTO runners that fell, were pulled up, or unseated their riders. Their figures are extremely poor (perhaps not surprisingly).
Trainer Performance, November, 2017-2023
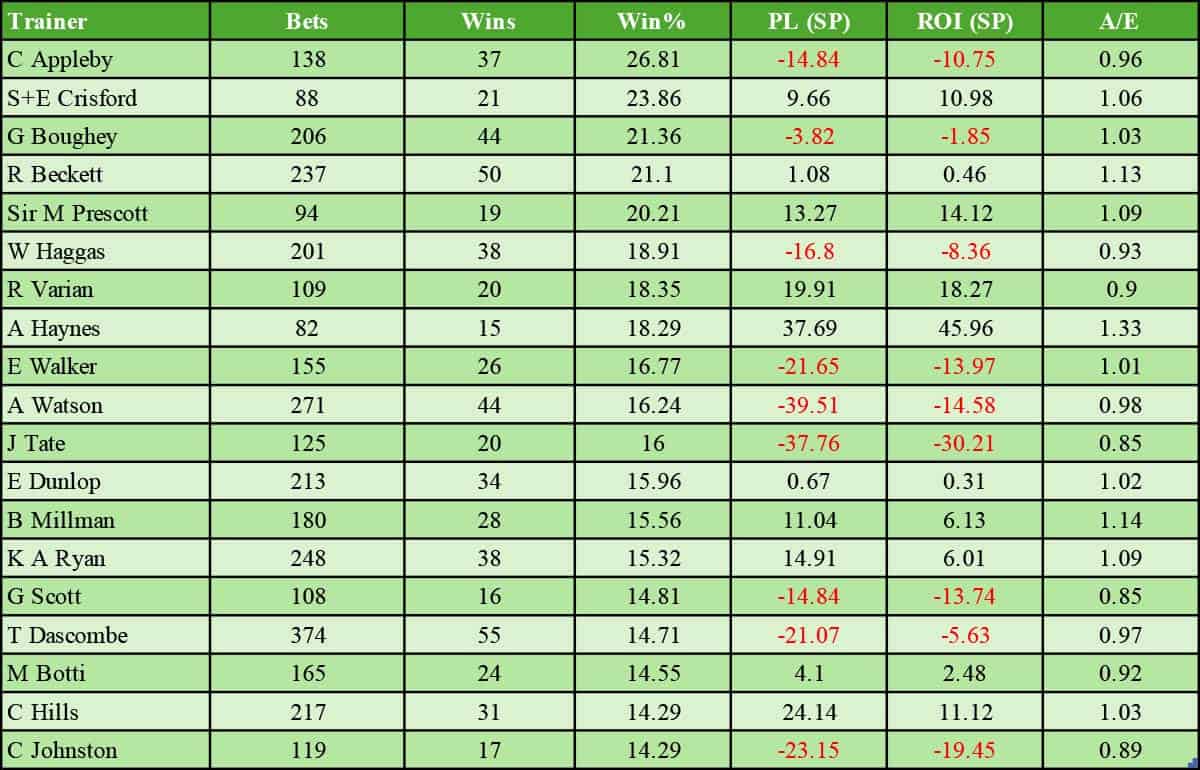
Time to look at trainer stats now and below is a table containing the trainers with the top 20 overall win strike rates during November since 2017. This covers all runs in the month and all prices:

Eight of the 20 handlers notched a blind profit to SP, five of which (Greenall / Guerriero, Fergal O’Brien, Twiston-Davies, Venetia Williams and Symonds) were particularly impressive as they did not have big-priced winners skewing their results. The big guns of Nicky Henderson and Paul Nicholls had plenty of success, but neither offered value across their full runner cohort.
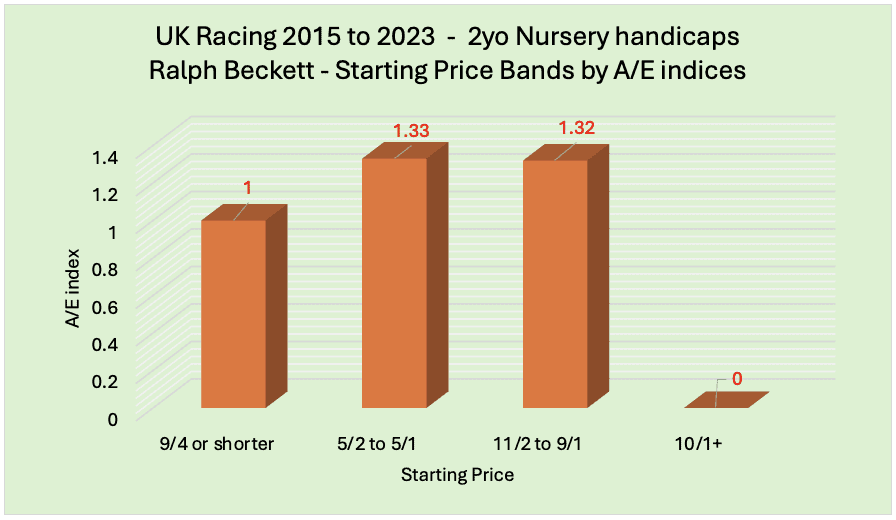
As I have mentioned before, we need to be careful sometimes with trainer data as big-priced winners can skew the profit figures. Hence, I have taken trainers in the above table and compared their A/E indices across two price bands – 9/1 or shorter, and 10/1 or bigger. The first graph shows the trainers whose A/E indices are higher with their shorter priced runners:

For this group of trainers, therefore, we can be more trusting in their overall figures. The A/E indices for horses priced 10/1 or bigger are generally poor. Indeed, Messrs. Greenall and Guerriero had no winners from 30 from that group, and Nicky Henderson managed a solitary score from 81 starters.
Most of these trainers have decent A/E indices with their runners priced 9/1 or shorter. Anything 0.95 or higher I would deem as positive and those trainers with that range of A/E index are shown below along with their complete stats for runners priced 9/1 or shorter:

Five of the nine proved to be profitable while the SP losses for Richards and Henderson were small.
Now let me look at the remaining trainers from the original table whose A/E indices are higher with their bigger priced runners:

Kim Bailey, Jimmy Moffatt and Tom Symonds all had decent A/E indices for both groups, whereas the other four trainers - Newland, McCain, Thomas and Thomson - did not. The overall figures for both Thomas and Thomson in the ‘all runs in November’ table showed good profits, but this graph highlights neatly that their figures were skewed. Indeed, the pair enjoyed a winner apiece at 66/1, while Thomson also saddled a 25/1 winner.
Additional Trainer Statistics
Below are some additional trainer stats that could prove useful to follow this November:
1. Paul Nicholls at Wincanton. This was especially so with horses priced 9/1 or shorter. With this cohort he had 30 winners from 79 (SR 38%) for a profit to SP of £16.09 (ROI +20.4%). To BSP it reads +£24.83 (ROI +31.4%).
2. Nicky Henderson runners priced 9/1 or shorter having their second start of the season. This group produced a 30.2% strike rate (35 wins from 116) for a profit of £23.01 (ROI +19.8%). To BSP this improved to £32.24 (ROI +27.8%). Staying with Henderson, his hurdlers at Newbury produced a 31% strike rate and returns to SP of 18p in the £, 27p to BSP.
3. Three trainers have performed particularly well with horses making their seasonal debuts and their results are shown in the table below:

None of the three have had big-priced winners skewing their results so they are worth keeping an eye out for this November.
4. Chris Gordon at Plumpton. Gordon recorded 11 winners from 39 (SR 28.2%) for a profit to SP of £4.68 (ROI +12%); to BSP £10.45 (ROI +26.8%). When his runners were in the first three of the betting the figures improved to 11 wins from 26 (SR 42.3%) for a profit of £17.69 (ROI +68%) to SP; £23.45 (ROI +90.2%) to BSP.
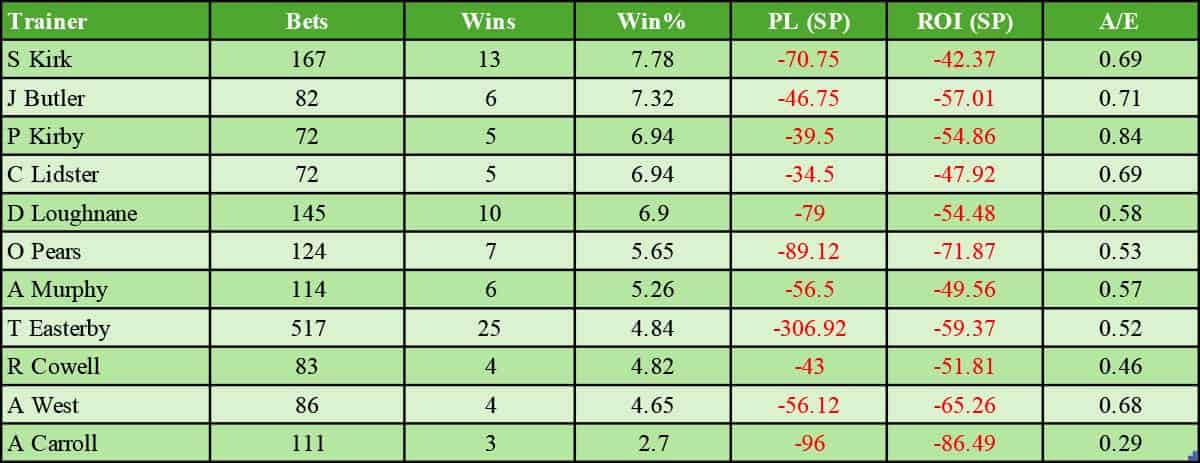
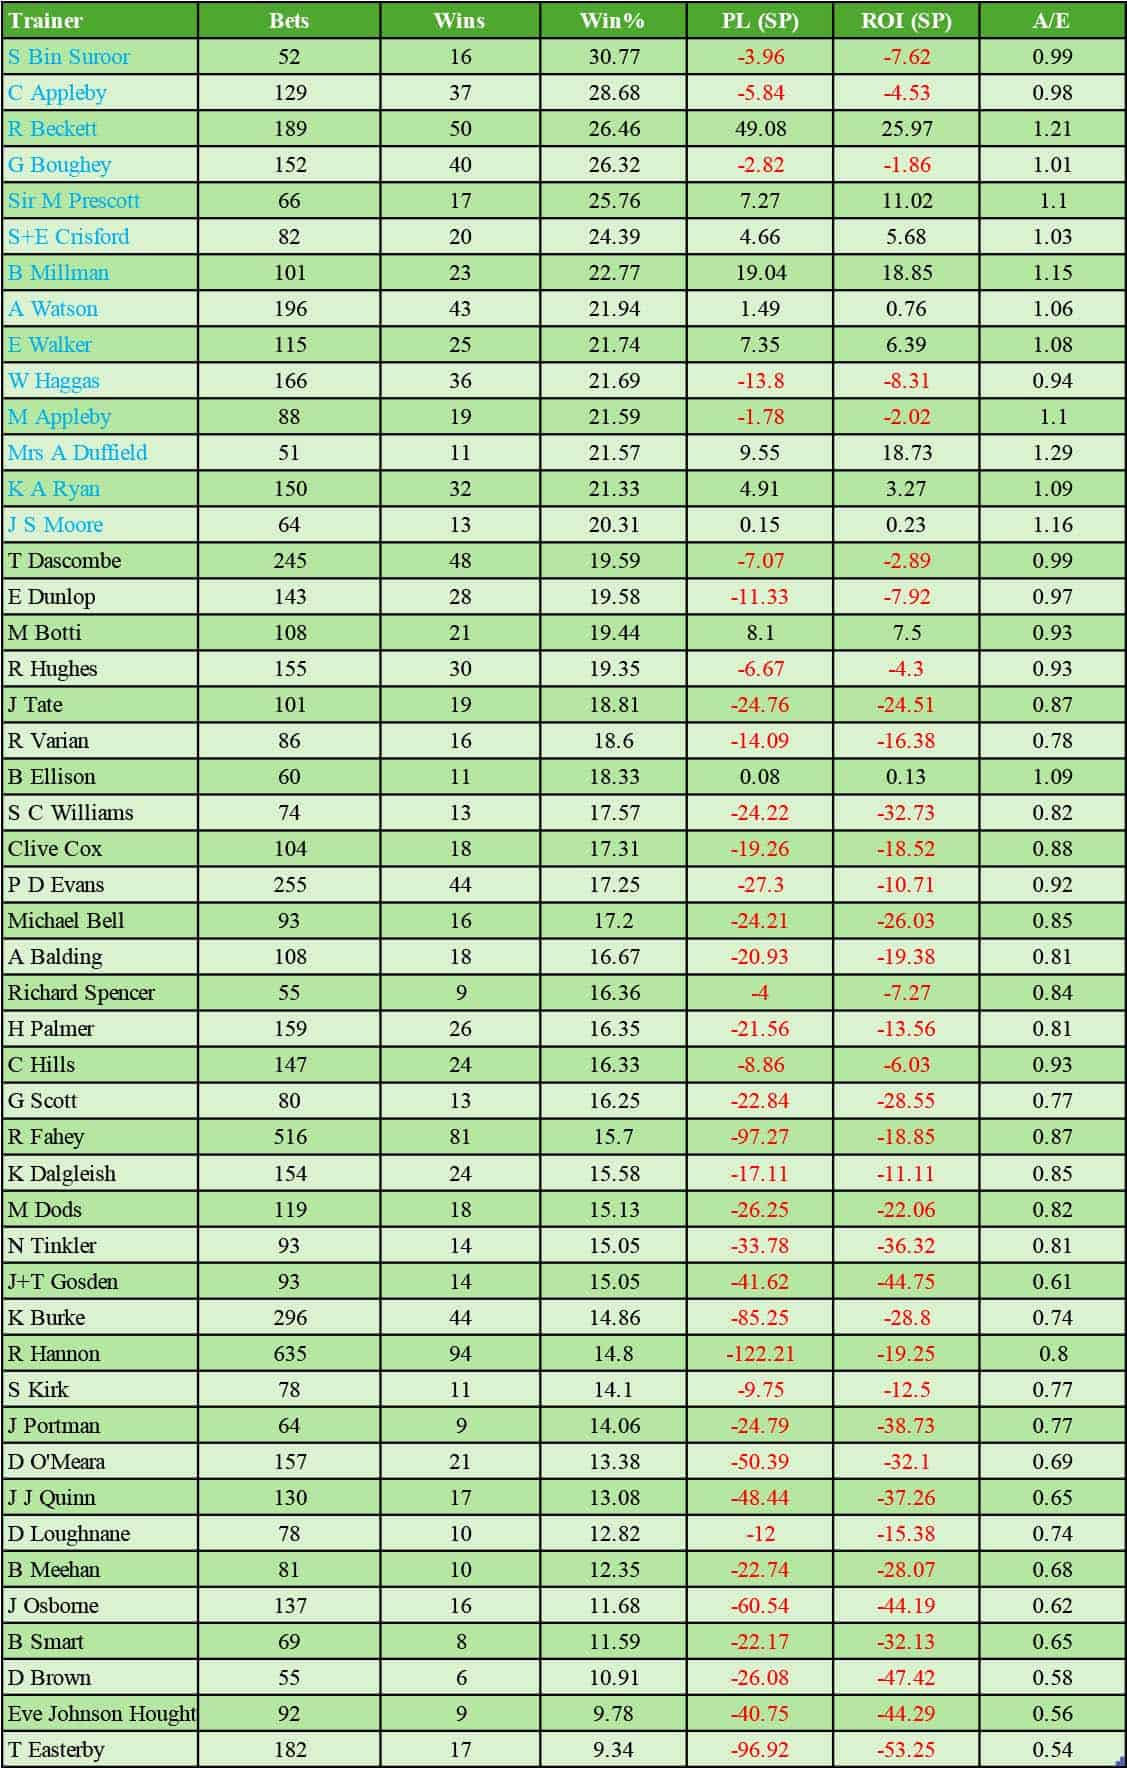
Trainer Performance, 60+ Runners at 9/1 or shorter, November, 2017-2023
Finally in this piece let me share a good chunk of trainer data in one table. Below are the figures for all trainers that have had 60+ runners that have started at an SP of 9/1 or less. Nine of the trainers have had their data displayed above but I have included them here, too, as it makes more sense than to leave them out. The table is ordered by win strike rate:


There are 66 trainers there, so plenty to get your teeth into!
Let’s hope the recent historical data in this piece help to point us in the right direction over the next few weeks. It would be nice to win a bit of extra money with Christmas around the corner!
- DR